


 |
市場調查報告書
商品編碼
2066370
雲端運算高效能運算(HPC):市場佔有率分析、產業趨勢與統計及成長預測(2026-2031 年)Cloud High Performance Computing (HPC) - Market Share Analysis, Industry Trends & Statistics, Growth Forecasts (2026 - 2031) |
||||||

※ 本網頁內容可能與最新版本有所差異。詳細情況請與我們聯繫。
據 Mordor Intelligence 稱,2025 年雲端運算高效能運算市場價值為 352.1 億美元,預計到 2031 年將達到 479.3 億美元,而 2026 年為 370.7 億美元,預測期(2026-2031 年)的複合年成長率為 5.28%。
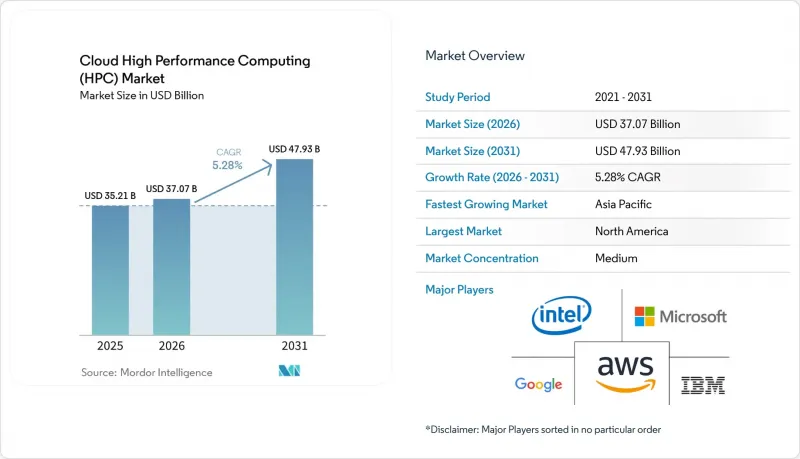
本報告按組件(硬體、軟體、服務)、部署模式(公共雲端等)、服務模式(基礎設施即服務等)、產業應用(航太和國防等)、組織規模(大型企業、中小企業)和地區進行細分。市場預測以價值(美元)表示。
全球雲端運算高效能運算 (HPC) 市場趨勢與洞察
雲端高效能運算中人工智慧和生成式工作負載的激增
目前,人工智慧 (AI) 訓練佔雲端高效能運算 (HPC) 總週期數的 40%,較 2022 年的 15% 顯著成長。這一激增反映了基於變壓器 的語言和視覺模型的特性,這些模型需要龐大的運算資源。大規模批量處理、分散式資料並行演算法以及對精細調優超參數的探索,都需要連續數天同時使用數千個 GPU,而這與本地固定容量的運算能力不相容。因此,雲端平台提供彈性叢集,可以即時推出用於模型訓練,並在檢驗完成後關閉,從而最大限度地減少資源閒置。 2024 年,亞馬遜網路服務 (AWS) 發布了 Deadline Cloud,用於可擴展的 AI 輔助媒體渲染,展現了其在特定工作負載服務方面的強大能力。國防機構和製藥公司也呈現類似的趨勢,利用雲端超級運算進行語言驅動的分子設計和自動駕駛車輛感知流程,以縮短研發週期並加快獲得洞察的速度。
高頻寬互連和加速器的快速擴展
新一代互連架構,例如 NVIDIA Quantum-2 InfiniBand 和新推出的 800Gigabit乙太網路鏈路,如今已實現微秒延遲,使得緊密耦合的訊息傳遞應用程式能夠在雲端運行而不會出現明顯的效能下降。 GPU 技術的進步,例如基於 NVIDIA Grace Hopper 超級晶片和英特爾 Ponte Vecchio 資料中心 GPU,在提高單節點吞吐量的同時,也提升了能源效率。超大規模資料中心業者正擴大整合客製化 ASIC 來平衡運算、記憶體和網路流量,從而有效地彌合了先前商業雲和國家實驗室超級電腦之間存在的差距。這些技術飛躍對於依賴高密度、低延遲節點互連的天氣預報、碰撞模擬和地震成像解決方案至關重要。
雲端出站傳輸和資料傳輸成本不斷上升。
在PBPetabyte模擬中,資料傳輸成本可能超過運算成本的200%,抵銷了按需資源帶來的成本節約。基因組學流程、地震成像和高密度蒙特卡羅工作負載的資料傳輸成本會隨著每次迭代而急劇上升,因為中間檔案需要在物件儲存、資料庫和下游分析平台之間反覆傳輸。儘管超大規模資料中心業者正在推出折扣調查通道和離線傳輸設備,但根本性的成本挑戰仍然存在。因此,各組織正在考慮採用能夠最大限度減少資料往返次數的架構、採用原位分析或後處理環境部署在更靠近模擬節點的位置,但每一種變通方案都會引入新的運維複雜性。
細分市場分析
預計到2025年,硬體收入將佔總營收的44.12%,凸顯了配備GPU、高頻寬記憶體和NVMe儲存陣列的資料中心機櫃的資本密集特性。 NVIDIA已確認雲端服務供應商是其成長最快的商業管道,這表明公司將繼續增加對加速器和互連交換器的投入。隨著雲端營運商不斷追求降低每兆次浮點運算的功耗,各廠商正透過節點密度、能源效率和散熱最佳化外形規格來凸顯自身優勢。
同時,軟體產業展現出最強勁的成長勢頭,預計2031年將維持8.42%的複合年成長率。這主要得益於能夠即時調整資源分配的調度器、人工智慧驅動的效能分析器以及多重雲端和混合環境的工作流程管理器。此外,軟體產業雲端高效能運算(HPC)市場的擴張也得益於訂閱式授權模式,該模式根據實際使用時間調整成本,從而將預算從資本支出轉向營運支出。
預計到2025年,公共雲端將佔據67.95%的市場佔有率,繼續為媒體渲染、電腦輔助工程和生命搜尋等具有彈性、企劃為基礎導向、模擬密集型處理能力的場景提供基礎架構。服務提供者透過提供精細化的收費方式、利用競價池處理不太緊急的任務以及維護區域性分區以符合資料居住法規,來獲取工作負載。
儘管規模較小,但私有雲端預計將以 7.52% 的複合年成長率成長,因為這個高度監管的行業優先考慮確定性延遲和自主控制。企業正在基於融合型高效能運算 (HPC) 設備建立內部雲,這些設備在保持空氣間隙安全性的同時,模擬了超大規模資料中心的彈性。混合編排器整合了這些環境,為使用者提供了一個統一的作業提交門戶,該門戶根據成本曲線和佇列深度分配作業。
區域分析
預計到2025年,北美將維持39.94%的市佔率。這得益於高密度超大規模基礎設施和聯邦政府主導的百萬兆級舉措,這些計劃為雲端優先架構提供了有力支撐。國防和航太機構持續的改進資金支持了對高階模擬技術的持續需求,而蓬勃發展的半導體設計、自主系統和數位媒體商業生態系統則鞏固了該地區的領先地位。資料出口和加密相關法規的進一步明確,正在加速高監管產業採用雲端高效能運算技術。
亞太地區未來成長率最高,年複合成長率達8.77%,這得益於世界各國政府投入數十億美元建設國家主導的人工智慧和半導體設計能力。儘管先進加速器出口受到限制,中國仍在加大對國產GPU替代方案和量子-經典混合運算中心的投資,以增加其雲端高效能運算預算。日本正將其高效能運算藍圖與「工業5.0」策略相契合,並推動智慧製造從邊緣到雲端的整合。同時,印度的「數位公共基礎設施」舉措正在催生對使用地方方言進行大規模語言建模的需求。區域通訊業者正與超大規模資料中心業者資料中心營運商合作,並在國內部署可用區,以緩解資料本地化問題,並促進更廣泛的市場准入。
歐洲正穩步推進,但更為謹慎,這得益於歐洲高效能運算合資企業(EHPC)的支援。該合資企業共同投資歐盟內部的百億億次級系統。德國汽車製造商在本地叢集達到容量極限時,會將空氣動力學模擬任務卸載到雲端實例;北歐可再生能源公司則利用由豐富的水力發電驅動的低碳資料中心。遵守《一般資料保護規則》(GDPR)正在推動混合部署模式的出現,在這種模式下,敏感的遙測資料保留在本地,而利用雲端的規模進行大規模實驗設計。國家數位化策略和碳中和目標正在影響採購模式,並推動綠色認證雲端區域的普及。
其他好處:
- Excel格式的市場預測(ME)表
- 3個月的分析師支持
目錄
第1章:引言
- 研究假設和市場定義
- 調查範圍
第2章:調查方法
第3章執行摘要
第4章 市場狀況
- 市場概覽
- 市場促進因素
- 雲端高效能運算中人工智慧和生成式工作負載的激增
- 高頻寬互連和加速器的快速擴展
- 混合雲和多重雲端運算策略的廣泛應用
- 提高了針對高效能運算最佳化的雲端實例的可用性
- 對以永續性為中心的高效能運算基礎設施的需求
- 政府主導的百萬兆級和主權人工智慧舉措
- 市場限制因素
- 雲端出站通訊和資料傳輸。
- 雲端原生高效能運算維運人員短缺
- 對先進加速器的出口限制
- 對於對延遲敏感的工作負載,本地叢集仍然是首選解決方案。
- 產業價值鏈分析
- 監理情勢
- 技術展望
- 波特五力分析
- 宏觀經濟因素對市場的影響
第5章 市場規模與成長預測
- 按組件
- 硬體
- 伺服器
- 貯存
- 網路裝置
- 加速器(GPU/TPU)
- 軟體
- 服務
- 硬體
- 按部署模式
- 公共雲端
- 私有雲端
- 混合雲端
- 按服務模式
- Infrastructure as a Service(IaaS)
- Platform as a Service(PaaS)
- Software as a Service(SaaS)
- 託管高效能運算服務
- 透過工業應用
- 航太/國防
- 能源公用事業
- 銀行業、金融服務業及保險業
- 媒體與娛樂
- 製造業
- 生命科學與醫療保健
- 學術研究和調查
- 政府
- 其他工業用途
- 按組織規模
- 大公司
- 小型企業
- 按地區
- 北美洲
- 美國
- 加拿大
- 墨西哥
- 南美洲
- 巴西
- 阿根廷
- 其他南美國家
- 歐洲
- 英國
- 德國
- 法國
- 義大利
- 西班牙
- 其他歐洲國家
- 亞太地區
- 中國
- 日本
- 印度
- 韓國
- 其他亞太國家
- 中東
- 阿拉伯聯合大公國
- 沙烏地阿拉伯
- 土耳其
- 其他中東國家
- 非洲
- 南非
- 奈及利亞
- 其他非洲國家
- 北美洲
第6章 競爭情勢
- 市場集中度
- 策略趨勢
- 市佔率分析
- 公司簡介
- Amazon Web Services Inc.
- Microsoft Corporation
- Google LLC
- International Business Machines Corporation
- Hewlett Packard Enterprise Company
- Dell Technologies Inc.
- NVIDIA Corporation
- Advanced Micro Devices Inc.
- Intel Corporation
- Lenovo Group Limited
- NEC Corporation
- Fujitsu Limited
- Sugon Information Industry Co. Ltd.
- Atos SE
- Dassault Systemes SE
- Oracle Corporation
- Huawei Technologies Co., Ltd.
- Alibaba Group Holding Limited(Alibaba Cloud)
- Rescale Inc.
- Penguin Computing Inc.
第7章 市場機會與未來展望
According to Mordor Intelligence, the cloud high performance computing market size was valued at USD 35.21 billion in 2025 and estimated to grow from USD 37.07 billion in 2026 to reach USD 47.93 billion by 2031, at a CAGR of 5.28% during the forecast period (2026-2031).
This report is Segmented by Component (Hardware, Software, and Services), Deployment Model (Public Cloud, and More), Service Model (Infrastructure As A Service, and More), Industrial Application (Aerospace and Defense, and More), Organization Size (Large Enterprises, and Small and Medium Enterprises), and Geography. The Market Forecasts are Provided in Terms of Value (USD).
Global Cloud High Performance Computing (HPC) Market Trends and Insights
Surging AI and Generative Workloads in Cloud HPC
Artificial intelligence training now consumes 40% of total cloud HPC cycles, up from 15% in 2022, a leap that reflects the compute-hungry nature of transformer-based language and vision models. Large batch sizes, distributed data-parallel algorithms, and fine-tuned hyper-parameter searches require thousands of GPUs for days at a time, conditions that correlate poorly with fixed on-premises capacity. Cloud platforms, therefore, supply elastic clusters that can be spun up for model training and spun down once validation is complete, minimizing idle capital. In 2024, Amazon Web Services released Deadline Cloud for scalable AI-assisted media rendering, signaling the depth of workload-tailored offerings. Defense and pharmaceutical organizations follow a similar pattern, utilizing cloud supercomputing for language-driven molecular design and autonomous vehicle perception pipelines, thereby shortening R&D loops and compressing time-to-insight.
Rapid Expansion of High-Bandwidth Interconnects and Accelerators
Next-generation fabrics, such as NVIDIA Quantum-2 InfiniBand and emerging 800-Gigabit Ethernet links, now deliver microsecond-level latency, enabling tightly coupled message-passing applications to run in the cloud without significant performance penalties. GPU advances, led by NVIDIA-based Grace Hopper superchips and Intel's Ponte Vecchio data-center GPUs, increase per-node throughput while improving energy efficiency.Hyperscalers are increasingly integrating custom ASICs to balance compute, memory, and network flows, effectively bridging the historical gaps between commercial clouds and national lab supercomputers. These technical leaps are pivotal for weather prediction, crash simulation, and seismic imaging solutions that rely on dense, low-latency node interconnects.
Elevated Cloud Egress and Data-Movement Costs
For multi-petabyte simulations, outbound data charges can eclipse compute fees by 200%, eroding the savings realized from on-demand resources. Genomics pipelines, seismic imaging, and high-density Monte Carlo workloads repeatedly shuttle intermediate files between object stores, databases, and downstream analytics platforms, amplifying the egress bill with each iteration. While hyperscalers have introduced reduced-tariff research channels and offline transfer appliances, the foundational economics remain challenging. Organizations therefore weigh architecture choices that minimize data round-trips, adopt in-situ analytics, or colocate post-processing near the simulation nodes, yet each workaround carries new operational complexity.
Other drivers and restraints analyzed in the detailed report include:
- Growing Adoption of Hybrid and Multicloud HPC Strategies
- Increasing Availability of HPC-Optimized Cloud Instances
- Talent Shortage in Cloud-Native HPC Operations
For complete list of drivers and restraints, kindly check the Table Of Contents.
Segment Analysis
Hardware contributed 44.12% of 2025 revenue, underscoring the capital-intensive nature of datacenter racks loaded with GPUs, high-bandwidth memory, and NVMe-backed storage arrays. NVIDIA confirmed that cloud providers form its fastest-growing commercial channel, a testament to ongoing spending on accelerators and interconnect switches. Vendors anchor differentiation around node density, energy efficiency, and thermally optimized form factors, as fleet operators chase lower watts per teraflop.
Software, however, posts the highest momentum, with an expected 8.42% CAGR through 2031, driven by schedulers that tune allocations in real-time, AI-assisted performance profilers, and workflow managers that span multicloud and hybrid estates. The expansion of the Cloud High Performance Computing market size on the software side also benefits from subscription licensing models that align costs with active use minutes, shifting budgets from capital to operating expenses.
The public cloud garnered 67.95% share in 2025 and remains the backbone for elastic, project-based simulation bursts that characterize media rendering, computer-aided engineering, and life sciences searches. Providers win workloads by exposing granular billing meters, utilizing spot pools for non-urgent jobs, and maintaining regional zones to comply with data-residency laws.
Private cloud, while smaller, is projected to log a 7.52% CAGR as regulated verticals emphasize deterministic latency and sovereign control. Enterprises craft internal clouds atop converged HPC appliances that mimic the elasticity of hyperscale data centers while maintaining air-gapped security. Hybrid orchestrators integrate these estates, presenting users with a single submission portal that assigns jobs based on cost curves and queue depth.
Geography Analysis
North America retained 39.94% share in 2025, supported by dense hyperscale footprints and federally backed exascale initiatives that validate cloud-first architectures. Continuous improvement funds from defense and space agencies feed sustained demand for advanced simulation, while a vibrant commercial ecosystem of semiconductor design, autonomous systems, and digital media consolidates regional leadership. Regulatory clarity regarding data export and encryption further accelerates cloud HPC adoption in heavily controlled industries.
The Asia-Pacific region records the highest forward growth at a 8.77% CAGR as governments earmark billions for sovereign AI and semiconductor design capacity. China increases cloud HPC budgets despite export constraints on advanced accelerators by investing in homegrown GPU alternatives and quantum-classical hybrid centers. Japan aligns HPC roadmaps with Society 5.0, pushing edge-to-cloud integration for smart manufacturing, while India's Digital Public Infrastructure initiative creates demand for large-scale language modeling in regional dialects. Regional telcos partner with hyperscalers to host in-country availability zones, alleviating data-locality concerns and facilitating broader market entry.
Europe commands a strong though more measured trajectory, aided by the European High-Performance Computing Joint Undertaking that co-finances petascale systems within EU borders. Automotive OEMs in Germany offload aerodynamic simulations to cloud instances when factory clusters max out, and renewable energy operators in the Nordics harness low-carbon datacenters driven by abundant hydro power. GDPR compliance stimulates hybrid adoption patterns, keeping sensitive telemetry on-premises but using cloud scale for large design-of-experiments runs. National digital strategies and carbon-neutral targets jointly influence procurement models, nudging adoption toward green-certified cloud regions.
- Amazon Web Services Inc.
- Microsoft Corporation
- Google LLC
- International Business Machines Corporation
- Hewlett Packard Enterprise Company
- Dell Technologies Inc.
- NVIDIA Corporation
- Advanced Micro Devices Inc.
- Intel Corporation
- Lenovo Group Limited
- NEC Corporation
- Fujitsu Limited
- Sugon Information Industry Co. Ltd.
- Atos SE
- Dassault Systemes SE
- Oracle Corporation
- Huawei Technologies Co., Ltd.
- Alibaba Group Holding Limited (Alibaba Cloud)
- Rescale Inc.
- Penguin Computing Inc.
Additional Benefits:
- The market estimate (ME) sheet in Excel format
- 3 months of analyst support
TABLE OF CONTENTS
1 INTRODUCTION
- 1.1 Study Assumptions and Market Definition
- 1.2 Scope of the Study
2 RESEARCH METHODOLOGY
3 EXECUTIVE SUMMARY
4 MARKET LANDSCAPE
- 4.1 Market Overview
- 4.2 Market Drivers
- 4.2.1 Surging AI and Generative Workloads in Cloud HPC
- 4.2.2 Rapid Expansion of High-Bandwidth Interconnects and Accelerators
- 4.2.3 Growing Adoption of Hybrid and Multicloud HPC Strategies
- 4.2.4 Increasing Availability of HPC-Optimized Cloud Instances
- 4.2.5 Demand for Sustainability-Focused HPC Infrastructure
- 4.2.6 Government-Funded Exascale and Sovereign AI Initiatives
- 4.3 Market Restraints
- 4.3.1 Elevated Cloud Egress and Data-Movement Costs
- 4.3.2 Talent Shortage in Cloud-Native HPC Operations
- 4.3.3 Export Controls on Advanced Accelerators
- 4.3.4 Latency-Sensitive Workloads Still Favor On-Premises Clusters
- 4.4 Industry Value Chain Analysis
- 4.5 Regulatory Landscape
- 4.6 Technological Outlook
- 4.7 Porter's Five Forces Analysis
- 4.7.1 Threat of New Entrants
- 4.7.2 Bargaining Power of Buyers
- 4.7.3 Bargaining Power of Suppliers
- 4.7.4 Threat of Substitute Products
- 4.7.5 Intensity of Competitive Rivalry
- 4.8 Impact of Macroeconomic Factors on the Market
5 MARKET SIZE AND GROWTH FORECASTS (VALUE)
- 5.1 By Component
- 5.1.1 Hardware
- 5.1.1.1 Servers
- 5.1.1.2 Storage
- 5.1.1.3 Networking Devices
- 5.1.1.4 Accelerators (GPUs/TPUs)
- 5.1.2 Software
- 5.1.3 Services
- 5.1.1 Hardware
- 5.2 By Deployment Model
- 5.2.1 Public Cloud
- 5.2.2 Private Cloud
- 5.2.3 Hybrid Cloud
- 5.3 By Service Model
- 5.3.1 Infrastructure as a Service (IaaS)
- 5.3.2 Platform as a Service (PaaS)
- 5.3.3 Software as a Service (SaaS)
- 5.3.4 Managed HPC Services
- 5.4 By Industrial Application
- 5.4.1 Aerospace and Defence
- 5.4.2 Energy and Utilities
- 5.4.3 Banking, Financial Services and Insurance
- 5.4.4 Media and Entertainment
- 5.4.5 Manufacturing
- 5.4.6 Life Science and Healthcare
- 5.4.7 Academic and Research
- 5.4.8 Government
- 5.4.9 Other Industrial Applications
- 5.5 By Organization Size
- 5.5.1 Large Enterprises
- 5.5.2 Small and Medium Enterprises
- 5.6 By Geography
- 5.6.1 North America
- 5.6.1.1 United States
- 5.6.1.2 Canada
- 5.6.1.3 Mexico
- 5.6.2 South America
- 5.6.2.1 Brazil
- 5.6.2.2 Argentina
- 5.6.2.3 Rest of South America
- 5.6.3 Europe
- 5.6.3.1 United Kingdom
- 5.6.3.2 Germany
- 5.6.3.3 France
- 5.6.3.4 Italy
- 5.6.3.5 Spain
- 5.6.3.6 Rest of Europe
- 5.6.4 Asia Pacific
- 5.6.4.1 China
- 5.6.4.2 Japan
- 5.6.4.3 India
- 5.6.4.4 South Korea
- 5.6.4.5 Rest of Asia Pacific
- 5.6.5 Middle East
- 5.6.5.1 United Arab Emirates
- 5.6.5.2 Saudi Arabia
- 5.6.5.3 Turkey
- 5.6.5.4 Rest of Middle East
- 5.6.6 Africa
- 5.6.6.1 South Africa
- 5.6.6.2 Nigeria
- 5.6.6.3 Rest of Africa
- 5.6.1 North America
6 COMPETITIVE LANDSCAPE
- 6.1 Market Concentration
- 6.2 Strategic Moves
- 6.3 Market Share Analysis
- 6.4 Company Profiles (includes Global Level Overview, Market Level Overview, Core Segments, Financials as available, Strategic Information, Market Rank/Share for key companies, Products and Services, and Recent Developments)
- 6.4.1 Amazon Web Services Inc.
- 6.4.2 Microsoft Corporation
- 6.4.3 Google LLC
- 6.4.4 International Business Machines Corporation
- 6.4.5 Hewlett Packard Enterprise Company
- 6.4.6 Dell Technologies Inc.
- 6.4.7 NVIDIA Corporation
- 6.4.8 Advanced Micro Devices Inc.
- 6.4.9 Intel Corporation
- 6.4.10 Lenovo Group Limited
- 6.4.11 NEC Corporation
- 6.4.12 Fujitsu Limited
- 6.4.13 Sugon Information Industry Co. Ltd.
- 6.4.14 Atos SE
- 6.4.15 Dassault Systemes SE
- 6.4.16 Oracle Corporation
- 6.4.17 Huawei Technologies Co., Ltd.
- 6.4.18 Alibaba Group Holding Limited (Alibaba Cloud)
- 6.4.19 Rescale Inc.
- 6.4.20 Penguin Computing Inc.
7 MARKET OPPORTUNITIES AND FUTURE OUTLOOK
- 7.1 White-Space and Unmet-Need Assessment

 2026年全球高效能運算平台(人工智慧應用)市場報告
 全球資料中心運算與人工智慧市場(2027-2040 年)
 資料處理單元市場報告:趨勢、預測與競爭分析(至2035年)
 高效能運算市場機會、成長要素、產業趨勢分析及2026-2035年預測。
 混合量子與經典計算軟體:市場佔有率分析、產業趨勢與統計及成長預測(2026-2031)高效能運算:市場佔有率分析、產業趨勢與統計及成長預測(2026-2031 年)
 高效能運算市場:按組件、技術、資料類型、最終用戶、部署模式和組織規模分類-2026-2032年全球市場預測加速計算:市場佔有率分析、行業趨勢和統計數據、成長預測(2026-2031 年)異質計算:市場佔有率分析、產業趨勢與統計、成長預測(2026-2031)高效能運算 (HPC) 市場規模、佔有率、成長率和全球產業分析:按類型、應用和地區分類的洞察,2026-2034 年預測