


 |
市場調查報告書
商品編碼
2121688
高效能運算:市場佔有率分析、產業趨勢與統計及成長預測(2026-2031 年)High Performance Computing - Market Share Analysis, Industry Trends & Statistics, Growth Forecasts (2026 - 2031) |
||||||

※ 本網頁內容可能與最新版本有所差異。詳細情況請與我們聯繫。
根據 Mordor Intelligence 預測,高效能運算 (HPC) 市場規模將從 2025 年的 557.8 億美元和 2026 年的 601.2 億美元成長到 2031 年的 875 億美元,2026 年至 2031 年的年複合成長率(CAGR)為 7.79%。
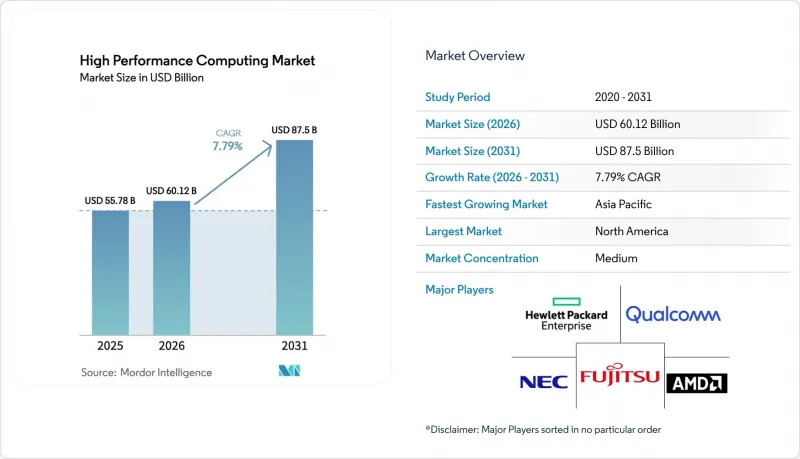
本報告按組件(硬體、軟體、服務)、部署模式(本地部署、雲端部署、混合部署)、產業應用(政府和國防、學術和研究機構、銀行、金融服務和保險 (BFSI)、製造業和汽車工程等)、晶片類型(CPU、GPU、FPGA、ASIC/AI 加速器)以及地區進行細分。市場預測以美元 (USD) 為單位。
全球高效能運算市場趨勢與洞察
美國聯邦實驗室和一級雲端服務供應商的人工智慧和機器學習訓練工作負載呈現爆炸性成長。
聯邦機構現在正將千兆次級(petaflop)的基礎設施整合到其營運中的人工智慧流程中,而不是依賴孤立的研究沙箱。橡樹嶺國家實驗室(Oak Ridge National Laboratory)的1.2百億億次級(exaflop)「前沿」(Frontier)超級電腦正在訓練基礎模型,這些模型將把電池化學的研發週期從18個月縮短到6週,這標誌著從探索性基準測試到實際應用成果的轉變。美國國家科學基金會(NSF)的「2025創世紀計畫」(2025 Genesis Mission)正在撥款8億美元,用於建立一個涵蓋20所大學的分散式人工智慧叢集,這將大大擴展該地區高效能運算市場資源的獲取途徑。微軟Azure的ND H100 v5實例提供每秒3.2Terabit的InfiniBand網路架構,使製藥公司能夠在無需跨區域剪切機的情況下建構1000億個參數變壓器。聯邦政府和私營部門的這些聯合獎勵策略正在加速 GPU 升級週期,使得傳統的 A100 節點在處理兆參數工作負載時經濟上過時,並進一步增加了對稀缺的基於 HBM3e 的加速器的需求。
亞洲製藥外包中心對GPU加速分子動力學模擬的需求激增。
中國和印度的受託研究機構(CRO) 正在部署數千個 GPU,將小分子結合模擬所需的時間從數週縮短至數小時,從而與歐美成熟的製藥公司競爭。藥明康德的上海叢集擁有 5000 個 GPU,每季篩檢1000 萬個化合物,吞吐量是 CPU 的 40 倍。此外,電力補貼和稅收優惠使得 GPU 的每小時使用成本比北美實驗室低約 60%。印度的 PARAM Rudra 計劃將其 2025 年計算預算的三分之一分配給印度科學與工業研究理事會 (CSIR) 下屬的實驗室,透過將 AlphaFold 生成的蛋白質結構與 GPU 驅動的對接引擎融合,加速結核病治療藥物的發現。這種地域優勢正在推動製藥業的前臨床開發平臺向東轉移,進一步鞏固其在亞太地區高效能運算市場的長期佔有率。
美國一些易受乾旱影響的州正在收緊資料中心的用水限制。
目前,水資源短缺是位置的決定性因素。加州工業用水量減少20%迫使三級設施維修乾式冷卻,這將使電力消耗量增加15%,到2025年,每個設施的維修成本將增加5,000萬美元。亞利桑那州暫停了鳳凰城新的地下水使用許可,迫使建築商要么採用封閉回路型液冷系統,要么放棄項目。由於缺乏水權,Google推遲了在內華達州建設一座200兆瓦高效能運算(HPC)站點的計劃,轉而採用成本更高的風冷系統。運算能力正在向北轉移到奧勒岡州和華盛頓州等州,但這種遷移將增加加州人工智慧新創公司的延遲,這些公司先前在單一區域內的往返時間不到10毫秒。
細分市場分析
服務業正經歷最快的成長,預計從2026年到2031年將以9.42%的複合年成長率成長,這主要得益於企業從數百萬美元的計量收費投資轉向「按需付費的核心時間合約」。儘管硬體在2025年仍佔營收的51.54%,但服務業的高效能運算(HPC)市場預計到2031年將超過300億美元,從而縮小先前存在的差距。諸如託管HPC和HPC即服務等服務使航太和銀行業的客戶能夠在兩天的突發高峰期內啟動10萬核叢集,而無需將資金綁定到五年折舊免稅額週期,即使需求間歇性波動,也能提供更大的預算柔軟性。系統整合專案現在將應用程式移植、程式碼重構和效能調優打包提供,這一趨勢在需要重寫GPU最佳化程式碼以利用並行性的傳統Fortran和C語言核心中尤其明顯。然而,在硬體領域,GPU 加速節點的供應仍然緊張,而 700 瓦的設備將機架密度推高至 120 千瓦以上,因此晶片級液冷至關重要。
專業服務供應商越來越傾向於以即時(實際運行時間)而非正常運行時間百分比來衡量效能目標,並將獎勵與客戶成果掛鉤。快閃記憶體陣列在運轉率敏感型工作負荷中佔據主導地位,而物件儲存庫則用於Exabyte級基因組學檔案。互連設備的銷售正從成本敏感型買家的 400Gigabit乙太網路轉向頂級部署的 InfiniBand NDR,後者需要在 10 天內訓練 1000 億個參數模型。軟體銷售雖然規模較小,但支援工作排程、資料編配和混合突發自動化,從而在高效能運算市場中實現策略主導的部署,並考慮雲端競價定價和資料居住規則。這些變化共同重塑了供應商的利潤結構,長期價值創造正轉向持續服務。
儘管雲端運算收入在2025年佔總營收的48.88%,但由於安全性和成本方面對混合方案的需求不斷成長,混合部署的高效能運算市場預計將以8.22%的複合年成長率成長至2031年,成為成長最快的市場。企業意識到,對於持續時間超過18個月的工作負載,在自有基礎設施上運行可以降低總體擁有成本(TCO),而雲端突發對於季節性運算和探索性運算仍然具有優勢。受亞毫秒延遲和空氣間隙安全要求的限制,國防機構和高頻交易員將控制平面保留在本地,同時在非工作時間將參數掃描外包給公共雲端。斯倫貝謝公司在2025年向「休士頓+OCI」模式的轉型凸顯了混合環境的成本節約潛力,預計三年內可減少1.2億美元的資本支出。
隨著工作負荷可移植性的提高,維運的複雜性也隨之增加。由於每GB 0.12美元的資料傳輸成本使得Petabyte級資料傳輸在經濟上效率低下,企業在選擇運行地點時,優先考慮計算與資料的比例。諸如IBM Spectrum LSF和HPE Slingshot之類的Kubernetes原生調度器可以實現部署自動化,但合規負責人仍然會仔細審查跨境資料流,以滿足GDPR和特定產業法規的要求。雲端服務供應商正在透過提供具有資料居住保證的區域特定高效能運算(HPC)區域來應對這項挑戰,但這些服務價格不菲。混合運算的快速發展最終將重塑高效能運算市場,推動網路設備、儲存閘道器和可觀測性堆疊向多站點拓撲最佳化。
區域分析
預計到2025年,北美將佔全球營收的40.48%,這主要得益於美國聯邦政府35億美元的百億億百萬兆級運算資金投入,以及超大規模雲端服務供應商每年在人工智慧最佳化資料中心方面超過2,000億美元的投資。隨著量子退火供應商D-Wave交付用於投資組合最佳化的1萬個量子位元系統,加拿大的高效能運算市場正在擴張,該系統能夠為金融機構連接經典和量子工作流程。墨西哥的市場規模仍然小規模,通用汽車(GM)在托盧卡建設的5千兆次浮點叢集支援近岸汽車碰撞模擬。從地域上看,加州的用水限制和維吉尼亞的資料中心建設禁令正在將新建設轉移到奧勒岡州、華盛頓州和德克薩斯州,這正在悄悄改變矽谷先前青睞的延遲格局。
亞太地區預計將以7.98%的複合年成長率實現最快成長,這主要得益於國產百萬兆級系統的部署和國家主導的半導體研發項目。中國的「神威海光」超級電腦及其後續系統,使氣候建模和航太設計不再依賴外國出口限制或西方晶片。印度耗資12億美元的「全國超級運算任務2.0」計畫到2027年將向大學校園部署總計25千兆次浮點運算/秒(petaflops)的運算能力,使生物技術和天氣預報新創企業能夠更便捷地獲取運算資源。日本基於ARM架構的「富嶽」超級電腦仍是能源效率標桿,並持續影響全球CPU藍圖。同時,韓國正透過將半導體製程模擬叢集與三星的研發中心對接,加速HBM封裝技術的發展。新加坡正將其國家超級運算中心打造成為東協醫藥和金融工作負載的樞紐,並計劃將其運算能力擴展至15千兆次浮點運算/秒(petaflops)。資料居住要求和網路主權法律迫使跨國公司在其各自國家內維護叢集,導致區域供應鏈分散但快速成長。
預計到2025年,歐洲將佔全球銷售額的22%。營業單位)正在百萬兆級運算(petaflops)的「LUMI」和義大利的304千兆次浮點運算(petaflops)的「Leonardo」等百億億次級系統,用於材料科學和氣候研究。德國的百萬兆級電腦「JUPITER」利用NVIDIA H100 GPU和Evendi的BullSequana機櫃,為大眾汽車的碰撞模擬和BASF的催化劑設計提供支援。 EURO-NCAP 2030的要求持續推動德國、法國和義大利對GPU叢集的結構性需求。同時,在北歐國家,豐富的水力資源和天然的冷卻環境正在加速私有雲端的建設。 GDPR(一般資料保護規則)的資料居住需求正在促進本地部署和混合環境的發展,尤其是在醫療保健和金融領域,因為這些領域高度敏感的記錄不能跨境傳輸。
南美洲、中東和非洲仍是發展中地區,但它們蘊藏著巨大的潛力。巴西石油公司(Petrobras)經營一個10千兆次浮點運算(10-petaflops)的系統用於海洋儲存建模;沙烏地阿拉伯的阿卜杜拉國王科技大學(KAUST)計劃在2024年新增一個15千兆次浮點運作的系統,用於可再生能源和海水淡化研究。阿拉伯聯合大公國已建成一個8千兆次浮點運算的叢集,用於訓練大規模阿拉伯語模型和建構智慧城市孿生體(虛擬城市)。以色列理工學院(Technion)已將其系統擴展至5千兆次浮點運算,用於網路安全分析;南非的CHPC則維護著一個4千兆次浮點運算的系統,用於採礦和流行病學研究。奈及利亞電力供應不穩定以及海灣國家嚴重缺水等基礎設施挑戰推高了部署成本,加速了節能、貨櫃式和模組化設計的發展。
其他好處:
- Excel格式的市場預測(ME)表
- 3個月的分析師支持
目錄
第1章:引言
- 研究假設和市場定義
- 調查範圍
第2章:調查方法
第3章執行摘要
第4章 市場狀況
- 市場概覽
- 市場促進因素
- 美國聯邦實驗室和一級雲端服務供應商的人工智慧和機器學習訓練工作負載呈現爆炸性成長。
- 亞洲製藥外包中心對GPU加速分子動力學的需求正在激增。
- 歐盟的 EURO-NCAP 2030藍圖強制要求汽車 ADAS 模擬。
- 舉措和印度的百萬兆級旨在促進國產處理器的採用。
- 數位孿生技術在電網級電池最佳化中的快速普及
- 量子啟發式退火加速器在投資組合最佳化的應用。
- 市場限制因素
- 加強對美國乾旱地區資料中心用水的限制。
- 超低延遲邊緣運算要求正在削弱集中式雲端的經濟可行性。
- 由於全球 HBM3e 記憶體供不應求,預計 2024 年至 2026 年 GPU 伺服器出貨量將受到限制。
- 網路主權法規限制跨境高效能運算即服務 (HPCaaS) 工作負載
- 產業價值鏈分析
- 監理展望
- 科技趨勢(晶片組、光連接模組)
- 宏觀經濟因素對市場的影響
- 波特五力分析
第5章 市場規模及成長預測(以金額為準)
- 按組件
- 硬體
- 伺服器
- 通用CPU伺服器
- GPU加速伺服器
- 基於 ARM 的伺服器
- 儲存系統
- 硬碟陣列
- 基於快閃記憶體的陣列
- 物件儲存
- 互連與網路
- InfiniBand
- 乙太網路(25/40/100/400 GbE)
- 定製或光連接模組
- 伺服器
- 軟體
- 系統軟體(作業系統、叢集管理)
- 中介軟體和 RAS 工具
- 平行檔案系統
- 服務
- 專業服務
- 託管式和高效能運算即服務 (HPCaaS)
- 硬體
- 部署模式
- 現場
- 雲
- 混合
- 按晶片類型(包括組件的橫截面圖)
- CPU
- GPU
- FPGA
- ASIC 或 AI 加速器
- 透過工業應用
- 政府/國防
- 學術和研究機構
- BFSI
- 製造與汽車工程
- 生命科學與醫療保健
- 能源、石油和天然氣
- 其他工業用途
- 按地區
- 北美洲
- 美國
- 加拿大
- 墨西哥
- 歐洲
- 德國
- 英國
- 法國
- 義大利
- 北歐國家(瑞典、挪威、芬蘭)
- 其他歐洲國家
- 亞太地區
- 中國
- 日本
- 印度
- 韓國
- 新加坡
- 其他亞太國家
- 南美洲
- 巴西
- 阿根廷
- 其他南美國家
- 中東
- 以色列
- 阿拉伯聯合大公國
- 沙烏地阿拉伯
- 土耳其
- 其他中東國家
- 非洲
- 南非
- 奈及利亞
- 其他非洲國家
- 北美洲
第6章 競爭情勢
- 市場集中度
- 策略趨勢
- 市佔率分析
- 公司簡介
- Advanced Micro Devices
- NEC Corporation
- Fujitsu Limited
- Qualcomm Incorporated
- Hewlett Packard Enterprise
- Dell Technologies
- Lenovo Group
- IBM Corporation
- Eviden(Atos SE)
- NVIDIA Corporation
- Intel Corporation
- Penguin Computing(SMART Global)
- Inspur Group
- Huawei Technologies
- Amazon Web Services
- Microsoft Azure
- Google Cloud Platform
- Oracle Cloud Infrastructure
- Alibaba Cloud
第7章 市場機會與未來展望
According to Mordor Intelligence, the high performance computing market size is projected to expand from USD 55.78 billion in 2025 and USD 60.12 billion in 2026 to USD 87.5 billion by 2031, registering a CAGR of 7.79% between 2026 to 2031.
This report is Segmented by Component (Hardware, Software, and Services), Deployment Mode (On-Premise, Cloud, and Hybrid), Industrial Application (Government and Defense, Academic and Research Institutions, BFSI, Manufacturing and Automotive Engineering, and More), Chip Type (CPU, GPU, FPGA, and ASIC / AI Accelerators) and Geography. The Market Forecasts are Provided in Terms of Value (USD).
Global High Performance Computing Market Trends and Insights
The Explosion of AI and ML Training Workloads in U.S. Federal Labs and Tier-1 Cloud Providers
Federal agencies now embed petaflop-scale infrastructure into operational AI pipelines rather than isolated research sandboxes. Oak Ridge National Laboratory's 1.2-exaflop Frontier trains foundation models that compress battery-chemistry discovery cycles from 18 months to 6 weeks, validating the transition from exploratory benchmarks to real-world deliverables. The National Science Foundation's 2025 Genesis Mission earmarks USD 800 million for distributed AI clusters across 20 universities, multiplying regional access to high performance computing market resources. Microsoft Azure's ND H100 v5 instances provide 3.2-terabit-per-second InfiniBand fabrics that let pharmaceutical firms build 100-billion-parameter transformers without cross-region sharding. The combined federal-private stimulus advances GPU refresh cycles, rendering legacy A100 nodes economically obsolete for trillion-parameter workloads and tightening demand for scarce HBM3e-based accelerators.
Surging Demand for GPU-Accelerated Molecular Dynamics in Asian Pharma Outsourcing Hubs
Contract research organizations in China and India deploy thousands of GPUs to compress small-molecule binding simulations from weeks to hours, leveling the playing field against Western pharmaceutical incumbents. WuXi AppTec's 5,000-GPU Shanghai cluster screens 10 million compounds per quarter at 40-times CPU throughput, delivering cost per GPU-hour roughly 60% lower than North American labs thanks to subsidized electricity and tax holidays. India's PARAM Rudra allocates one-third of its 2025 compute budget to Council of Scientific and Industrial Research laboratories, accelerating tuberculosis drug discovery by fusing AlphaFold-generated protein structures with GPU-driven docking engines. This geographic arbitrage shifts pharmaceutical preclinical pipelines eastward, reinforcing Asia Pacific's long-run share of the high performance computing market.
Escalating Datacenter Water-Usage Restrictions in Drought-Prone U.S. States
Water scarcity now dictates site selection. California's 20% industrial-use reduction order forced Tier-3 facilities to retrofit with dry cooling that raises power draw by 15%, adding USD 50 million per site in 2025 retrofit capital. Arizona halted new groundwater permits in Phoenix, compelling builders to incorporate closed-loop liquid cooling or cancel projects. Google postponed a 200-megawatt Nevada HPC site for lack of water rights, substituting a costlier air-cooled design. Capacity shifts north toward Oregon and Washington, but that realignment increases latency for California-based AI startups that previously enjoyed single-region round-trip times below 10 milliseconds.
Other drivers and restraints analyzed in the detailed report include:
- Mandatory Automotive ADAS Simulation Compliance in EU EURO-NCAP 2030 Roadmap
- National Exascale Initiatives Driving Indigenous Processor Adoption in China and India
- Global Shortage of HBM3e Memory Constraining GPU Server Shipments 2024-26
For complete list of drivers and restraints, kindly check the Table Of Contents.
Segment Analysis
Services recorded the fastest trajectory, expanding at a 9.42% CAGR from 2026 to 2031 as enterprises transition away from multimillion-dollar capital purchases toward pay-per-core-hour contracts. Hardware still accounted for 51.54% of 2025 revenue, but the high performance computing market size for services is projected to surpass USD 30 billion by 2031, closing the historical gap. Managed HPC and HPC-as-a-Service offerings allow aerospace and banking clients to spin up 100,000-core clusters for two-day burst windows instead of locking funds into five-year depreciation cycles, improving budget agility when demand is episodic. System-integration engagements now bundle application porting, code refactoring and performance tuning, particularly for legacy Fortran or C kernels that require GPU-optimized rewrites to exploit concurrency. Within hardware, however, GPU-accelerated nodes remain supply-constrained, and direct-to-chip liquid cooling becomes mandatory as 700-watt devices push rack densities beyond 120 kilowatts.
Professional-services vendors increasingly guarantee performance targets measured in wall-clock hours, not utilization percentages, aligning incentives with customer outcomes. Flash arrays dominate latency-sensitive workloads, while object repositories store exabyte-scale genomics archives. Interconnect sales migrate to 400-gigabit Ethernet for cost-conscious buyers and to InfiniBand NDR for top-end deployments that must train 100-billion-parameter models within 10 days. Software revenue, though smaller, underpins job-scheduling, data-orchestration and hybrid-burst automation, enabling policy-driven placement that factors cloud spot pricing and data-residency rules in the HPC market. Altogether these shifts re-rank vendor margin structures and tilt long-term value capture toward recurring services.
Cloud held 48.88% of 2025 revenue, but the high performance computing market size for hybrid deployments is projected to expand fastest, growing at an 8.22% CAGR through 2031 as security and cost considerations dictate a blended approach. Enterprises discover that sustained workloads exceeding 18 months achieve lower total cost of ownership on owned infrastructure, whereas seasonal or exploratory computations still favor cloud burst. Defense agencies and high-frequency traders, constrained by sub-millisecond latency and air-gapped security mandates, keep control planes on-premise yet outsource parameter sweeps to public clouds during off-hours. Schlumberger's 2025 migration to a Houston-plus-OCI model underscores the savings potential of hybrid, trimming USD 120 million from projected three-year capital spend.
Operational complexity rises with workload portability, egress fees at USD 0.12 per gigabyte make petabyte shuffling uneconomical, so firms prioritize compute-to-data ratios when selecting execution venues. Kubernetes-native schedulers such as IBM Spectrum LSF and HPE Slingshot automate placement, but compliance officers still vet cross-border data flows to meet GDPR and sector-specific mandates. Cloud providers counter by promising region-locked HPC zones with residency guarantees, but such offerings carry premium pricing. The hybrid surge ultimately reframes the high performance computing market for networking gear, storage gateways and observability stacks tuned for multi-site topologies.
Complete Report Scope:
- By Component
- Hardware
- Servers
- General-Purpose CPU Servers
- GPU-Accelerated Servers
- ARM-Based Servers
- Storage Systems
- HDD Arrays
- Flash-Based Arrays
- Object Storage
- Interconnect and Networking
- InfiniBand
- Ethernet (25/40/100/400 GbE)
- Custom or Optical Interconnects
- Servers
- Software
- System Software (OS, Cluster Management)
- Middleware and RAS Tools
- Parallel File Systems
- Services
- Professional Services
- Managed and HPC-as-a-Service (HPCaaS)
- Hardware
- By Deployment Mode
- On-premise
- Cloud
- Hybrid
- By Chip Type (Cross-Cut with Component)
- CPU
- GPU
- FPGA
- ASIC or AI Accelerators
- By Industrial Application
- Government and Defense
- Academic and Research Institutions
- BFSI
- Manufacturing and Automotive Engineering
- Life Sciences and Healthcare
- Energy, Oil and Gas
- Other Industry Applications
- By Geography
- North America
- United States
- Canada
- Mexico
- Europe
- Germany
- United Kingdom
- France
- Italy
- Nordics (Sweden, Norway, Finland)
- Rest of Europe
- Asia Pacific
- China
- Japan
- India
- South Korea
- Singapore
- Rest of Asia Pacific
- South America
- Brazil
- Argentina
- Rest of South America
- Middle East
- Israel
- United Arab Emirates
- Saudi Arabia
- Turkey
- Rest of Middle East
- Africa
- South Africa
- Nigeria
- Rest of Africa
- North America
Geography Analysis
North America accounted for 40.48% of 2025 revenue, anchored by USD 3.5 billion in U.S. federal exascale funding and hyperscale cloud operators that annually invest more than USD 200 billion in AI-optimized datacenters. The high performance computing market size in Canada rises as quantum-annealing vendor D-Wave ships 10,000-qubit systems for portfolio optimization, bridging classical-quantum workflows for financial institutions. Mexico's entrance remains modest, serving nearshored automotive crash simulation through a 5-petaflop General Motors cluster installed in Toluca. Geographically, water-usage curbs in California and datacenter moratoriums in Virginia divert new builds to Oregon, Washington and Texas, subtly re-mapping intra-region latency profiles that historically favored Silicon Valley.
Asia Pacific is projected to grow fastest at 7.98% CAGR, powered by indigenous exascale deployments and sovereign silicon programs. China's Sunway Oceanlight and follow-on systems circumvent foreign export regimes and enable climate modeling and aerospace design without dependency on Western chips. India's USD 1.2 billion National Supercomputing Mission 2.0 will install 25 petaflops across academic campuses by 2027, democratizing access for biotech and weather-forecast startups. Japan's ARM-based Fugaku remains the energy-efficiency benchmark, influencing global CPU roadmaps, while South Korea aligns semiconductor-process simulation clusters with Samsung R&D to accelerate HBM packaging. Singapore's 15-petaflop expansion positions its national supercomputing center as an ASEAN hub for pharmaceutical and finance workloads. Data residency and cyber-sovereignty laws force multinational enterprises to maintain in-country clusters, giving rise to a fragmented yet fast-growing regional supply chain.
Europe captured 22% of 2025 global revenue. The EuroHPC Joint Undertaking funds exascale-class systems such as Finland's 309-petaflop LUMI and Italy's 304-petaflop Leonardo for materials science and climate research. Germany's JUPITER exascale machine leverages NVIDIA H100 GPUs and eviden BullSequana cabinets to support Volkswagen crash simulations and BASF catalyst design. The EURO-NCAP 2030 mandate remains a structural demand driver for GPU clusters across Germany, France and Italy, while Nordic nations attract private cloud builds thanks to abundant hydroelectric power and free ambient cooling. GDPR-induced residency obligations sustain on-premise and hybrid growth, particularly in healthcare and finance where sensitive records cannot leave national borders.
South America, the Middle East and Africa remain nascent but opportunity-rich. Brazil's Petrobras operates 10 petaflops for offshore reservoir models, and Saudi Arabia's KAUST added 15 petaflops in 2024 for renewable-energy and desalination research. The United Arab Emirates commissioned an 8-petaflop cluster for Arabic large-language-model training and smart-city twins. Israel's Technion expanded to 5 petaflops for cybersecurity analytics, whereas South Africa's CHPC maintains 4 petaflops for mining and epidemiology. Infrastructure gaps such as intermittent power in Nigeria and severe water scarcity in Gulf states elevate deployment cost, encouraging containerized or modular designs optimized for energy efficiency.
- Advanced Micro Devices
- NEC Corporation
- Fujitsu Limited
- Qualcomm Incorporated
- Hewlett Packard Enterprise
- Dell Technologies
- Lenovo Group
- IBM Corporation
- Eviden (Atos SE)
- NVIDIA Corporation
- Intel Corporation
- Penguin Computing (SMART Global)
- Inspur Group
- Huawei Technologies
- Amazon Web Services
- Microsoft Azure
- Google Cloud Platform
- Oracle Cloud Infrastructure
- Alibaba Cloud
Additional Benefits:
- The market estimate (ME) sheet in Excel format
- 3 months of analyst support
TABLE OF CONTENTS
1 INTRODUCTION
- 1.1 Study Assumptions and Market Definition
- 1.2 Scope of the Study
2 RESEARCH METHODOLOGY
3 EXECUTIVE SUMMARY
4 MARKET LANDSCAPE
- 4.1 Market Overview
- 4.2 Market Drivers
- 4.2.1 The Explosion of AI and ML Training Workloads in U.S. Federal Labs and Tier-1 Cloud Providers
- 4.2.2 Surging Demand for GPU-Accelerated Molecular Dynamics in Asian Pharma Outsourcing Hubs
- 4.2.3 Mandatory Automotive ADAS Simulation Compliance in EU EURO-NCAP 2030 Roadmap
- 4.2.4 National Exascale Initiatives Driving Indigenous Processor Adoption in China and India
- 4.2.5 Rapid Adoption of Digital Twins for Grid-Scale Battery Storage Optimization
- 4.2.6 Emergence of Quantum-Inspired Annealing Accelerators for Portfolio Optimization
- 4.3 Market Restraints
- 4.3.1 Escalating Datacenter Water-Usage Restrictions in Drought-Prone U.S. States
- 4.3.2 Ultra-Low-Latency Edge Requirements Undermining Centralized Cloud Economics
- 4.3.3 Global Shortage of HBM3e Memory Constraining GPU Server Shipments 2024-26
- 4.3.4 Cyber-Sovereignty Regulations Limiting Cross-Border HPCaaS Workloads
- 4.4 Industry Value Chain Analysis
- 4.5 Regulatory Outlook
- 4.6 Technological Outlook (Chiplets, Optical Interconnects)
- 4.7 Impact of Macroeconomic Factors on the Market
- 4.8 Porter's Five Forces Analysis
- 4.8.1 Bargaining Power of Suppliers
- 4.8.2 Bargaining Power of Buyers
- 4.8.3 Threat of New Entrants
- 4.8.4 Threat of Substitutes
- 4.8.5 Intensity of Competitive Rivalry
5 MARKET SIZE AND GROWTH FORECASTS (VALUE )
- 5.1 By Component
- 5.1.1 Hardware
- 5.1.1.1 Servers
- 5.1.1.1.1 General-Purpose CPU Servers
- 5.1.1.1.2 GPU-Accelerated Servers
- 5.1.1.1.3 ARM-Based Servers
- 5.1.1.2 Storage Systems
- 5.1.1.2.1 HDD Arrays
- 5.1.1.2.2 Flash-Based Arrays
- 5.1.1.2.3 Object Storage
- 5.1.1.3 Interconnect and Networking
- 5.1.1.3.1 InfiniBand
- 5.1.1.3.2 Ethernet (25/40/100/400 GbE)
- 5.1.1.3.3 Custom or Optical Interconnects
- 5.1.1.1 Servers
- 5.1.2 Software
- 5.1.2.1 System Software (OS, Cluster Management)
- 5.1.2.2 Middleware and RAS Tools
- 5.1.2.3 Parallel File Systems
- 5.1.3 Services
- 5.1.3.1 Professional Services
- 5.1.3.2 Managed and HPC-as-a-Service (HPCaaS)
- 5.1.1 Hardware
- 5.2 By Deployment Mode
- 5.2.1 On-premise
- 5.2.2 Cloud
- 5.2.3 Hybrid
- 5.3 By Chip Type (Cross-Cut with Component)
- 5.3.1 CPU
- 5.3.2 GPU
- 5.3.3 FPGA
- 5.3.4 ASIC or AI Accelerators
- 5.4 By Industrial Application
- 5.4.1 Government and Defense
- 5.4.2 Academic and Research Institutions
- 5.4.3 BFSI
- 5.4.4 Manufacturing and Automotive Engineering
- 5.4.5 Life Sciences and Healthcare
- 5.4.6 Energy, Oil and Gas
- 5.4.7 Other Industry Applications
- 5.5 By Geography
- 5.5.1 North America
- 5.5.1.1 United States
- 5.5.1.2 Canada
- 5.5.1.3 Mexico
- 5.5.2 Europe
- 5.5.2.1 Germany
- 5.5.2.2 United Kingdom
- 5.5.2.3 France
- 5.5.2.4 Italy
- 5.5.2.5 Nordics (Sweden, Norway, Finland)
- 5.5.2.6 Rest of Europe
- 5.5.3 Asia Pacific
- 5.5.3.1 China
- 5.5.3.2 Japan
- 5.5.3.3 India
- 5.5.3.4 South Korea
- 5.5.3.5 Singapore
- 5.5.3.6 Rest of Asia Pacific
- 5.5.4 South America
- 5.5.4.1 Brazil
- 5.5.4.2 Argentina
- 5.5.4.3 Rest of South America
- 5.5.5 Middle East
- 5.5.5.1 Israel
- 5.5.5.2 United Arab Emirates
- 5.5.5.3 Saudi Arabia
- 5.5.5.4 Turkey
- 5.5.5.5 Rest of Middle East
- 5.5.6 Africa
- 5.5.6.1 South Africa
- 5.5.6.2 Nigeria
- 5.5.6.3 Rest of Africa
- 5.5.1 North America
6 COMPETITIVE LANDSCAPE
- 6.1 Market Concentration
- 6.2 Strategic Moves
- 6.3 Market Share Analysis
- 6.4 Company Profiles (includes Global level Overview, Market level overview, Core Segments, Financials as available, Strategic Information, Market Rank or Share for key companies, Products and Services, and Recent Developments)
- 6.4.1 Advanced Micro Devices
- 6.4.2 NEC Corporation
- 6.4.3 Fujitsu Limited
- 6.4.4 Qualcomm Incorporated
- 6.4.5 Hewlett Packard Enterprise
- 6.4.6 Dell Technologies
- 6.4.7 Lenovo Group
- 6.4.8 IBM Corporation
- 6.4.9 Eviden (Atos SE)
- 6.4.10 NVIDIA Corporation
- 6.4.11 Intel Corporation
- 6.4.12 Penguin Computing (SMART Global)
- 6.4.13 Inspur Group
- 6.4.14 Huawei Technologies
- 6.4.15 Amazon Web Services
- 6.4.16 Microsoft Azure
- 6.4.17 Google Cloud Platform
- 6.4.18 Oracle Cloud Infrastructure
- 6.4.19 Alibaba Cloud
7 MARKET OPPORTUNITIES AND FUTURE OUTLOOK
- 7.1 White-space and Unmet-need Assessment

 2026年全球高效能運算平台(人工智慧應用)市場報告
 全球資料中心運算與人工智慧市場(2027-2040 年)
 資料處理單元市場報告:趨勢、預測與競爭分析(至2035年)
 高效能運算市場機會、成長要素、產業趨勢分析及2026-2035年預測。
 混合量子與經典計算軟體:市場佔有率分析、產業趨勢與統計及成長預測(2026-2031)
 高效能運算市場:按組件、技術、資料類型、最終用戶、部署模式和組織規模分類-2026-2032年全球市場預測加速計算:市場佔有率分析、行業趨勢和統計數據、成長預測(2026-2031 年)異質計算:市場佔有率分析、產業趨勢與統計、成長預測(2026-2031)雲端運算高效能運算(HPC):市場佔有率分析、產業趨勢與統計及成長預測(2026-2031 年)高效能運算 (HPC) 市場規模、佔有率、成長率和全球產業分析:按類型、應用和地區分類的洞察,2026-2034 年預測