


 |
市場調查報告書
商品編碼
2038642
豌豆蛋白市場機會、成長要素、產業趨勢分析及2026-2035年預測Pea Protein Market Opportunity, Growth Drivers, Industry Trend Analysis, and Forecast 2026 - 2035 |
||||||

預計到 2025 年,全球豌豆蛋白市值將達到 7.311 億美元,年複合成長率為 8.5%,到 2035 年將達到 17 億美元。
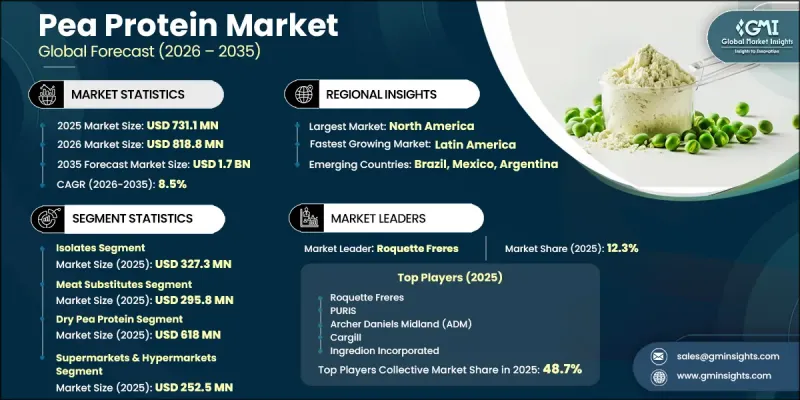
隨著消費者日益轉向植物來源營養和永續食品配料,豌豆蛋白市場呈現強勁成長動能。豌豆蛋白採用先進加工技術從黃豌豆中提取,具有高消化率和均衡的氨基酸組成,能夠滿足不同的飲食偏好。其生產過程不會降低營養價值,製造商可以開發出多種形式的豌豆蛋白,例如分離蛋白、濃縮蛋白和組織化產品。豌豆蛋白風味中性且功能多樣,使其能夠很好地應用於各種食品和飲料配方中。消費者對潔淨標示產品和環保採購的日益關注,並持續推動豌豆蛋白在業界的普及。食品製造商正在將豌豆蛋白添加到各種產品中,以改善產品的質地、穩定性和營養價值,同時滿足不斷變化的消費者需求。此外,由於豌豆蛋白不含常見過敏原,消費者對無過敏原配料的需求不斷成長,也促進了豌豆蛋白的廣泛應用。持續的產品創新和採用最少加工製程生產的蛋白質解決方案的開發,進一步塑造了市場競爭格局,並推動著市場的永續成長。
| 市場範圍 | |
|---|---|
| 開始年份 | 2025 |
| 預測期 | 2026-2035 |
| 上市時的市場規模 | 7.311億美元 |
| 預計金額 | 17億美元 |
| 複合年成長率 | 8.5% |
預計2025年,隔離群蛋白市場規模將達到3.273億美元,鞏固主導地位。市場對高蛋白、高溶解性和高功能性的植物來源原料的強勁需求,是推動該市場成長的主要動力。配方品質的持續提升,包括口感和分散性的改善,也促進了其在各類產品應用中的廣泛應用。
預計到2025年,肉品替代品市場規模將達到2.958億美元,凸顯其在推動整體市場需求的重要角色。豌豆蛋白因其能夠賦予產品理想的結構和質地,在替代蛋白配方中的應用日益廣泛。消費者對易消化、純淨蛋白來源的日益成長的需求,也推動了功能性營養品類的整體成長。
預計北美豌豆蛋白市場規模將從2025年的2.324億美元成長到2035年的5.316億美元。在該地區,隨著消費者越來越關注食品選擇和產品透明度,對植物來源原料的需求正在不斷成長。食品製造商正積極拓展產品系列,以順應潔淨標示趨勢和不斷變化的消費者習慣。
目錄
第1章:調查方法和範圍
第2章執行摘要
第3章業界考察
- 生態系分析
- 供應商情況
- 利潤率
- 每個階段增加的價值
- 影響價值鏈的因素
- 中斷
- 影響產業的因素
- 促進因素
- 健康意識的提高和對膳食纖維的需求增加
- 消化器官系統和心血管疾病盛行率增加
- 在功能性食品和飲料領域不斷擴大應用
- 陷阱與挑戰
- 由於受農業和氣候的影響,價格往往波動較大。
- 過敏反應與職業健康問題
- 機會
- 化妝品和個人護理行業的新興應用
- 對有機認證車前子產品的需求不斷成長
- 促進因素
- 成長潛力分析
- 監理情勢
- 波特五力分析
- PESTEL 分析
- 科技與創新趨勢
- 當前技術趨勢
- 新興技術
- 價格趨勢
- 按地區
- 依產品
- 未來市場趨勢
- 科技與創新趨勢
- 當前技術趨勢
- 新興技術
- 專利趨勢
- 貿易統計(HS編碼)
- 主要進口國
- 主要出口國
- 永續性和環境方面
- 永續計劃
- 減少廢棄物策略
- 生產中的能源效率
- 環保意識的舉措
- 考慮碳足跡
第4章 競爭情勢
- 介紹
- 企業市佔率分析
- 按地區
- 北美洲
- 歐洲
- 亞太地區
- 拉丁美洲
- 中東和非洲(MEA)
- 按地區
- 企業矩陣分析
- 主要市場公司的競爭分析
- 競爭定位矩陣
- 主要進展
- 併購
- 夥伴關係和聯盟
- 新產品發布
- 業務拓展計劃
第5章 市場估價與預測:依產品分類,2022-2035年
- 隔離群
- 集中
- 紋理
第6章 市場估計與預測:依應用領域分類,2022-2035年
- 肉類替代品
- 營養保健品
- 運動補劑
- 其他
第7章 市場估計與預測:依類型分類,2022-2035年
- 乾豌豆蛋白
- 液態豌豆蛋白
第8章 市場估算與預測:依通路分類,2022-2035年
- 超級市場和大賣場
- 線上/電子商務
- 藥局/藥局
- 其他
第9章 市場估計與預測:依地區分類,2022-2035年
- 北美洲
- 美國
- 加拿大
- 歐洲
- 德國
- 英國
- 法國
- 西班牙
- 義大利
- 其他歐洲地區
- 亞太地區
- 中國
- 印度
- 日本
- 澳洲
- 韓國
- 亞太其他地區
- 拉丁美洲
- 巴西
- 墨西哥
- 阿根廷
- 其他拉丁美洲地區
- 中東和非洲
- 沙烏地阿拉伯
- 南非
- 阿拉伯聯合大公國
- 其他中東和非洲地區
第10章:公司簡介
- A&B Ingredients
- Burcon Nutrascience Corporation
- Roquette Freres
- Farbest Tallman Foods Corporation
- Kerry Group
- The Scoular Company
- Sotexpro
- Archer Daniels Midland(ADM)
- Cargill
- Glanbia Plc
- Ingredion Incorporated
- AGT Food and Ingredients
- Axiom Foods
- PURIS
- Emsland Group
The Global Pea Protein Market was valued at USD 731.1 million in 2025 and is estimated to grow at a CAGR of 8.5% to reach USD 1.7 billion by 2035.
The market is gaining strong momentum as consumers increasingly shift toward plant-based nutrition and sustainable food ingredients. Pea protein, extracted from yellow peas through advanced processing techniques, delivers a well-balanced amino acid profile with high digestibility, making it suitable for diverse dietary preferences. The production process preserves nutritional integrity while enabling manufacturers to develop ingredients in multiple formats, including isolates, concentrates, and textured variants. Its neutral flavor and functional versatility make it highly adaptable across a wide range of food and beverage formulations. Growing awareness of clean-label products and environmentally responsible sourcing continues to accelerate adoption across industries. Food manufacturers are incorporating pea protein into various formulations to enhance texture, stability, and nutritional content while meeting evolving consumer expectations. Additionally, increasing demand for allergen-friendly ingredients is supporting widespread acceptance, as pea protein remains free from common allergens. Continuous product innovation and development of minimally processed protein solutions are further shaping the competitive landscape and driving sustained market growth.
| Market Scope | |
|---|---|
| Start Year | 2025 |
| Forecast Year | 2026-2035 |
| Start Value | $731.1 Million |
| Forecast Value | $1.7 Billion |
| CAGR | 8.5% |
The isolates segment accounted for USD 327.3 million in 2025, reflecting its leading position within the market. Strong demand for high-protein, plant-based ingredients with improved solubility and functional performance is contributing to segment expansion. Ongoing improvements in formulation quality, including enhanced taste and dispersibility, are supporting broader usage across multiple product applications.
The meat substitutes segment generated USD 295.8 million in 2025, highlighting its strong role in driving overall market demand. Pea protein is increasingly used in alternative protein formulations due to its ability to deliver desirable structure and consistency. Rising consumer interest in digestible, clean protein sources is also supporting growth across functional nutrition categories.
North America Pea Protein Market is expected to grow from USD 232.4 million in 2025 to USD 531.6 million by 2035. The region is witnessing increasing demand for plant-based ingredients as consumers become more conscious of dietary choices and product transparency. Food manufacturers are actively expanding product portfolios to align with clean-label trends and evolving consumption patterns.
Key companies operating in the Global Pea Protein Industry include Cargill, Axiom Foods, Kerry Group, Roquette Freres, Ingredion Incorporated, The Scoular Company, Burcon Nutrascience Corporation, A&B Ingredients, Emsland Group, Glanbia Plc, AGT Food and Ingredients, Archer Daniels Midland (ADM), Farbest Tallman Foods Corporation, Sotexpro, and PURIS. Companies in the Pea Protein Market are strengthening their market position through innovation, strategic partnerships, and global expansion initiatives. Many players are investing in advanced processing technologies to improve protein quality, functionality, and taste while reducing production costs. Collaborations with food and beverage manufacturers are enabling customized ingredient solutions tailored to specific applications. Firms are also focusing on expanding production capacity to meet rising global demand and ensure supply chain efficiency. Product diversification, including the development of clean-label and minimally processed offerings, is becoming a key competitive strategy. Additionally, companies are targeting emerging markets and enhancing distribution networks to increase their global footprint and capture new growth opportunities.
Table of Contents
Chapter 1 Methodology & Scope
- 1.1 Market scope and definition
- 1.2 Research design
- 1.2.1 Research approach
- 1.2.2 Data collection methods
- 1.3 Data mining sources
- 1.3.1 Global
- 1.3.2 Regional/Country
- 1.4 Base estimates and calculations
- 1.4.1 Base year calculation
- 1.4.2 Key trends for market estimation
- 1.5 Primary research and validation
- 1.5.1 Primary sources
- 1.6 Forecast model
- 1.7 Research assumptions and limitations
Chapter 2 Executive Summary
- 2.1 Industry 360° synopsis
- 2.2 Key market trends
- 2.2.1 Product
- 2.2.2 Application
- 2.2.3 Form
- 2.2.4 Distribution Channel
- 2.2.5 Regional
- 2.3 TAM Analysis, 2026-2035
- 2.4 CXO perspectives: Strategic imperatives
- 2.5 Future outlook and strategic recommendations
Chapter 3 Industry Insights
- 3.1 Industry ecosystem analysis
- 3.1.1 Supplier landscape
- 3.1.2 Profit margin
- 3.1.3 Value addition at each stage
- 3.1.4 Factor affecting the value chain
- 3.1.5 Disruptions
- 3.2 Industry impact forces
- 3.2.1 Growth drivers
- 3.2.1.1 Rising health consciousness & demand for dietary fiber
- 3.2.1.2 Growing prevalence of digestive & cardiovascular disorders
- 3.2.1.3 Increasing adoption in functional food & beverage application
- 3.2.2 Pitfalls/challenge
- 3.2.2.1 High price volatility due to agricultural & climatic dependence
- 3.2.2.2 Allergic reactions & occupational health concerns
- 3.2.3 Opportunities
- 3.2.3.1 Emerging applications in cosmetic & personal care industry
- 3.2.3.2 Growing demand for organic & certified psyllium products
- 3.2.1 Growth drivers
- 3.3 Growth potential analysis
- 3.4 Regulatory landscape
- 3.4.1 North America
- 3.4.2 Europe
- 3.4.3 Asia Pacific
- 3.4.4 Latin America
- 3.4.5 Middle East & Africa
- 3.5 Porter's analysis
- 3.6 PESTEL analysis
- 3.7 Technology and innovation landscape
- 3.7.1 Current technological trends
- 3.7.2 Emerging technologies
- 3.8 Price trends
- 3.8.1 By region
- 3.8.2 By product
- 3.9 Future market trends
- 3.10 Technology and innovation landscape
- 3.10.1 Current technological trends
- 3.10.2 Emerging technologies
- 3.11 Patent landscape
- 3.12 Trade statistics (HS code)
- 3.12.1 Major importing countries
- 3.12.2 Major exporting countries
- 3.13 Sustainability and environmental aspects
- 3.13.1 Sustainable practices
- 3.13.2 Waste reduction strategies
- 3.13.3 Energy efficiency in production
- 3.13.4 Eco-friendly initiatives
- 3.14 Carbon footprint consideration
Chapter 4 Competitive Landscape, 2025
- 4.1 Introduction
- 4.2 Company market share analysis
- 4.2.1 By region
- 4.2.1.1 North America
- 4.2.1.2 Europe
- 4.2.1.3 Asia Pacific
- 4.2.1.4 LATAM
- 4.2.1.5 MEA
- 4.2.1 By region
- 4.3 Company matrix analysis
- 4.4 Competitive analysis of major market players
- 4.5 Competitive positioning matrix
- 4.6 Key developments
- 4.6.1 Mergers & acquisitions
- 4.6.2 Partnerships & collaborations
- 4.6.3 New product launches
- 4.6.4 Expansion plans
Chapter 5 Market Estimates and Forecast, By Product, 2022-2035 (USD Million) (Kilo Tons)
- 5.1 Key trends
- 5.2 Isolates
- 5.3 Concentrates
- 5.4 Textured
Chapter 6 Market Estimates and Forecast, By Application, 2022-2035 (USD Million) (Kilo Tons)
- 6.1 Key trends
- 6.2 Meat substitutes
- 6.3 Nutraceuticals
- 6.4 Sport supplements
- 6.5 Others
Chapter 7 Market Estimates and Forecast, By Form, 2022-2035 (USD Million) (Kilo Tons)
- 7.1 Key trends
- 7.2 Dry pea protein
- 7.3 Liquid pea protein
Chapter 8 Market Estimates and Forecast, By Distribution Channel, 2022-2035 (USD Million) (Kilo Tons)
- 8.1 Key trends
- 8.2 Supermarkets & hypermarkets
- 8.3 Online/E-commerce
- 8.4 Pharmacies & drugstores
- 8.5 Others
Chapter 9 Market Estimates and Forecast, By Region, 2022-2035 (USD Million) (Kilo Tons)
- 9.1 Key trends
- 9.2 North America
- 9.2.1 U.S.
- 9.2.2 Canada
- 9.3 Europe
- 9.3.1 Germany
- 9.3.2 UK
- 9.3.3 France
- 9.3.4 Spain
- 9.3.5 Italy
- 9.3.6 Rest of Europe
- 9.4 Asia Pacific
- 9.4.1 China
- 9.4.2 India
- 9.4.3 Japan
- 9.4.4 Australia
- 9.4.5 South Korea
- 9.4.6 Rest of Asia Pacific
- 9.5 Latin America
- 9.5.1 Brazil
- 9.5.2 Mexico
- 9.5.3 Argentina
- 9.5.4 Rest of Latin America
- 9.6 Middle East and Africa
- 9.6.1 Saudi Arabia
- 9.6.2 South Africa
- 9.6.3 UAE
- 9.6.4 Rest of Middle East and Africa
Chapter 10 Company Profiles
- 10.1 A&B Ingredients
- 10.2 Burcon Nutrascience Corporation
- 10.3 Roquette Freres
- 10.4 Farbest Tallman Foods Corporation
- 10.5 Kerry Group
- 10.6 The Scoular Company
- 10.7 Sotexpro
- 10.8 Archer Daniels Midland (ADM)
- 10.9 Cargill
- 10.10 Glanbia Plc
- 10.11 Ingredion Incorporated
- 10.12 AGT Food and Ingredients
- 10.13 Axiom Foods
- 10.14 PURIS
- 10.15 Emsland Group

 全球豌豆蛋白市場(至 2031 年):按類型(分離豌豆蛋白、濃縮豌豆蛋白和組織化豌豆蛋白)、應用(食品、飲料及其他)、特性(傳統和有機)、加工方法(乾法和濕法)和地區分類。
 豌豆蛋白市場:按類型、應用和地區分類
 豌豆蛋白原料市場規模、佔有率及成長分析:依產品類型、原料來源、應用及地區分類-2026-2033年產業預測
 全球豌豆蛋白市場規模、佔有率、趨勢和成長分析報告(2026-2034年)
 黃豌豆蛋白市場規模、佔有率、成長分析(按產品類型、形態、應用、最終用戶和地區分類)-2026-2033年產業預測
 全球豌豆蛋白配料市場:依類型、來源、形態、應用和地區劃分-市場規模、產業趨勢、機會分析和預測(2025-2033 年)
 豌豆蛋白:全球市佔率及排名、總收入及需求預測(2025-2031年)
 豌豆蛋白市場-全球產業規模、佔有率、趨勢、機會和預測,按類型、形式、應用、地區和競爭細分,2020-2030 年
 豌豆蛋白質市場:產業趨勢·全球預測 (~2035年):產品類型·形態·原料·加工法·用途·終端用戶·流通·企業規模·各主要地區豌豆蛋白市場:未來預測(2025-2030)