


 |
市場調查報告書
商品編碼
2157060
亞太地區災害復原服務:市場佔有率分析、產業趨勢與統計及成長預測(2026-2031 年)Asia-Pacific Disaster Restoration Services - Market Share Analysis, Industry Trends & Statistics, Growth Forecasts (2026 - 2031) |
||||||

※ 本網頁內容可能與最新版本有所差異。詳細情況請與我們聯繫。
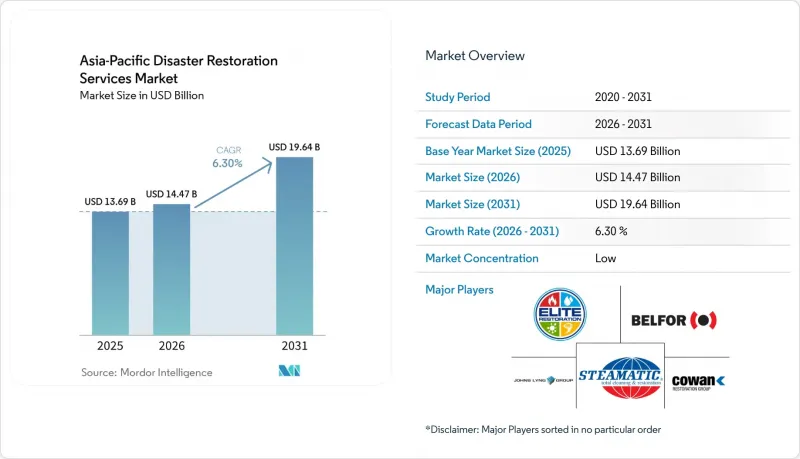
據 Mordor Intelligence 稱,亞太地區災害復原服務市場在 2025 年的價值為 136.9 億美元,預計到 2031 年將達到 196.4 億美元,而 2026 年為 144.7 億美元,預測期(2026-2031 年)的複合年成長率為 6.30%。
亞太地區災害復原服務市場趨勢及洞察。
洪水、颱風、地震和野火造成的損失風險增加。
2025年,亞洲各地洪災造成的經濟損失高達310億美元,佔該地區天災損失的一半以上。這一損失趨勢使得亞太地區災害復原服務市場對排水、除濕、清理和重組工作的需求持續強勁。 2025年11月下旬至12月初,一連串熱帶氣旋襲擊了泰國、印尼和馬來西亞。這些風暴持續了5至15天,導致土壤飽和,防洪設施癱瘓,並造成至少110億美元的損失。 2025年3月緬甸地震又帶來了新的災後重建需求,包括結構修復和跨境動員。此外,澳洲的阿爾弗雷德氣旋、5月份的洪水以及年底的冰雹災害也考驗了災後重建承包商在2025年的應變能力。
提高保險普及率,並將產物保險理賠處理外包。
儘管全部區域的保險普及率仍然不均衡,但隨著越來越多的業主開始使用正規的保險管道,保險覆蓋的洪水損失金額有所增加。然而,該地區各地區保障水準的差異依然顯著,導致政府和家庭承擔了大部分災害損失。因此,亞太地區的災害復原服務市場既包括保險公司主導的運營,也包括自籌資金或公共資金支持的重建活動。在澳洲和日本,保險公司合作協議促進了經認證且擁有完善報告流程的服務提供者的使用。 Johns Ring Group報告稱,已與蘇黎世保險、美國國際集團(AIG)、Adacare和TIO簽署了2025會計年度新的多年期協議,並延長了與Suncorp、Hollard、安聯保險、Auto & General和Market Lane Group的協議。 2026年5月,東協與中日韓(10+3)舉措批准了《2026-2028年災害風險融資計劃藍圖》,從而加強了全部區域災害風險融資框架。
亞太地區新興市場保險覆蓋率不平衡和自付費用高。
2025年全年,新興市場和開發中國家的產物保險普及率仍遠低於經合組織平均水準。因此,許多受災業主被迫自行承擔修復費用,延誤修復工作,縮小維修範圍,或依賴非正規勞動力。儘管財產損失風險巨大,但這一趨勢抑制了亞太地區災害復原服務市場的正規需求。根據亞太地區災害風險評估辦公室(AMRO)的數據顯示,2016年至2025年間,亞洲的保障缺口高達88%。雖然政府資金通常可以彌補部分缺口,但標準化的修復工作並非總是能落實。儘管未來微額保險、參數型保險產品和公共風險池的普及應用可能會改善保障取得途徑,但這些機制在低收入和中等收入國家尚未廣泛應用。
細分市場分析
2025年,洪水災後重建服務佔亞太地區災害復原服務市場規模的38.0%。此類別包括乾燥、除濕和污水回流修復。季風和颱風引發的反覆性洪水使洪水災後重建服務在全部區域保持領先地位。 2025年,洪水造成的損失佔亞洲自然災害損失的一半以上,與水相關的災後重建工作在服務組成中繼續佔據核心地位。熱帶地區的高濕度使得及時監測濕度分佈和進行乾燥對於建築結構和隱藏式機械設備特別重要。具備使用乾燥劑和冷媒進行乾燥以及微生物風險管理能力的供應商在承接保險資助項目方面具有優勢。菲律賓、日本和澳洲遭受風災、冰雹災和洪水災害後,風暴和重大災害復原計畫也隨之擴展。
「其他」類別預計在2026年至2031年間以7.2%的複合年成長率成長,成為成長最快的服務類別。此類別包括家居用品回收、包裝和物流、清潔和倉儲。電子產品、家具和商用設備價值的提升,使得人們更傾向於回收而非更換這些物品。專業服務包括電子產品和資料恢復、無塵室消毒以及基礎設施級恢復。這些服務對於半導體和物流行業的客戶日益重要,因為他們通常會使用優選供應商協議。火災和煙熏損害恢復服務在澳洲仍然至關重要,因為澳洲面臨叢林火災的風險;在人口稠密的城市,電力故障可能會影響多層樓。生物危害和創傷現場清理目前仍佔收入的小規模部分,但仍作為區域服務的一部分。 IICRC S500和S520標準規定了成熟保險計劃中洪水和黴菌清除工作的合格。
其他好處:
- Excel格式的市場預測(ME)表
- 3個月的分析師支持
目錄
第1章:引言
- 研究假設和市場定義
- 調查範圍
第2章:調查方法
第3章執行摘要
第4章 市場狀況
- 市場概覽
- 按災害類型和財產類型分類的需求
- 維修服務的配置
- 客戶和需求結構
- 市場結構與競爭格局
- 保險業參與
- 區域趨勢
- 反應能力和動員系統
- 市場促進因素
- 洪水、颱風、地震和野火造成的損失風險增加。
- 提高保險普及率,並將產物保險理賠處理外包。
- 都市區房地產密度高,家庭用品和設備的更換成本較高。
- 政府和企業對韌性基礎設施和業務永續營運連續性的投資
- 保險公司要求提供有據可查、經認證且快速有效的損害緩解措施。
- 熱帶地區建築物潮濕造成的二次損害及隱蔽潮濕的檢測。
- 市場限制因素
- 亞太地區新興市場保險覆蓋範圍不均衡以及自付費用高昂,造成了重大障礙。
- 大城市以外地區合格技術人員短缺,缺乏能造成重大損害的設備。
- 保險理賠程序不統一、區域許可證制度不同、維修標準不一致。
- 洪水損壞的電子設備、資料中心和工業資產的恢復期有限制。
- 價值和供應鏈分析
- 維修服務的價值鏈
- 設備、化學品和耗材的供應鏈
- 勞動力和專業服務保障狀況
- 索賠和品管工作流程
- 監理情勢
- 有關建築、環境和安全的法規
- 有關危險物質、環境和健康的法規
- 保險和消費者保護相關法規
- 災害管理與公共採購框架
- 技術展望
- 數位化檢測和遠端監控
- 人工智慧、物聯網和保險索賠自動化
- 無人機和遠端損害評估
- 先進的修復技術
- 機器人與自動化
第5章 市場規模與成長預測
- 按服務類型
- 洪水災害復原(乾燥、除濕、污水回流預防)
- 火災和煙熏損害恢復
- 黴菌清除
- 風暴/大規模災害復原(風災、冰雹災害、洪水應變、大規模災害)
- 生物危害與創傷現場清理(犯罪現場、自然死亡現場、感染疾病相關清理)
- 專業服務
- 其他服務(家居用品修復、包裝、清潔、倉儲等)
- 透過使用
- 住宅
- 商業和工業用途
- 依客戶/付款人類型
- 保險涵蓋的維修工作
- 自籌/直接支付的維修工作
- 公共部門/政府資助的修復工作
- 按地區
- 中國
- 印度
- 日本
- 澳洲
- 印尼
- 菲律賓
- 泰國
- 越南
- 馬來西亞
- 孟加拉
- 其他亞太國家
第6章 競爭情勢
- 市場集中度
- 策略趨勢
- 市佔率分析
- 公司簡介
- BELFOR Holdings, Inc.
- Johns Lyng Group Limited
- Steamatic Australia
- Cowan Restoration Group
- Elite Restoration
- MSA Property Care and Restorations
- Flood Services Australia
- AllAces
- Biodec Restoration Specialists
- Water Damage Specialist
- Reztor Restoration
- Big Red Pte Ltd
- Approved Group International
- Bright Symphony Sdn Bhd
- RecoveryPRO
- SPREAD CO Limited
- ServiceMaster Restore
- Polygon group
- SERVPRO Industries LLC
第7章 市場機會與未來展望
According to Mordor Intelligence, the Asia-Pacific disaster restoration services market size was valued at USD 13.69 billion in 2025 and is estimated to grow from USD 14.47 billion in 2026 to reach USD 19.64 billion by 2031, at a CAGR of 6.30% during the forecast period (2026-2031).
Asia-Pacific Disaster Restoration Services Market Trends and Insights
Rising Flood, Typhoon, Earthquake, and Bushfire Loss Exposure
Flooding generated USD 31 billion in economic losses across Asia during 2025 and represented more than half of the region's natural catastrophe losses. This loss pattern kept water removal, dehumidification, cleaning, and rebuilding work in steady demand across the Asia-Pacific disaster restoration services market. A sequence of tropical systems affected Thailand, Indonesia, and Malaysia from late November to early December 2025. The events occurred within 5-15 days, saturated soil, overwhelmed flood defenses, and generated at least USD 11 billion in losses. The March 2025 Myanmar earthquake added a different form of recovery demand, including structural remediation and cross-border mobilization. Australia's Cyclone Alfred, May flooding, and late-year hail events also tested restoration panel capacity during 2025.
Increasing Insurance Penetration and Property-Insurance Claims Outsourcing
Insurance penetration remained uneven across Asia-Pacific, yet insured flood losses increased as more property owners entered formal coverage channels. The regional protection gap remained significant, which left governments and households responsible for a large share of disaster costs. The Asia-Pacific disaster restoration services market, therefore, includes both insurer-directed work and self-funded or public recovery activity. In Australia and Japan, insurer-panel systems have supported the use of certified providers with established reporting processes. Johns Lyng Group reported new multiyear contracts with Zurich, AIG, Aidacare, and TIO in FY2025, together with extensions involving Suncorp, Hollard, Allianz, Auto & General, and Market Lane Group. ASEAN+3 finance ministers endorsed the Disaster Risk Financing Initiative's 2026-28 roadmap in May 2026, supporting stronger disaster-risk financing structures across the region.
Uneven Insurance Coverage and High Self-Pay Friction in Emerging Asia-Pacific Markets
Non-life insurance penetration in emerging and developing Asia-Pacific remained well below the average level across OECD countries during 2025. Many disaster-affected property owners therefore paid for recovery directly, delayed work, reduced the scope of repairs, or relied on informal labor. This pattern constrained formal demand in the Asia-Pacific disaster restoration services market despite substantial physical damage exposure. AMRO reported an 88% protection gap for Asia over the 2016-2025 period. Government funding often filled part of this gap, but it did not always create standardized restoration assignments. Wider use of microinsurance, parametric products, and public risk pools could improve access over time, although these mechanisms have not reached a broad operating scale in lower-middle-income economies.
Other drivers and restraints analyzed in the detailed report include:
- Urban Property Density and Higher Replacement Value of Contents and Equipment
- Government and Corporate Investment in Resilient Infrastructure and Business Continuity
- Shortage of Certified Technicians and Catastrophe-Scale Equipment Outside Major Cities
For complete list of drivers and restraints, kindly check the Table Of Contents.
Segment Analysis
Water damage restoration held 38.0% of the Asia-Pacific disaster restoration services market size in 2025. The category included drying, dehumidification, and sewage backup remediation. Recurrent monsoons and typhoon flooding supported its leading position across the region. Floods accounted for more than half of Asia's natural catastrophe losses in 2025, keeping water-related recovery work central to the service mix. Tropical humidity made timely moisture mapping and drying especially important for building assemblies and concealed mechanical systems. Providers with desiccant or refrigerant drying capability and microbial risk controls were better placed to manage insurer-funded assignments. Storm and catastrophe restoration also expanded as wind, hail, and flood events affected the Philippines, Japan, and Australia.
The others category is forecast to grow at a 7.2% CAGR during 2026-2031, making it the fastest-growing service type. It included contents restoration, pack-out logistics, cleaning, and storage. Higher values for electronics, furnishings, and business equipment increased the need to recover content rather than replace them. Specialty services included electronics and data recovery, cleanroom decontamination, and infrastructure-grade restoration. These services gained importance among semiconductor and logistics clients who used preferred vendor arrangements. Fire and smoke restoration remained relevant in Australia because of bushfire exposure and in dense cities where electrical faults can affect multiple floors. Biohazard and trauma cleanup remained smaller by revenue but continued to form part of the regional service offering. IICRC S500 and S520 standards shaped eligibility for water damage and mold remediation work in mature insurance systems.
Complete Report Scope:
- By Service Type
- Water Damage Restoration (drying/dehumidification, sewage backup)
- Fire & Smoke Damage Restoration
- Mold Remediation
- Storm / Catastrophe Restoration (wind, hail, flood response, large-loss)
- Biohazard & Trauma Cleanup (crime scene, unattended death, infectious cleanup)
- Specialty Services
- Others (contents restoration, pack-out, cleaning, storage, etc.)
- By Application
- Residential
- Commercial & Industrial
- By Customer/Payor Type
- Insurance-funded Restoration Work
- Self-funded / Direct-pay Restoration Work
- Public-sector / Government-funded Restoration Work
- By Geography
- China
- India
- Japan
- Australia
- Indonesia
- Philippines
- Thailand
- Vietnam
- Malaysia
- Bangladesh
- Rest of Asia-Pacific
List of Companies Covered in this Report:
- BELFOR Holdings, Inc.
- Johns Lyng Group Limited
- Steamatic Australia
- Cowan Restoration Group
- Elite Restoration
- MSA Property Care and Restorations
- Flood Services Australia
- AllAces
- Biodec Restoration Specialists
- Water Damage Specialist
- Reztor Restoration
- Big Red Pte Ltd
- Approved Group International
- Bright Symphony Sdn Bhd
- RecoveryPRO
- SPREAD CO Limited
- ServiceMaster Restore
- Polygon group
- SERVPRO Industries LLC
Additional Benefits:
- The market estimate (ME) sheet in Excel format
- 3 months of analyst support
TABLE OF CONTENTS
1 INTRODUCTION
- 1.1 Study Assumptions and Market Definition
- 1.2 Scope of the Study
2 RESEARCH METHODOLOGY
3 EXECUTIVE SUMMARY
4 MARKET LANDSCAPE
- 4.1 Market Overview
- 4.1.1 Demand by Disaster Event and Property Type
- 4.1.2 Restoration Service Mix
- 4.1.3 Customer and Demand Structure
- 4.1.4 Market Structure and Competitive Landscape
- 4.1.5 Insurance Involvement
- 4.1.6 Regional Dynamics
- 4.1.7 Response Capacity and Mobilization
- 4.2 Market Drivers
- 4.2.1 Rising Flood, Typhoon, Earthquake, and Bushfire Loss Exposure
- 4.2.2 Increasing Insurance Penetration and Property-Insurance Claims Outsourcing
- 4.2.3 Urban Property Density and Higher Replacement Value of Contents and Equipment
- 4.2.4 Government and Corporate Investment in Resilient Infrastructure and Business Continuity
- 4.2.5 Insurer Demand for Documented, Certified and Rapid Loss Mitigation
- 4.2.6 Humidity-Driven Secondary Damage and Hidden-Moisture Detection in Tropical Buildings
- 4.3 Market Restraints
- 4.3.1 Uneven Insurance Coverage and High Self-Pay Friction in Emerging Asia-Pacific Markets
- 4.3.2 Shortage of Certified Technicians and Catastrophe-Scale Equipment Outside Major Cities
- 4.3.3 Fragmented Claims Protocols, Local Licensing and Inconsistent Restoration Standards
- 4.3.4 Limited Salvageability Windows for Water-Impacted Electronics, Data Centres and Industrial Assets
- 4.4 Value & Supply-Chain Analysis
- 4.4.1 Restoration Services Value Chain
- 4.4.2 Equipment, Chemicals, and Consumables Supply Chain
- 4.4.3 Labour and Specialist-Service Availability
- 4.4.4 Claims and Quality-Management Workflow
- 4.5 Regulatory Landscape
- 4.5.1 Building, Environmental, and Safety Regulations
- 4.5.2 Hazardous-Material and Environmental-Health Regulations
- 4.5.3 Insurance and Consumer-Protection Regulations
- 4.5.4 Disaster Management and Public-Procurement Framework
- 4.6 Technological Outlook
- 4.6.1 Digital Inspection and Remote Monitoring
- 4.6.2 AI, IoT, and Claims Automation
- 4.6.3 Drones and Remote Damage Assessment
- 4.6.4 Advanced Restoration Technologies
- 4.6.5 Robotics and Automation
5 MARKET SIZE AND GROWTH FORECASTS (VALUE, IN USD BILLION)
- 5.1 By Service Type
- 5.1.1 Water Damage Restoration (drying/dehumidification, sewage backup)
- 5.1.2 Fire & Smoke Damage Restoration
- 5.1.3 Mold Remediation
- 5.1.4 Storm / Catastrophe Restoration (wind, hail, flood response, large-loss)
- 5.1.5 Biohazard & Trauma Cleanup (crime scene, unattended death, infectious cleanup)
- 5.1.6 Specialty Services
- 5.1.7 Others (contents restoration, pack-out, cleaning, storage, etc.)
- 5.2 By Application
- 5.2.1 Residential
- 5.2.2 Commercial & Industrial
- 5.3 By Customer/Payor Type
- 5.3.1 Insurance-funded Restoration Work
- 5.3.2 Self-funded / Direct-pay Restoration Work
- 5.3.3 Public-sector / Government-funded Restoration Work
- 5.4 By Geography
- 5.4.1 China
- 5.4.2 India
- 5.4.3 Japan
- 5.4.4 Australia
- 5.4.5 Indonesia
- 5.4.6 Philippines
- 5.4.7 Thailand
- 5.4.8 Vietnam
- 5.4.9 Malaysia
- 5.4.10 Bangladesh
- 5.4.11 Rest of Asia-Pacific
6 COMPETITIVE LANDSCAPE
- 6.1 Market Concentration
- 6.2 Strategic Moves
- 6.3 Market Share Analysis
- 6.4 Company Profiles (includes Global Level Overview, Market Level Overview, Core Segments, Financials as available, Strategic Information, Products and Services, Recent Developments)
- 6.4.1 BELFOR Holdings, Inc.
- 6.4.2 Johns Lyng Group Limited
- 6.4.3 Steamatic Australia
- 6.4.4 Cowan Restoration Group
- 6.4.5 Elite Restoration
- 6.4.6 MSA Property Care and Restorations
- 6.4.7 Flood Services Australia
- 6.4.8 AllAces
- 6.4.9 Biodec Restoration Specialists
- 6.4.10 Water Damage Specialist
- 6.4.11 Reztor Restoration
- 6.4.12 Big Red Pte Ltd
- 6.4.13 Approved Group International
- 6.4.14 Bright Symphony Sdn Bhd
- 6.4.15 RecoveryPRO
- 6.4.16 SPREAD CO Limited
- 6.4.17 ServiceMaster Restore
- 6.4.18 Polygon group
- 6.4.19 SERVPRO Industries LLC
7 MARKET OPPORTUNITIES AND FUTURE OUTLOOK
- 7.1 White-Space & Unmet-Need Assessment
- 7.1.1 Underserved Geographic and Customer Markets
- 7.1.2 Specialized Restoration for Industrial and Critical Infrastructure
- 7.1.3 Preventive and Pre-Loss Restoration Services
- 7.1.4 Public-Sector and Resilience-Based Restoration
- 7.2 Future Outlook
- 7.2.1 Demand and Market Expansion Outlook
- 7.2.2 Insurance and Digitalization Trends
- 7.2.3 Technology Adoption
- 7.2.4 Strategic Priorities for Market Participants
- 7.2.5 Technology Adoption Outlook
- 7.2.6 Strategic Priorities for Regional and Local Operators

 地震預警裝置市場:全球市場預測,2026-2032年
 2026年全球備份與災害復原解決方案市場報告
 北美災害復原服務:市場佔有率分析、產業趨勢與統計及成長預測(2026-2031 年)歐洲災害復原服務:市場佔有率分析、產業趨勢與統計及成長預測(2026-2031 年)美國災害復原服務:市場佔有率分析、產業趨勢與統計及成長預測(2026-2031 年)
 全球危機管理軟體市場(2026-2030 年)緊急和災害應變:市場佔有率分析、行業趨勢和統計數據、成長預測(2026-2031 年)災害應變系統市場-2026-2032年全球市場預測
 災害應變系統市場:按類型、解決方案、服務、通訊技術、最終用途、國家和地區分類-全球產業分析、市場規模、市場佔有率和預測(2026-2033 年)
 銀行收費服務市場:市場規模、佔有率和趨勢分析(按服務、通路、最終用途和地區分類),細分市場預測(2026-2033 年)