


 |
市場調查報告書
商品編碼
2114596
緊急和災害應變:市場佔有率分析、行業趨勢和統計數據、成長預測(2026-2031 年)Emergency And Disaster Response - Market Share Analysis, Industry Trends & Statistics, Growth Forecasts (2026 - 2031) |
||||||

※ 本網頁內容可能與最新版本有所差異。詳細情況請與我們聯繫。
根據 Mordor Intelligence 預測,緊急和災害應變市場規模將從 2025 年的 1456.8 億美元成長到 2026 年的 1510.1 億美元,到 2031 年將達到 1830.2 億美元,2026 年至 2031 年的複合年成長率為 3.92%。
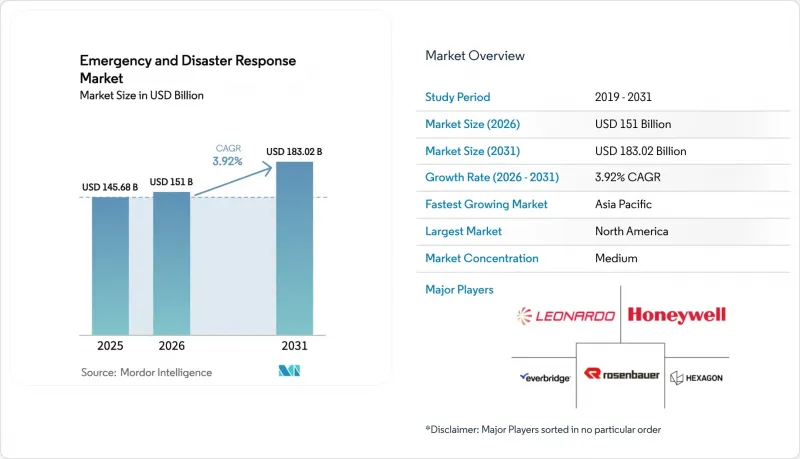
本報告按設備(威脅偵測設備、個人防護設備、醫療設備、臨時住所、登山裝備、消防裝備等)、平台(陸地、海洋、空中)、解決方案(硬體、軟體、服務)和地區(北美、歐洲、亞太、南美、中東和非洲)進行細分。市場預測以美元計價。
全球緊急應變與災害應變市場趨勢與洞察
自然災害的發生頻率和嚴重程度都在增加。
2024年,全球自然災害造成的經濟損失將達到2,800億美元,比2019年至2023年的年平均水準成長19%。預計近一半受災州和地區將在18個月內再次遭受大規模災害,這將縮短災後復原時間並消耗關鍵設備的儲備。因此,採購負責人正優先採購可空運、三天運作的貨櫃式水質淨化廠、充氣式手術室和預製式住宅單元。同時,預測分析平台正在將高解析度氣候模型與橋樑、堤防、醫院和其他基礎設施的脆弱性資料集結合,以輔助災前規劃。基於此,日本已撥款420億日圓(約2.85億美元)用於開發一套基於人工智慧的預測系統,該系統將直接整合到疏散路線引導軟體中。
政府資金和監管義務
政府支出和法律指令如今已成為推動現代化預算轉型為數位架構的兩大驅動力。美國在2025會計年度將州和地方政府災害防備津貼增加了14%,達到32億美元,其中35%用於技術升級,這意味著軟體訂閱、感測器融合和無人機機隊現在都有資格獲得津貼。在歐洲,2024年關鍵基礎設施韌性指令要求成員國每兩年進行一次壓力測試,並在2026年12月前過渡到可互通的寬頻網路,從而有效地淘汰老舊的窄頻無線電。海灣國家的買家傾向於選擇承包指揮中心。沙烏地阿拉伯在2024年撥款18億沙幣(約4.8億美元)用於建造一個國家級整合系統,這表明市場對由供應商管理、國家託管的解決方案的需求日益成長,這些解決方案能夠確保國內數據存儲並滿足多層網路認證標準。
開發中國家的預算限制
在災害風險日益加劇的背景下,資金短缺阻礙了中低收入地區設備的現代化進程。世界銀行指出,到2024年,撒哈拉以南非洲18個國家的政府將平均削減相當於GDP 1.2%的非債務公共投資,災害應變是這些削減的主要目標。作為回應,肯亞放棄了價值1200萬美元的行動指揮車採購競標,轉而選擇由歐洲機構提供的翻新車輛。
雪上加霜的是,貨幣貶值也構成了重大障礙。自2024年1月以來,奈及利亞奈拉(NGN)已貶值129%,導致熱成像儀、衛星電話和發電機等必需進口商品的價格加倍。儘管多邊金融機構已設立優惠貸款機制,但亞洲開發銀行的數據顯示,貸款發放存在令人擔憂的18至24個月的延遲。這些延遲導致在颶風和洪水季節接踵而至時出現能力缺口,迫使各機構繼續使用遠超其預期使用壽命的老舊設備。
細分市場分析
預計到2025年,個人防護設備)將佔銷售額的24.56%,凸顯其在緊急和災害應變市場中的關鍵作用。威脅偵測設備是成長最快的細分市場,複合年成長率(CAGR)達5.65%,這主要得益於化學、生物、放射性和核(CBRN)感測器的小型化以及人工智慧(AI)分析能力的提升。小型化拉曼光譜儀能夠在短短30秒內從包含14,000種化合物的資料庫中辨識化合物,目前正被各機構迅速採用。這種快速普及推動了緊急和災害應變領域威脅偵測設備市場的顯著成長。消防設備銷售額位居第二,但由於市政當局將雲梯消防車的使用壽命延長至18年,利潤率面臨壓力。臨時避難所設備主要集中在颶風易發地區,而登山設備則被高海拔救援隊廣泛使用。其他類別,例如去污設備和可攜式發電機,也為緊急和災害應變市場的整體成長做出了貢獻。
感測器精度的提升、抬頭顯示器的應用以及無線韌體更新的引入,使得威脅偵測設備成為創新的熱點領域。 3M公司的M7型自給式呼吸器(SCBA)透過將熱成像疊加到面罩上,降低了使用者在煙霧瀰漫的室內環境中的認知負荷。史密斯探測公司(Smiths Detection)的手持式拉曼感測器榮獲2025年女王獎,它透過將航空安保演算法應用於現場探測作業,展示了跨產業的技術轉移。隨著氣候變遷事件加劇危險物質洩漏的風險,採購負責人將高精度威脅偵測設備視為不可忽視的力量。將硬體與分析服務訂閱捆綁銷售的供應商,正透過軟體獲得穩定的利潤率,從而推動緊急和災害響應市場從硬體向軟體的廣泛轉變。
區域分析
北美地區在聯邦緊急災難管理署(FEMA) 的大力津貼和強制性技術更新周期的推動下,預計到 2025 年將佔全球銷售額的 37.15%。隨著市場飽和以及支出結構向軟體領域轉移,到 2031 年,其成長速度將放緩至 3.5% 的複合年成長率。加拿大正在投資 11 億加元(約 8.1 億美元)用於原住民社區的基礎設施建設,以拓展先前服務不足的細分市場。墨西哥正在對其地震預警網路進行現代化改造,計劃透過部署 2100 個加速計,將預警延遲時間縮短至 10 秒以內。
亞太地區正以5.20%的複合年成長率推動市場成長,成為最具活力的緊急和災害應變市場。中國已投資約65億美元用於省級人工智慧指揮中心建設,並計劃在2027年實現90%的數位化工作流程普及率。印度部署網狀無線網路和日本進行人工智慧預測試點項目,是直接邁向先進架構的典型例證。韓國的5G公共安全網路已覆蓋98%的人口,可實現事故現場的即時影像串流。印尼已採購85輛兩棲救援車,以應對2024年的洪災,而澳洲正在推進通訊標準化工作,以回應其2024年的評估。
在歐洲,緊急應變能力正在加強,這得益於歐盟救援計畫(rescEU)的資源共用模式和旨在提升各州和地方政府機構關鍵基礎設施韌性的大陸指令。德國正在升級其地理圍欄預警網路,而法國則正在引進多用途空中巴士直升機,以增強其空中醫療運輸和消防能力,並實施早期預警資料整合系統。在英國,新的寬頻緊急服務網路即將全面覆蓋,但終端認證仍面臨挑戰。在持續的製裁下,俄羅斯機構正專注於自主研發平台。海灣國家也正在增加旨在提升自身自主發展能力的項目,而巴西和南非則正在湧現新的資金籌措機制,以克服財政限制。
其他好處:
- Excel格式的市場預測(ME)表
- 3個月的分析師支持
目錄
第1章:引言
- 研究假設和市場定義
- 調查範圍
第2章:調查方法
第3章執行摘要
第4章 市場狀況
- 市場概覽
- 市場促進因素
- 自然災害的發生頻率和嚴重程度都在增加。
- 政府資金和監管義務
- 人工智慧、物聯網、地理資訊系統和無人機領域的技術進步
- 引入獨立於衛星的網狀網路
- 相容車輛向混合動力/電動動力傳動系統的過渡
- 跨境互助採購池
- 市場限制因素
- 開發中國家的預算限制
- 複雜且分散的互通性標準
- 互聯響應系統面臨網路攻擊的風險
- 熟練操作人員短缺,無法操作先進設備
- 價值鏈分析
- 監理情勢
- 技術展望
- 波特五力分析
第5章 市場規模與成長預測
- 透過裝置
- 威脅偵測設備
- 個人防護設備
- 醫療設備
- 臨時住所
- 攀岩裝備
- 消防設備
- 其他
- 按平台
- 土地
- 海
- 航空
- 透過解決方案
- 硬體
- 軟體
- 服務
- 按地區
- 北美洲
- 美國
- 加拿大
- 墨西哥
- 歐洲
- 英國
- 法國
- 德國
- 俄羅斯
- 其他歐洲國家
- 亞太地區
- 中國
- 印度
- 日本
- 韓國
- 其他亞太國家
- 南美洲
- 巴西
- 其他南美國家
- 中東和非洲
- 中東
- 沙烏地阿拉伯
- 阿拉伯聯合大公國
- 以色列
- 其他中東國家
- 非洲
- 南非
- 其他非洲國家
- 中東
- 北美洲
第6章 競爭情勢
- 市場集中度
- 策略趨勢
- 市佔率分析
- 公司簡介
- Honeywell International Inc.
- Motorola Solutions, Inc.
- Everbridge, Inc.
- Hexagon AB
- Rosenbauer International AG
- Textron Systems Corporation(Textron Inc.)
- Leonardo SpA
- REV Group, Inc.
- 3M Company
- Smiths Group plc
- De Havilland Aircraft of Canada Limited.
- Emergency One Group
- Juvare, LLC
- Esri Global, Inc.
- Darley
- Albert Ziegler GmbH
- Magirus GmbH
- IBM Corporation
第7章 市場機會與未來展望
According to Mordor Intelligence, the emergency and disaster response market size is expected to grow from USD 145.68 billion in 2025 to USD 151.01 billion in 2026 and is forecasted to reach USD 183.02 billion by 2031 at a 3.92% CAGR over 2026-2031.
This report is Segmented by Equipment (Threat Detection, Personal Protection Gear, Medical, Temporary Shelter, Mountaineering, Firefighting, and More), Platform (Land, Marine, and Airborne), Solution (Hardware, Software, and Services), and Geography (North America, Europe, Asia-Pacific, South America, and Middle East and Africa). The Market Forecasts are Provided in Terms of Value (USD).
Global Emergency And Disaster Response Market Trends and Insights
Rising Frequency and Severity of Natural Disasters
Natural disasters resulted in USD 280 billion in global economic losses in 2024, a 19% surge over the annual average for 2019-2023. Almost half of the impacted provinces, states, or districts subsequently endured another major event within an 18-month window, compressing recovery periods and exhausting inventories of critical gear. Procurement officers are therefore prioritizing fly-ready containerized water-purification plants, inflatable surgical theaters, and flat-pack housing units that can be airlifted and operational within three days. Simultaneously, predictive analytics platforms now integrate high-resolution climate models with vulnerability datasets for bridges, levees, and hospitals to guide pre-disaster planning. Reflecting this mindset, Japan earmarked JPY 42 billion (approximately USD 285 million) in 2025 for AI forecasting systems that integrate directly into evacuation-routing software.
Government Funding and Regulatory Mandates
Government outlays and statutory directives are now the twin accelerants steering modernization budgets toward digital architectures. The US increased state and local preparedness grants by 14% to USD 3.2 billion for 2025. It allocated 35% of the total for technology upgrades, indicating that software subscriptions, sensor fusion, and drone fleets are now allowable grant expenses. In Europe, the 2024 Critical Entities Resilience Directive requires each member state to conduct biennial stress tests and migrate to interoperable broadband networks by December 2026, effectively phasing out legacy narrowband radios. Gulf buyers prefer turnkey command centers. Saudi Arabia allocated SAR 1.8 billion (approximately USD 480 million) in 2024 for an integrated national system, underscoring the growing demand for vendor-managed, sovereign-hosted solutions that ensure data residency and meet multilevel cyber certification standards.
Budget Constraints in Developing Economies
As hazard exposure intensifies, limited fiscal headroom is stalling equipment modernization in lower-middle-income regions. The World Bank highlighted that in 2024, 18 governments across Sub-Saharan Africa reduced non-debt public investments by an average of 1.2% of GDP, with disaster preparedness facing the brunt of these cuts. In response, Kenya abandoned a USD 12 million tender for a mobile command unit and opted instead for refurbished vehicles provided by European agencies.
Adding to the woes, currency depreciation poses a significant hurdle: NGN has plummeted by 129% since January 2024, effectively more than doubling the price of essential imports, such as thermal cameras, satellite phones, and power generators. While multilateral lenders have rolled out concessional facilities, data from the Asian Development Bank reveal a concerning lag: loan disbursements stretch over 18-24 months. This delay creates capability gaps during back-to-back cyclone or flood seasons, forcing agencies to push aging hardware well beyond its intended service life.
Other drivers and restraints analyzed in the detailed report include:
- Technological Advances in AI, IoT, GIS and Drones
- Satellite-Independent Mesh Networking Adoption
- Complex and Fragmented Interoperability Standards
For complete list of drivers and restraints, kindly check the Table Of Contents.
Segment Analysis
Personal protection gear accounted for 24.56% of 2025 revenue, underscoring its non-discretionary status in the emergency and disaster response market. Threat detection equipment is the fastest-growing segment, with a 5.65% CAGR, as chemical, biological, radiological, and nuclear sensors shrink and incorporate AI analytic layers. Miniaturized Raman spectrometers that can identify a chemical compound from a database of 14,000 in just 30 seconds are being rapidly adopted by agencies. This swift adoption is driving significant growth in the market for threat-detection equipment used in emergency and disaster response. Firefighting equipment ranks second in revenue but faces margin pressure as municipalities extend ladder truck lifespans to 18 years. Temporary shelter equipment remains concentrated in hurricane belts, whereas mountaineering equipment serves alpine rescue teams. A residual "other" balancer of decontamination units and portable generators tracks overall growth in the emergency and disaster response market.
Improving sensor accuracy, utilizing heads-up displays, and implementing over-the-air firmware upgrades make threat detection equipment a magnet for innovation. 3M's M7 SCBA overlays thermal detail on the visor, lightening cognitive load in smoky interiors. Smiths Detection's handheld Raman device, honored with a Queen's Award in 2025, migrated aviation-security algorithms into field detection tasks, demonstrating cross-sector tech transfer. As climate events increase the risk of hazardous-materials spills, procurement officers view high-fidelity threat detectors as force multipliers. Vendors that bundle analytics subscriptions with hardware are capturing sticky software margins, reinforcing the broader shift from hardware to software in the emergency and disaster response market.
Complete Report Scope:
- By Equipment
- Threat Detection Equipment
- Personal Protection Gear
- Medical Equipment
- Temporary Shelter Equipment
- Mountaineering Equipment
- Fire-Fighting Equipment
- Other Equipment
- By Platform
- Land
- Marine
- Airborne
- By Solution
- Hardware
- Software
- Services
- By Geography
- North America
- United States
- Canada
- Mexico
- Europe
- United Kingdom
- France
- Germany
- Russia
- Rest of Europe
- Asia-Pacific
- China
- India
- Japan
- South Korea
- Rest of Asia-Pacific
- South America
- Brazil
- Rest of South America
- Middle East and Africa
- Middle East
- Saudi Arabia
- United Arab Emirates
- Israel
- Rest of Middle East
- Africa
- South Africa
- Rest of Africa
- Middle East
- North America
Geography Analysis
North America accounted for 37.15% of 2025 revenue, driven by robust FEMA grant streams and mandatory technology refresh cycles. Growth moderates to a 3.5% CAGR through 2031 as the installed base saturates and the spending mix skews toward software. Canada funneled CAD 1.1 billion (USD 810 million) into Indigenous community infrastructure, expanding previously underserved sub-markets. Mexico is modernizing its seismic alert grid with 2,100 accelerometers to cut warning latency below 10 seconds.
The Asia-Pacific region leads expansion with a 5.20% CAGR, proving to be the most dynamic emergency and disaster response market. China has invested approximately USD 6.5 billion in provincial AI-enabled command centers and aims to achieve 90% digital workflow adoption by 2027. India's mesh-radio rollout and Japan's AI forecasting pilots exemplify leapfrogging directly to advanced architectures. South Korea's 5G public safety network already covers 98% of the population, enabling live video feeds from incident scenes. Indonesia procured 85 amphibious rescue vehicles following the 2024 floods, whereas Australia is standardizing communications following the 2024 review.
Europe continues to strengthen its emergency response landscape, driven by the rescEU pooling model and a continent-wide directive that hardens critical entities across provincial and municipal agencies. Germany is upgrading its geofenced alert network, while France has commissioned multi-role Airbus helicopters to bolster aerial medical evacuation and firefighting capacity, as well as early warning data fusion systems. The UK is approaching full coverage on its new broadband emergency services network, although device certification remains a hurdle. Russian agencies are focusing on domestically produced platforms amid ongoing sanctions. Sovereign capability programs are also rising in the Gulf, and new funding mechanisms are emerging in Brazil and South Africa to offset fiscal constraints.
- Honeywell International Inc.
- Motorola Solutions, Inc.
- Everbridge, Inc.
- Hexagon AB
- Rosenbauer International AG
- Textron Systems Corporation (Textron Inc.)
- Leonardo S.p.A.
- REV Group, Inc.
- 3M Company
- Smiths Group plc
- De Havilland Aircraft of Canada Limited.
- Emergency One Group
- Juvare, LLC
- Esri Global, Inc.
- Darley
- Albert Ziegler GmbH
- Magirus GmbH
- IBM Corporation
Additional Benefits:
- The market estimate (ME) sheet in Excel format
- 3 months of analyst support
TABLE OF CONTENTS
1 INTRODUCTION
- 1.1 Study Assumptions and Market Definition
- 1.2 Scope of the Study
2 RESEARCH METHODOLOGY
3 EXECUTIVE SUMMARY
4 MARKET LANDSCAPE
- 4.1 Market Overview
- 4.2 Market Drivers
- 4.2.1 Rising frequency and severity of natural disasters
- 4.2.2 Government funding and regulatory mandates
- 4.2.3 Technological advances in AI, IoT, GIS and drones
- 4.2.4 Satellite-independent mesh networking adoption
- 4.2.5 Hybrid/e-powertrain shift in response vehicles
- 4.2.6 Cross-border mutual-aid procurement pools
- 4.3 Market Restraints
- 4.3.1 Budget constraints in developing economies
- 4.3.2 Complex and fragmented interoperability standards
- 4.3.3 Cyber-attack risk on connected response systems
- 4.3.4 Skilled-operator shortage for advanced assets
- 4.4 Value Chain Analysis
- 4.5 Regulatory Landscape
- 4.6 Technological Outlook
- 4.7 Porter's Five Forces Analysis
- 4.7.1 Bargaining Power of Suppliers
- 4.7.2 Bargaining Power of Buyers/Consumers
- 4.7.3 Threat of New Entrants
- 4.7.4 Threat of Substitute Products
- 4.7.5 Intensity of Competitive Rivalry
5 MARKET SIZE AND GROWTH FORECASTS (VALUE)
- 5.1 By Equipment
- 5.1.1 Threat Detection Equipment
- 5.1.2 Personal Protection Gear
- 5.1.3 Medical Equipment
- 5.1.4 Temporary Shelter Equipment
- 5.1.5 Mountaineering Equipment
- 5.1.6 Fire-Fighting Equipment
- 5.1.7 Other Equipment
- 5.2 By Platform
- 5.2.1 Land
- 5.2.2 Marine
- 5.2.3 Airborne
- 5.3 By Solution
- 5.3.1 Hardware
- 5.3.2 Software
- 5.3.3 Services
- 5.4 By Geography
- 5.4.1 North America
- 5.4.1.1 United States
- 5.4.1.2 Canada
- 5.4.1.3 Mexico
- 5.4.2 Europe
- 5.4.2.1 United Kingdom
- 5.4.2.2 France
- 5.4.2.3 Germany
- 5.4.2.4 Russia
- 5.4.2.5 Rest of Europe
- 5.4.3 Asia-Pacific
- 5.4.3.1 China
- 5.4.3.2 India
- 5.4.3.3 Japan
- 5.4.3.4 South Korea
- 5.4.3.5 Rest of Asia-Pacific
- 5.4.4 South America
- 5.4.4.1 Brazil
- 5.4.4.2 Rest of South America
- 5.4.5 Middle East and Africa
- 5.4.5.1 Middle East
- 5.4.5.1.1 Saudi Arabia
- 5.4.5.1.2 United Arab Emirates
- 5.4.5.1.3 Israel
- 5.4.5.1.4 Rest of Middle East
- 5.4.5.2 Africa
- 5.4.5.2.1 South Africa
- 5.4.5.2.2 Rest of Africa
- 5.4.5.1 Middle East
- 5.4.1 North America
6 COMPETITIVE LANDSCAPE
- 6.1 Market Concentration
- 6.2 Strategic Moves
- 6.3 Market Share Analysis
- 6.4 Company Profiles (includes Global level Overview, Market level overview, Core Segments, Financials, Strategic Info, Market Rank/Share, Products and Services, and Recent Developments)
- 6.4.1 Honeywell International Inc.
- 6.4.2 Motorola Solutions, Inc.
- 6.4.3 Everbridge, Inc.
- 6.4.4 Hexagon AB
- 6.4.5 Rosenbauer International AG
- 6.4.6 Textron Systems Corporation (Textron Inc.)
- 6.4.7 Leonardo S.p.A.
- 6.4.8 REV Group, Inc.
- 6.4.9 3M Company
- 6.4.10 Smiths Group plc
- 6.4.11 De Havilland Aircraft of Canada Limited.
- 6.4.12 Emergency One Group
- 6.4.13 Juvare, LLC
- 6.4.14 Esri Global, Inc.
- 6.4.15 Darley
- 6.4.16 Albert Ziegler GmbH
- 6.4.17 Magirus GmbH
- 6.4.18 IBM Corporation
7 MARKET OPPORTUNITIES AND FUTURE OUTLOOK
- 7.1 White-space and Unmet-Need Assessment

 地震預警裝置市場:全球市場預測,2026-2032年
 2026年全球備份與災害復原解決方案市場報告
 亞太地區災害復原服務:市場佔有率分析、產業趨勢與統計及成長預測(2026-2031 年)北美災害復原服務:市場佔有率分析、產業趨勢與統計及成長預測(2026-2031 年)歐洲災害復原服務:市場佔有率分析、產業趨勢與統計及成長預測(2026-2031 年)美國災害復原服務:市場佔有率分析、產業趨勢與統計及成長預測(2026-2031 年)
 全球危機管理軟體市場(2026-2030 年)災害應變系統市場-2026-2032年全球市場預測
 災害應變系統市場:按類型、解決方案、服務、通訊技術、最終用途、國家和地區分類-全球產業分析、市場規模、市場佔有率和預測(2026-2033 年)
 銀行收費服務市場:市場規模、佔有率和趨勢分析(按服務、通路、最終用途和地區分類),細分市場預測(2026-2033 年)