


 |
市場調查報告書
商品編碼
2156946
美國災害復原服務:市場佔有率分析、產業趨勢與統計及成長預測(2026-2031 年)United States Disaster Restoration Services - Market Share Analysis, Industry Trends & Statistics, Growth Forecasts (2026 - 2031) |
||||||

※ 本網頁內容可能與最新版本有所差異。詳細情況請與我們聯繫。
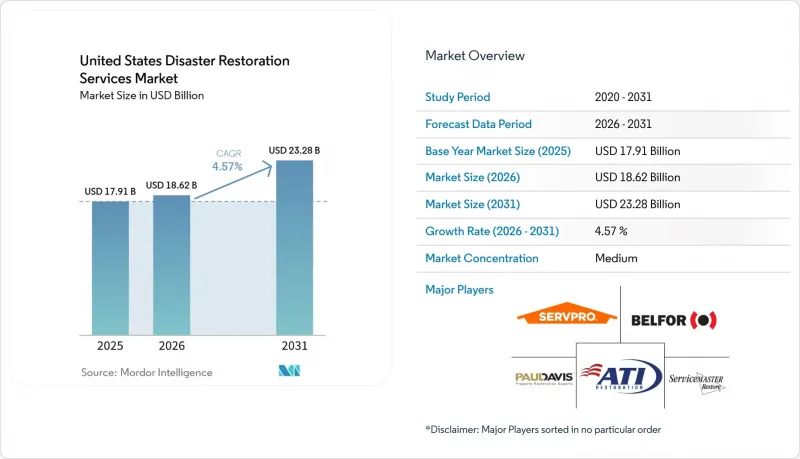
根據 Mordor Intelligence 預測,美國災害復原服務市場規模將從 2025 年的 179.1 億美元成長到 2026 年的 186.2 億美元,然後在 2031 年達到 232.8 億美元,2026 年至 2031 年的複合年成長率為 4.57%。
美國災害復原服務市場的趨勢與洞察
強對流風暴和洪水頻繁造成財產損失。
當大規模風暴同時對住宅、企業和公共設施造成破壞時,美國災害復原服務市場的需求將會顯著成長。根據氣候中心(Climate Central)的記錄顯示,預計到2025年,天氣和氣候災害造成的損失將達到230億美元,總損失將達到1,150億美元。其中21起災害將歸因於強對流風暴,創下新的年度紀錄,反映出美國中部地區龍捲風數量的激增。據估計,2025年1月洛杉磯的一場野火造成了612億美元的損失,超過16,000處房產受損或被毀,並迫使超過20萬人撤離。兩次造成數十億美元損失的災害之間的間隔已從20世紀80年代的82天縮短至2016年至2025年間的僅16天,這使得承包商和保險公司處理先前損失的時間更加有限。 2025 年的一項研究估計,2026 年至 2030 年間,美國因天氣和氣候災害造成的總損失有 54% 的機率超過 1 兆美元,這凸顯了擴大災後復原力的必要性。
老舊的住宅存量和建築設備需要反覆維護。
隨著住宅老化,諸如管道、電氣系統、屋頂和暖通空調系統等基礎設施更容易出現故障,導致美國災害復原服務市場對維修的需求不斷成長。約48%的自住住宅建於1980年之前,自住住宅的中位數房齡從2005年的31年上升到2023年的41年。哈佛大學住宅研究聯合中心的一項研究發現,1980年之前建造的住宅的維護成本比2010年後建造的住宅高出76%。這種成本差異反映了系統故障發生頻率更高,而這些故障可能導致洪水、火災、黴菌滋生以及相關的維修工作。 2020年至2023年間,自住住宅存量中新建住宅的比例僅增加了3%,這意味著新增供應對住宅年齡分佈的影響甚微。對於維護不善的老舊住宅而言,一次事故可能需要對多個系統進行維修,從而增加工作範圍和成本。持續不斷的維修工作能夠確保承包商即使在大規模災害時期也能獲得更穩定的訂單來源。
對避免業務中斷和端到端恢復的需求。
企業客戶正利用美國災害復原服務市場,盡可能縮短受損設施的運作時間。由於業務中斷賠償通常涵蓋恢復期間的收入損失,因此縮短恢復時間對投保人和保險公司而言都是理想的結果。根據保險資訊研究所 (Insurance Information Institute) 的數據,中型企業的業務中斷損失可能在 50 萬美元到 300 萬美元之間,而擁有複雜供應鏈的大型企業的損失則可能在 500 萬美元到 5000 萬美元以上。鑑於這些財務風險,能夠在一個企劃團隊內協調緊急損害緩解、結構修復和重組的承包商具有顯著優勢。隨著獲得業務中斷賠償變得越來越困難,風險管理人員和負責人更加關注恢復時間。因此,能夠有效完成工作的承包商不僅在初始清理成本方面具有競爭力,而且在恢復計劃和文件編制方面也具有競爭力。在大規模商業災害發生後,將大量復原工作外包給單一承包商的做法,使美國災害復原服務市場受益匪淺。
細分市場分析
2025年,洪水災後重建服務占美國災害復原服務市場佔有率的32.60%。由於管道故障、電器漏水、污水倒流以及各種天氣相關的洪水等原因,該領域的服務需求量龐大。根據保險資訊研究所 (III) 估計,每年每60戶投保住宅中就有一戶會因洪水或霜凍損害提出保險索賠。這些反覆發生的災害確保了洪水災後重建工作需求的穩定下限,從而為當地的緊急應變網路提供了支援。 2025年1月洛杉磯山火過後,火災和煙燻損害重建服務的需求進一步激增。 ATI Restoration公司在南加州動員了1000多名團隊成員,並在救援期間管理了500多個重建項目。由於2025年記錄在案的21場“十億美元級風暴”,與風暴和災害相關的工作量也有所增加。在這種情況下,企業可能需要在維持本地正常運作的同時,將員工和設備跨州調動。
在美國災害復原服務市場中,「其他」類別是成長最快的服務類別,預計到2031年將以6.90%的複合年成長率成長。此類別包括財產恢復、打包和搬運、清潔、儲存、物業管理和文件乾燥。客戶通常希望找到一家能夠在同一重建計劃中同時處理財產恢復和結構修復的單一供應商。由於洪水造成的二次污染需要專門的處理,因此對黴菌清除的需求正在增加。根據IICRC S540協議,生物危害和創傷場所的清潔服務也擴展到了醫療機構、多用戶住宅和商業房地產。當老舊建築(包括受美國環保署鉛漆揭露規則約束的房產)需要進行預評估時,專業服務的範圍可能會擴大。二次服務的增加以及對全面恢復的期望,為企業在最初的緊急應變之後繼續運營提供了更多機會。
其他好處:
- Excel格式的市場預測(ME)表
- 3個月的分析師支持
目錄
第1章:引言
- 研究假設和市場定義
- 調查範圍
第2章:調查方法
第3章執行摘要
第4章 市場狀況
- 市場概覽
- 美國市場結構與營運模式
- 災後復原服務組成:損害緩解、修復、復原、重組
- 定期損失和重大災害導致的需求增加。
- 按物業類型分類的需求:住宅、商業、工業
- 按損壞類型分類的需求:洪水損壞、火災/煙熏損壞、風暴/洪水損壞、黴菌損壞和特殊修復。
- 保險公司委託進行的維修和保險公司直接支付的維修。
- 響應時間、服務覆蓋範圍和災害應變能力
- 季節性需求和災害導致的需求激增
- 恢復生態系統
- 業主、設施管理人員和物業經理
- 保險公司、理賠員、第三方管理機構及維修管理網路
- 修復承包商、加盟網路和全國性平台
- 總承包商和專業提供服務業者
- 設備、技術和維修材料供應商
- 負責人。
- 認證、培訓和監管機構
- 需求趨勢
- 水和管道相關損害
- 火災、煙霧和野火造成的損害
- 暴風雨、洪水和惡劣天氣造成的損失。
- 黴菌和環境修復
- 特殊/生物危害回收
- 重大災害和反覆損害造成的損失索賠
- 區域趨勢
- 東北
- 中西部
- 南部和墨西哥灣沿岸地區
- 西方
- 易受大規模災害影響的主要市場
- 服務覆蓋範圍包括大都會圈和農村地區
- 保險業參與
- 財產產物保險保險索賠
- 住宅保險、商業財產保險和特殊保險
- 自付額、承保限額和保險不足
- 優先供應商計劃和維修管理計劃
- 與保險索賠相關的文件準備、估算和範圍管理。
- 災害保險承保能力與市場變化
- 聯邦災害救濟和洪水保險
- 市場促進因素
- 強對流風暴和洪水頻繁造成財產損失。
- 老舊的住宅存量和建築系統需要反覆維修。
- 由於保險公司指定的供應商網路,回收業務外包的情況日益增加。
- 對避免業務中斷和端到端恢復的需求。
- 網路化洩漏檢測與數位化保險理賠的融合,催生了對早期反應的需求。
- 二次性市場的特許經營正在擴大美國服務不足地區的覆蓋範圍。
- 市場限制因素
- 熟練技術人員短缺和資格認證瓶頸
- 保險賠償延遲、保險範圍爭議以及保險理賠處理過程中的摩擦。
- 重大災害期間保險承保能力失衡與當地勞動力更替
- 透過預防性監測減少嚴重反應能力損失
- 價值和供應鏈分析
- 維修服務的價值鏈
- 設備、化學品和耗材的供應鏈
- 帳單、發票開立和付款工作流程
- 監理情勢
- 聯邦和州政府的復甦條例
- 環境和安全法規
- 保險和消費者保護相關法規
- 技術展望
- 人工智慧、數位化檢測和自動化
- 物聯網、遠端監控和損失預防
- 先進的修復技術
- 數位化計費、調度和工作流程平台
第5章 市場規模與成長預測
- 按服務類型
- 洪水災害復原(乾燥、除濕、污水回流預防)
- 火災和煙熏損害恢復
- 黴菌清除
- 風暴/大規模災害復原(風災、冰雹災害、洪水應變、大規模災害)
- 生物危害與創傷現場清理(犯罪現場、自然死亡現場、感染疾病相關清理)
- 專業服務
- 其他服務(家居用品修復、包裝、清潔、倉儲等)
- 透過使用
- 住宅
- 商業和工業用途
- 依客戶/付款人類型
- 保險涵蓋的維修工作
- 自籌/直接支付的維修工作
- 公共部門/政府資助的修復工作
第6章 競爭情勢
- 市場集中度
- 策略趨勢
- 市佔率分析
- 公司簡介
- SERVPRO Industries, LLC
- BELFOR Holdings Inc.
- ServiceMaster Restore
- ATI Restoration
- Paul Davis Restoration, Inc.
- First Onsite Property Restoration
- Blackmon Mooring and BMS CAT
- Rainbow Restoration
- PuroClean
- DKI Services
- BluSky Restoration Contractors
- Kustom US
- Cotton Global Disaster Solutions
- Signal Restoration Services
- Steamatic Inc.
- Restoration 1
- Rytech Restoration
- FRSTeam
- Bio-One Inc.
- United Water Restoration Group
- Polygon Group
第7章 市場機會與未來展望
According to Mordor Intelligence, the United States disaster restoration services market size is expected to grow from USD 17.91 billion in 2025 to USD 18.62 billion in 2026 and is forecast to reach USD 23.28 billion by 2031 at 4.57% CAGR over 2026-2031.
United States Disaster Restoration Services Market Trends and Insights
More Frequent Severe Convective Storm and Flood-Related Property Losses
The United States disaster restoration services market receives a major demand stimulus when widespread storms damage homes, businesses, and public facilities at the same time. Climate Central recorded USD 23 billion in weather and climate disasters in 2025, with total damages of USD 115 billion. Severe convective storms accounted for 21 of those events, which was a new annual record and reflected concentrated tornado outbreaks across the central United States. January 2025 Los Angeles wildfires caused USD 61.2 billion in estimated damage, damaged or destroyed more than 16,000 properties, and led to more than 200,000 evacuations. The interval between billion-dollar disasters fell from 82 days in the 1980s to 16 days during 2016-2025, leaving less time for contractors and carriers to clear prior losses. A 2025 study estimated a 54% probability that aggregate United States weather and climate disaster damages would exceed USD 1 trillion during 2026-2030, supporting the need for larger restoration capacity.
Aging Housing Stock and Building Systems Requiring Repeated Mitigation
Aging homes create recurring repair needs for the United States disaster restoration services market because older plumbing, electrical, roofing, and HVAC systems fail more often. Nearly 48% of owner-occupied homes were built before 1980, and the median age of owner-occupied housing reached 41 years in 2023, up from 31 years in 2005. Harvard University's Joint Center for Housing Studies found that maintenance spending for homes built before 1980 was 76% higher than for homes built from 2010 onward. That spending gap reflects more frequent system failures that can lead to water damage, fire damage, mold, and related remediation work. New construction added only 3% to the owner-occupied housing stock from 2020 through 2023, so new supply did little to change the age profile. Older homes with delayed upkeep can require work across several systems after one event, increasing both the scope and the billable value of a job. This base of recurring work gives providers a steadier assignment flow beyond major catastrophe periods.
Business-Interruption Avoidance and Demand for End-To-End Recovery
Commercial clients use the United States disaster restoration services market to reduce the period during which a damaged site cannot operate. Business-interruption coverage commonly addresses lost income during the period of restoration, so policyholders and insurers both have a reason to shorten recovery time. The Insurance Information Institute stated that business-interruption losses can range from USD 500,000 to USD 3 million for mid-tier operations and from USD 5 million to USD 50 million or more for major facilities with complex supply chains. This financial exposure favors contractors that coordinate emergency mitigation, structural repair, and reconstruction through one project team. Risk managers and underwriters have placed more attention on restoration duration as business-interruption coverage has become harder to secure. Providers that complete work efficiently can therefore compete on recovery planning and documentation, rather than only on initial cleanup pricing. The United States disaster restoration services market benefits when broader recovery work is assigned to one contractor after a large commercial loss.
Other drivers and restraints analyzed in the detailed report include:
- Insurer Preferred-Vendor Networks Expanding Outsourced Restoration Volume
- Skilled Technician Shortages and Certification Bottlenecks
- Insurance Payment Delays, Scope Disputes, and Claims-Administration Friction
For complete list of drivers and restraints, kindly check the Table Of Contents.
Segment Analysis
Water damage restoration held 32.60% of the United States disaster restoration services market share in 2025. The segment has a large volume of calls because plumbing failures, appliance leaks, sewage backups, and weather-related flooding occur in every region. The Insurance Information Institute estimated that 1 in 60 insured homes filed a water or freezing damage claim each year. This recurring incidence gives water work a dependable demand floor and supports local response networks. Fire and smoke damage restoration saw heavier demand after the January 2025 Los Angeles wildfires. ATI Restoration deployed more than 1,000 team members and managed more than 500 recovery projects in Southern California during that response. Storm and catastrophe work also increased with the 21 severe-storm billion-dollar events recorded in 2025. These events can require providers to move crews and equipment across state lines while maintaining everyday local assignments.
Others is the fastest-growing service group, with a projected 6.90% CAGR through 2031 for the United States disaster restoration services market size. This category includes contents restoration, pack-out, cleaning, storage, personal property management, and document drying. Clients often seek one provider that can address property contents and structural work in the same recovery plan. Mold remediation grows after water events create secondary contamination that needs specialized treatment. Biohazard and trauma cleanup is also extending into health care, multifamily housing, and commercial settings under IICRC S540 protocols. Specialty services can gain scope where pre-assessment is needed for older buildings, including properties subject to EPA lead paint disclosure rules. The combination of secondary services and full recovery expectations gives companies more opportunities to retain work after the initial emergency call.
Complete Report Scope:
- By Service Type
- Water Damage Restoration (drying/dehumidification, sewage backup)
- Fire & Smoke Damage Restoration
- Mold Remediation
- Storm / Catastrophe Restoration (wind, hail, flood response, large-loss)
- Biohazard & Trauma Cleanup (crime scene, unattended death, infectious cleanup)
- Specialty Services
- Others (contents restoration, pack-out, cleaning, storage, etc.)
- By Application
- Residential
- Commercial & Industrial
- By Customer/Payor Type
- Insurance-funded Restoration Work
- Self-funded / Direct-pay Restoration Work
- Public-sector / Government-funded Restoration Work
List of Companies Covered in this Report:
- SERVPRO Industries, LLC
- BELFOR Holdings Inc.
- ServiceMaster Restore
- ATI Restoration
- Paul Davis Restoration, Inc.
- First Onsite Property Restoration
- Blackmon Mooring and BMS CAT
- Rainbow Restoration
- PuroClean
- DKI Services
- BluSky Restoration Contractors
- Kustom US
- Cotton Global Disaster Solutions
- Signal Restoration Services
- Steamatic Inc.
- Restoration 1
- Rytech Restoration
- FRSTeam
- Bio-One Inc.
- United Water Restoration Group
- Polygon Group
Additional Benefits:
- The market estimate (ME) sheet in Excel format
- 3 months of analyst support
TABLE OF CONTENTS
1 INTRODUCTION
- 1.1 Study Assumptions and Market Definition
- 1.2 Scope of the Study
2 RESEARCH METHODOLOGY
3 EXECUTIVE SUMMARY
4 MARKET LANDSCAPE
- 4.1 Market Overview
- 4.1.1 United States Market Structure and Operating Model
- 4.1.2 Restoration Service Mix: Mitigation, Remediation, Restoration and Reconstruction
- 4.1.3 Recurring Losses vs. Catastrophe-Driven Demand
- 4.1.4 Demand by Property Type: Residential, Commercial and Industrial
- 4.1.5 Demand by Loss Type: Water, Fire & Smoke, Storm & Flood, Mold and Specialty Restoration
- 4.1.6 Insurance-Assigned vs. Direct-Pay Restoration
- 4.1.7 Response Time, Service Coverage and Catastrophe Capacity
- 4.1.8 Seasonal Demand and Disaster-Driven Demand Surges
- 4.2 Restoration Ecosystem
- 4.2.1 Property Owners, Facility Managers and Property Managers
- 4.2.2 Insurers, Adjusters, TPAs and Managed-Repair Networks
- 4.2.3 Restoration Contractors, Franchise Networks and National Platforms
- 4.2.4 General Contractors and Specialty Service Providers
- 4.2.5 Equipment, Technology and Restoration Supply Providers
- 4.2.6 Government and Public-Sector Restoration Buyers
- 4.2.7 Certification, Training and Regulatory Organizations
- 4.3 Demand Patterns
- 4.3.1 Water and Plumbing-Related Losses
- 4.3.2 Fire, Smoke and Wildfire Damage
- 4.3.3 Storm, Flood and Severe Weather Damage
- 4.3.4 Mold and Environmental Restoration
- 4.3.5 Specialty and Biohazard Restoration
- 4.3.6 Catastrophe vs. Recurring Loss Demand
- 4.4 Regional Dynamics
- 4.4.1 Northeast
- 4.4.2 Midwest
- 4.4.3 South and Gulf Coast
- 4.4.4 West
- 4.4.5 Major Catastrophe-Prone Markets
- 4.4.6 Metropolitan vs. Rural Service Coverage
- 4.5 Insurance Involvement
- 4.5.1 Property and Casualty Insurance Claims
- 4.5.2 Homeowners, Commercial Property and Specialty Insurance
- 4.5.3 Deductibles, Coverage Limits and Underinsurance
- 4.5.4 Preferred-Vendor and Managed-Repair Programs
- 4.5.5 Claims Documentation, Estimation and Scope Management
- 4.5.6 Catastrophe Insurance Capacity and Market Changes
- 4.5.7 Federal Disaster Assistance and Flood Insurance
- 4.6 Market Drivers
- 4.6.1 More Frequent Severe Convective Storm and Flood-Related Property Losses
- 4.6.2 Aging Housing Stock and Building Systems Requiring Repeated Mitigation
- 4.6.3 Insurer Preferred-Vendor Networks Expanding Outsourced Restoration Volume
- 4.6.4 Business-Interruption Avoidance and Demand for End-to-End Recovery
- 4.6.5 Connected Leak Detection and Digital Claims Integration Creating Earlier Intervention Demand
- 4.6.6 Secondary-Market Franchise Expansion Improving Coverage in Underserved U.S. Territories
- 4.7 Market Restraints
- 4.7.1 Skilled Technician Shortages and Certification Bottlenecks
- 4.7.2 Insurance Payment Delays, Scope Disputes, and Claims-Administration Friction
- 4.7.3 Catastrophe Surge Capacity Mismatch and Local Labor Displacement
- 4.7.4 Preventive Monitoring Reducing the Volume of Severe Reactive Losses
- 4.8 Value & Supply-Chain Analysis
- 4.8.1 Restoration Services Value Chain
- 4.8.2 Equipment, Chemicals and Consumables Supply Chain
- 4.8.3 Claims, Billing and Payment Workflow
- 4.9 Regulatory Landscape
- 4.9.1 Federal and State Restoration Regulations
- 4.9.2 Environmental and Safety Regulations
- 4.9.3 Insurance and Consumer-Protection Regulations
- 4.10 Technological Outlook
- 4.10.1 AI, Digital Inspection and Automation
- 4.10.2 IoT, Remote Monitoring and Loss Prevention
- 4.10.3 Advanced Restoration Technologies
- 4.10.4 Digital Claims, Dispatch and Workflow Platforms
5 MARKET SIZE AND GROWTH FORECASTS (Value, In USD Billion)
- 5.1 By Service Type
- 5.1.1 Water Damage Restoration (drying/dehumidification, sewage backup)
- 5.1.2 Fire & Smoke Damage Restoration
- 5.1.3 Mold Remediation
- 5.1.4 Storm / Catastrophe Restoration (wind, hail, flood response, large-loss)
- 5.1.5 Biohazard & Trauma Cleanup (crime scene, unattended death, infectious cleanup)
- 5.1.6 Specialty Services
- 5.1.7 Others (contents restoration, pack-out, cleaning, storage, etc.)
- 5.2 By Application
- 5.2.1 Residential
- 5.2.2 Commercial & Industrial
- 5.3 By Customer/Payor Type
- 5.3.1 Insurance-funded Restoration Work
- 5.3.2 Self-funded / Direct-pay Restoration Work
- 5.3.3 Public-sector / Government-funded Restoration Work
6 COMPETITIVE LANDSCAPE
- 6.1 Market Concentration
- 6.2 Strategic Moves
- 6.3 Market Share Analysis
- 6.4 Company Profiles (includes Global Level Overview, Market Level Overview, Core Segments, Financials as available, Strategic Information, Products and Services, Recent Developments)
- 6.4.1 SERVPRO Industries, LLC
- 6.4.2 BELFOR Holdings Inc.
- 6.4.3 ServiceMaster Restore
- 6.4.4 ATI Restoration
- 6.4.5 Paul Davis Restoration, Inc.
- 6.4.6 First Onsite Property Restoration
- 6.4.7 Blackmon Mooring and BMS CAT
- 6.4.8 Rainbow Restoration
- 6.4.9 PuroClean
- 6.4.10 DKI Services
- 6.4.11 BluSky Restoration Contractors
- 6.4.12 Kustom US
- 6.4.13 Cotton Global Disaster Solutions
- 6.4.14 Signal Restoration Services
- 6.4.15 Steamatic Inc.
- 6.4.16 Restoration 1
- 6.4.17 Rytech Restoration
- 6.4.18 FRSTeam
- 6.4.19 Bio-One Inc.
- 6.4.20 United Water Restoration Group
- 6.4.21 Polygon Group
7 MARKET OPPORTUNITIES AND FUTURE OUTLOOK
- 7.1 White-Space & Unmet-Need Assessment
- 7.1.1 Underserved Geographic and Customer Markets
- 7.1.2 Rapid-Response and Catastrophe Capacity
- 7.1.3 Underinsured Customer Restoration
- 7.1.4 Commercial Pre-Loss and Business-Continuity Services
- 7.1.5 Preventive and Subscription-Based Restoration
- 7.2 Future Outlook
- 7.2.1 Market Consolidation and Platform Expansion
- 7.2.2 Digital and Insurance-Integrated Restoration
- 7.2.3 Climate-Adapted Restoration Services
- 7.2.4 Full-Service Restoration and Reconstruction
- 7.2.5 Predictive Monitoring and Remote Assessment
- 7.2.6 Sustainable Restoration Practices

 地震預警裝置市場:全球市場預測,2026-2032年
 2026年全球備份與災害復原解決方案市場報告
 亞太地區災害復原服務:市場佔有率分析、產業趨勢與統計及成長預測(2026-2031 年)北美災害復原服務:市場佔有率分析、產業趨勢與統計及成長預測(2026-2031 年)歐洲災害復原服務:市場佔有率分析、產業趨勢與統計及成長預測(2026-2031 年)
 全球危機管理軟體市場(2026-2030 年)緊急和災害應變:市場佔有率分析、行業趨勢和統計數據、成長預測(2026-2031 年)災害應變系統市場-2026-2032年全球市場預測
 災害應變系統市場:按類型、解決方案、服務、通訊技術、最終用途、國家和地區分類-全球產業分析、市場規模、市場佔有率和預測(2026-2033 年)
 銀行收費服務市場:市場規模、佔有率和趨勢分析(按服務、通路、最終用途和地區分類),細分市場預測(2026-2033 年)