


 |
市場調查報告書
商品編碼
2155610
亞太地區光收發器:市佔率分析、產業趨勢與統計及成長預測(2026-2031)Asia-Pacific Optical Transponder - Market Share Analysis, Industry Trends & Statistics, Growth Forecasts (2026 - 2031) |
||||||

※ 本網頁內容可能與最新版本有所差異。詳細情況請與我們聯繫。
根據 Mordor Intelligence 預測,亞太地區光轉發器市場規模預計在 2025 年達到 27.1 億美元,2026 年達到 29.9 億美元,2031 年達到 49.4 億美元,2026 年至 2031 年的複合年成長率為 10.56%。
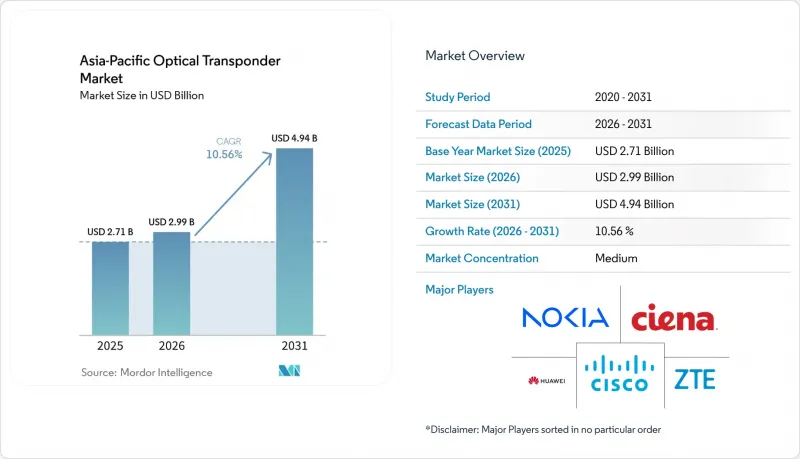
亞太地區光轉發器市場趨勢及洞察。
超大規模資料中心業者人工智慧流量和不斷擴展的資料中心間互連
人工智慧訓練和推理工作負載需要位於不同地點的GPU叢集之間具有可預測的低延遲頻寬。這項需求使得光纖傳輸成為運算環境不可或缺的一部分,而非獨立的回程傳輸層。因此,超大規模資料中心業者正在增加對WDM轉發器的直接採購,並建立自身的資料中心互連容量。諾基亞表示,其800G ZR和ZR+插件模組正透過多方協定和互通性規範獲得廣泛支持,從而能夠應用於人工智慧規模的連接。亞太地區的光轉發器市場正受到這項轉變的影響,因為電信業者不再是唯一決定增加容量的買家。阿里巴巴、騰訊和位元組跳動等公司已在中國和新加坡的線路上參與了這項採購轉變。
高密度 5G回程傳輸和光骨幹網路升級
從微波回程傳輸傳到光纖傳輸的轉變,使得接取網路和匯聚網光纖通訊設備的需求持續成長。獨立組網(SA)5G部署需要比非獨立組網(NSA)更高的吞吐量和更低的延遲。都市區的高密度小型基地台網路需要高容量連貫解決方案,包括400G和800G設備。同時,農村和郊區的部署仍然需要100G及以下速率的設備來滿足足夠的用戶需求。印度的「BharatNet」計畫和馬來西亞的光纖塔計畫正在支援這些低速率需求。 NTT Docomo已於2025年完成了全國範圍內的100G連貫回程傳輸部署,並正在試點用於未來擴增實境(XR)服務的800G ZR+光學模組,這表明行動網路需求可能會超過用戶趨勢。
二級電信業者凍結資本支出並調整庫存。
電信業者參與光纖網路升級的程度因地區而異。東南亞、太平洋島嶼市場、韓國和台灣的二線和三線業者面臨債務壓力、用戶收入成長乏力以及2022-2024年採購週期內累積的庫存。這些業者通常會延後新設備的採購,繼續使用現有設備。由於5G投資持續進行,他們難以承擔升級到800G的成本。中國主要營運商也將部分支出轉向人工智慧運算基礎設施,從而降低了對傳統WDM設備的短期需求。這種投資不平衡可能導致設備訂單放緩,即使雲端運算和人工智慧相關需求依然強勁。
細分市場分析
到2025年,連貫傳輸將佔亞太地區光轉發器市場81.67%的銷售額,成為該市場的主導技術。這主要歸功於長距離通訊、高容量以及營運商骨幹網路和資料中心連接中現有光纖更有效率利用的需求不斷成長。預計到2031年,相干傳輸將以11.08%的複合年成長率成長,這意味著插入式ZR和ZR+模組正在更廣泛的城域網路和資料中心應用場景中取代直接偵測設備。隨著數位訊號處理(DSP)成本的下降,連貫技術的部署範圍正從傳統的長距離網路擴展到短距離鏈路,而營運商先前更注重短距離鏈路的設備成本。在 OFC 2026 上,一項使用 800G-OpenROADM、800-ZR 和 800GBASE-2xFR4 規範的 1,602 公里多廠商 800G 演示證實,可互通的連貫傳輸已準備好投入運作。
非連貫設備仍然用於資料中心的短距離連接以及一些城域存取部署中,在這些部署中,覆蓋範圍限制和低成本仍然是關鍵因素。雖然這些部署仍然推動著需求,尤其是在容量需求較低的情況下,但隨著連貫可插拔設備越來越適用於更廣泛的100G級城域應用,它們的應用範圍正在縮小。 2026年3月,諾基亞發布了針對特定連貫最佳化的相干解決方案,該方案採用了新型DSP和光子前端,這表明供應商的研發重點正在從非連貫技術的創新轉向連貫性能。 2025年3月,NEC憑藉其支援解耦式光轉發器和開放式光部署模型的網路作業系統,獲得了電信基礎設施專案(TIP)的「鳳凰金徽章」。隨著營運商圍繞這項技術進行容量升級的標準化,未能建立可靠的連貫DSP供應鏈的供應商將處於劣勢。
上文提到的100 Gbps至400 Gbps頻段將在2025年佔總收入的47.29%,並將繼續在電信業者使用光纖線路和老一代連貫終端的骨幹網和資料中心互連升級項目中發揮重要作用。 2026年,此頻寬的大部分需求將來自現有網路的升級和容量提升,但隨著超大規模資料中心業者企業建構園區級人工智慧互連,預計到2031年,800 Gbps以上的細分市場將以13.43%的複合年成長率成長。 2026年3月,Ciena在沃達豐Idea的印度國內傳輸網路中部署了WaveLogic 6 Extreme,在單一連貫光通道上實現了1.6 Tb/s的傳輸速率。這表明Terabit特級波長正在被引入運作網路。超大規模資料中心業者對800G ZR和ZR+插件模組的採購正在推動這個高容量類別的發展。這是因為分散式GPU叢集需要高密度、低延遲的鏈路,並且能夠跨多個資料中心進行擴展。因此,亞太地區的光轉發器市場正面臨兩難:一方面是龐大的400G部署基礎,另一方面是對能夠處理800G及以上速度的平台的快速成長的需求。
上文提到的 400 Gbps 至 800 Gbps 速率類別支援多速率策略,使營運商能夠在不立即更換整個終端基礎設施的情況下增加容量。最高 100 Gbps 速率類別在農村回程傳輸、公共寬頻網路和 BharatNet 相關基礎設施中仍然發揮著重要作用,在這些領域,10G 和 100G 鏈路仍然佔據著重要地位。隨著技術的成熟,供應商之間的競爭日益激烈,儘管營運商和企業網路的出貨量保持穩定,但 400G 的價格仍面臨壓力。 Marvell 發布了採用 2nm 製程的 800G ZR/ZR+連貫DSP 平台和 1.6T ZR/ZR+ 插件模組“COLORZ 1600”,表明透過插件光學模組提供的容量將持續成長。隨著這些平台的上市,遷移決策可能會加快,從而縮短供應商必須依賴成熟的 400G 等級的時間。
其他好處:
- Excel格式的市場預測(ME)表
- 3個月的分析師支持
目錄
第1章:引言
- 研究假設和市場定義
- 調查範圍
第2章:調查方法
第3章執行摘要
第4章 市場狀況
- 市場概覽
- 市場促進因素
- 超大規模資料中心業者人工智慧流量和不斷擴展的資料中心間互連
- 更高密度的5G回程傳輸和光纖骨幹網路升級
- 政府主導對寬頻和數位基礎設施的投資
- 採用容量為 400ZR、800G 以上的連貫光子技術。
- 新加坡主導的低延遲區域資料中心互聯
- 採購開放式分散式轉發器和光網路系統
- 市場限制因素
- 二級電信業者的資本投資凍結和庫存調整
- 對先進連貫訊號處理器和光子元件的出口限制
- 高濃度磷化銦外延和先進節點DSP的供應狀況
- 多廠商整合、認證和現場工程方面的挑戰。
- 產業價值鏈分析
- 監理情勢
- 波特五力分析
- 宏觀經濟因素對市場的影響
第5章 市場規模與成長預測
- 透過傳輸技術
- 連貫
- 非連貫
- 按數據速率
- 最高可達 100 Gbps
- 超過 100 Gbps 至 400 Gbps
- 超過 400 Gbps 至 800 Gbps
- 800 Gbps 或更高
- 透過網路應用
- 捷運
- 長途
- 資料中心之間的互連
- 海底
- 其他網路應用
- 最終用戶
- 電信服務供應商
- 雲端和超大規模資料中心營運商
- 公司
- 政府/國防
- 其他最終用戶
- 國家
- 中國
- 日本
- 印度
- 韓國
- 澳洲和紐西蘭
- 其他亞太國家
第6章 競爭情勢
- 市場集中度
- 策略趨勢
- 市佔率分析
- 公司簡介
- Huawei Technologies Co., Ltd.
- Nokia Corporation
- ZTE Corporation
- Ciena Corporation
- Fujitsu Limited
- Cisco Systems, Inc.
- NEC Corporation
- FiberHome Telecommunication Technologies Co., Ltd.
- Ribbon Communications Inc.
- Tejas Networks Limited
- Sterlite Technologies Limited
- Lumentum Holdings Inc.
- Coherent Corp.
- Accelink Technologies Co., Ltd.
- Sumitomo Electric Industries, Ltd.
- Marvell Technology, Inc.
- Broadcom Inc.
- O-NET Technologies Group Co., Ltd.
第7章 市場機會與未來展望
According to Mordor Intelligence, the Asia-Pacific optical transponder market size is projected to be USD 2.71 billion in 2025, USD 2.99 billion in 2026, and reach USD 4.94 billion by 2031, growing at a CAGR of 10.56% from 2026 to 2031.
Asia-Pacific Optical Transponder Market Trends and Insights
Hyperscaler AI Traffic and Data Center Interconnect Expansion
AI training and inference workloads require predictable, low-latency bandwidth between GPU clusters in separate locations. This requirement makes optical transport part of the computing environment rather than a separate backhaul layer. Hyperscalers are therefore increasing direct purchases of WDM transponders and building their own data center interconnect capacity. Nokia states that 800G ZR and ZR+ pluggables have broad support through multi-source agreements and interoperability specifications, supporting their use in AI-scale connectivity. The Asia-Pacific optical transponder market is affected by this change because carriers are no longer the only buyers who determine capacity additions. Alibaba, Tencent, and ByteDance are already linked to this procurement shift on China and Singapore routes.
5G Backhaul Densification and Fiber Backbone Upgrades
The move from microwave backhaul toward fiber transport creates recurring demand for optical equipment in access and aggregation networks. Standalone 5G deployments need higher throughput and lower latency than non-standalone networks. Dense urban small-cell networks require higher-capacity coherent solutions, including 400G and 800G equipment. Rural and suburban programs still need 100G and lower-speed equipment to preserve meaningful unit demand. India's BharatNet program and Malaysia's tower fiberization work support that lower-speed requirement. NTT DOCOMO completed a nationwide 100G coherent backhaul rollout in 2025 and is trialing 800G ZR+ optics for future extended-reality services, demonstrating how mobile network requirements can outpace subscriber trends.
Tier-2 Carrier Capital Expenditure Freezes and Inventory Corrections
Carrier participation in the optical upgrade cycle varies widely across the region. Tier-2 and Tier-3 carriers in Southeast Asia, Pacific island markets, South Korea, and Taiwan face debt pressure, weaker subscriber revenue, and inventory accumulated during the 2022-2024 procurement cycle. These operators often defer new purchases and continue using installed equipment. The cost of 800G upgrades can be difficult to absorb while 5G commitments remain in place. China's larger carriers have also shifted part of their spending toward AI computing infrastructure, reducing near-term demand for traditional WDM equipment. This uneven capital spending can slow equipment orders even when cloud and AI-related demand remains strong.
Other drivers and restraints analyzed in the detailed report include:
- Government-Backed Broadband and Digital Infrastructure Investment
- Adoption of 400ZR, 800G, and Higher-Capacity Coherent Optics
- Export Controls on Advanced Coherent DSPs and Photonic Components
For complete list of drivers and restraints, kindly check the Table Of Contents.
Segment Analysis
Coherent transmission accounted for 81.67% of revenue in 2025, making it the dominant technology in the Asia-Pacific optical transponder market, as carrier backbones and data center interconnects increasingly require long reach, high capacity, and more efficient use of installed fiber. It is projected to expand at an 11.08% CAGR through 2031, indicating that pluggable ZR and ZR+ modules are replacing direct-detect equipment across a wider set of metro and data center use cases. Lower DSP costs have extended coherent deployment beyond traditional long-haul networks and into shorter links where operators previously placed greater weight on equipment cost. The 1,602 km multi-vendor 800G demonstration at OFC 2026 using 800G-OpenROADM, 800-ZR, and 800GBASE-2xFR4 specifications supports the operational readiness of interoperable coherent transmission.
Non-coherent equipment continues to serve short intra-data-center connections and selected metro access deployments where limited reach and lower cost remain important. These installations still drive demand, particularly where capacity requirements are lower, but their addressable scope is narrowing as coherent pluggables become suitable for more 100G-class metro applications. Nokia introduced application-optimized coherent solutions in March 2026, featuring new DSPs and photonic front-ends, indicating that supplier development work is focused on coherent performance rather than renewed non-coherent innovation. NEC received the Telecom Infra Project Phoenix Gold Badge in March 2025 for a network operating system that supports disaggregated optical transponders and open optical deployment models. Vendors that lack reliable, coherent DSP relationships face a weaker position as operators standardize their capacity upgrades around this technology.
The above 100 Gbps to 400 Gbps band accounted for 47.29% of revenue in 2025 and remains important for carrier backbone and data center interconnect upgrade programs that use fiber routes equipped with earlier generations of coherent terminals. Much of the band's 2026 demand comes from replacement and capacity upgrades on existing networks, while the above 800 Gbps segment is projected to expand at a 13.43% CAGR through 2031 as hyperscalers build campus-scale AI interconnects. Ciena deployed WaveLogic 6 Extreme on Vodafone Idea's India transport network in March 2026 and achieved 1.6 Tb/s on one coherent optical channel, demonstrating that terabit-class wavelengths are moving into operational networks. Hyperscaler purchases of 800G ZR and ZR+ pluggables support this higher-capacity category because distributed GPU clusters require dense, low-latency links that can be expanded across separate data center locations. The Asia-Pacific optical transponder market is consequently balancing a large installed base of 400G with rapid demand for platforms that can support 800G and higher rates.
The above 400 Gbps to 800 Gbps category supports multi-rate strategies, allowing operators to add capacity without immediately replacing their entire terminal base. The up to 100 Gbps category remains relevant for rural backhaul, public broadband networks, and BharatNet-related infrastructure, where 10G and 100G links still have a defined role. Greater supplier competition is putting pressure on 400G pricing as the technology becomes established, even as shipment volumes remain meaningful across carrier and enterprise networks. Marvell introduced a 2nm 800G ZR/ZR+ coherent DSP platform and COLORZ 1600, a 1.6T ZR/ZR+ pluggable, which indicates a continuing rise in the capacity available through pluggable optics. As these platforms become available, migration decisions could occur sooner, reducing the time equipment vendors have to rely on the mature 400G tier.
Complete Report Scope:
- By Transmission Technology
- Coherent
- Non-Coherent
- By Data Rate
- Up to 100 Gbps
- Above 100 Gbps to 400 Gbps
- Above 400 Gbps to 800 Gbps
- Above 800 Gbps
- By Network Application
- Metro
- Long-Haul
- Data Center Interconnect
- Submarine
- Other Network Applications
- By End-User
- Telecommunication Service Providers
- Cloud and Hyperscale Data Center Operators
- Enterprises
- Government and Defense
- Other End-Users
- By Country
- China
- Japan
- India
- South Korea
- Australia and New Zealand
- Rest of Asia-Pacific
List of Companies Covered in this Report:
- Huawei Technologies Co., Ltd.
- Nokia Corporation
- ZTE Corporation
- Ciena Corporation
- Fujitsu Limited
- Cisco Systems, Inc.
- NEC Corporation
- FiberHome Telecommunication Technologies Co., Ltd.
- Ribbon Communications Inc.
- Tejas Networks Limited
- Sterlite Technologies Limited
- Lumentum Holdings Inc.
- Coherent Corp.
- Accelink Technologies Co., Ltd.
- Sumitomo Electric Industries, Ltd.
- Marvell Technology, Inc.
- Broadcom Inc.
- O-NET Technologies Group Co., Ltd.
Additional Benefits:
- The market estimate (ME) sheet in Excel format
- 3 months of analyst support
TABLE OF CONTENTS
1 INTRODUCTION
- 1.1 Study Assumptions and Market Definition
- 1.2 Scope of the Study
2 RESEARCH METHODOLOGY
3 EXECUTIVE SUMMARY
4 MARKET LANDSCAPE
- 4.1 Market Overview
- 4.2 Market Drivers
- 4.2.1 Hyperscaler AI Traffic and Data-Center Interconnect Expansion
- 4.2.2 5G Backhaul Densification and Fiber Backbone Upgrades
- 4.2.3 Government-Backed Broadband and Digital Infrastructure Investment
- 4.2.4 Adoption of 400ZR, 800G, and Higher-Capacity Coherent Optics
- 4.2.5 Singapore-Led Low-Latency Regional Data-Center Interconnection
- 4.2.6 Open, Disaggregated Transponder and Optical Line-System Procurement
- 4.3 Market Restraints
- 4.3.1 Tier-2 Carrier Capital-Expenditure Freezes and Inventory Corrections
- 4.3.2 Export Controls on Advanced Coherent DSPs and Photonic Components
- 4.3.3 Concentrated Indium Phosphide Epitaxy and Advanced-Node DSP Supply
- 4.3.4 Multi-Vendor Integration, Certification, and Field-Engineering Gaps
- 4.4 Industry Value Chain Analysis
- 4.5 Regulatory Landscape
- 4.6 Porter's Five Forces Analysis
- 4.6.1 Threat of New Entrants
- 4.6.2 Bargaining Power of Suppliers
- 4.6.3 Bargaining Power of Buyers
- 4.6.4 Threat of Substitutes
- 4.6.5 Competitive Rivalry
- 4.7 Impact of Macroeconomic Factors on the Market
5 MARKET SIZE AND GROWTH FORECASTS (VALUE)
- 5.1 By Transmission Technology
- 5.1.1 Coherent
- 5.1.2 Non-Coherent
- 5.2 By Data Rate
- 5.2.1 Up to 100 Gbps
- 5.2.2 Above 100 Gbps to 400 Gbps
- 5.2.3 Above 400 Gbps to 800 Gbps
- 5.2.4 Above 800 Gbps
- 5.3 By Network Application
- 5.3.1 Metro
- 5.3.2 Long-Haul
- 5.3.3 Data Center Interconnect
- 5.3.4 Submarine
- 5.3.5 Other Network Applications
- 5.4 By End-User
- 5.4.1 Telecommunication Service Providers
- 5.4.2 Cloud and Hyperscale Data Center Operators
- 5.4.3 Enterprises
- 5.4.4 Government and Defense
- 5.4.5 Other End-Users
- 5.5 By Country
- 5.5.1 China
- 5.5.2 Japan
- 5.5.3 India
- 5.5.4 South Korea
- 5.5.5 Australia and New Zealand
- 5.5.6 Rest of Asia-Pacific
6 COMPETITIVE LANDSCAPE
- 6.1 Market Concentration
- 6.2 Strategic Moves
- 6.3 Market Share Analysis
- 6.4 Company Profiles (includes Global Level Overview, Market Level Overview, Core Segments, Financials as available, Strategic Information, Market Rank/Share, Products and Services, Recent Developments)
- 6.4.1 Huawei Technologies Co., Ltd.
- 6.4.2 Nokia Corporation
- 6.4.3 ZTE Corporation
- 6.4.4 Ciena Corporation
- 6.4.5 Fujitsu Limited
- 6.4.6 Cisco Systems, Inc.
- 6.4.7 NEC Corporation
- 6.4.8 FiberHome Telecommunication Technologies Co., Ltd.
- 6.4.9 Ribbon Communications Inc.
- 6.4.10 Tejas Networks Limited
- 6.4.11 Sterlite Technologies Limited
- 6.4.12 Lumentum Holdings Inc.
- 6.4.13 Coherent Corp.
- 6.4.14 Accelink Technologies Co., Ltd.
- 6.4.15 Sumitomo Electric Industries, Ltd.
- 6.4.16 Marvell Technology, Inc.
- 6.4.17 Broadcom Inc.
- 6.4.18 O-NET Technologies Group Co., Ltd.
7 MARKET OPPORTUNITIES AND FUTURE OUTLOOK
- 7.1 White-Space and Unmet-Need Assessment

 衛星轉頻器市場規模、佔有率、成長、全球產業分析、區域趨勢及2026年至2034年預測
 Ku波段衛星轉發器市場規模、佔有率和成長分析:按應用程式類型、服務概況、最終用戶產業和地區分類-2026-2033年產業預測
 光收發器:市場佔有率分析、產業趨勢與統計、成長預測(2026-2031)北美光轉發器市場:市場佔有率分析、產業趨勢與統計及成長預測(2026-2031 年)歐洲光轉發器:市場佔有率分析、行業趨勢和統計數據以及成長預測(2026-2031 年)南美洲光轉發器:市場佔有率分析、產業趨勢與統計及成長預測(2026-2031 年)
 衛星轉發器租賃市場分析與預測(至2035年):類型、產品類型、服務、技術、組件、應用、部署狀態、最終用戶、解決方案
 2026年全球衛星轉發器市場報告
 衛星轉發器市場規模、佔有率和成長分析(按轉發器類型、放大器類型、服務、頻寬、頻率和地區分類)—產業預測(2026-2033 年)
 衛星轉發器市場規模、佔有率、趨勢分析報告:按頻段、服務、衛星平台、應用、地區和細分市場預測,2025 年至 2033 年