


 |
市場調查報告書
商品編碼
2154976
北美5G技術:市場佔有率分析、產業趨勢與統計及成長預測(2026-2031年)North America 5G Technology - Market Share Analysis, Industry Trends & Statistics, Growth Forecasts (2026 - 2031) |
||||||

※ 本網頁內容可能與最新版本有所差異。詳細情況請與我們聯繫。
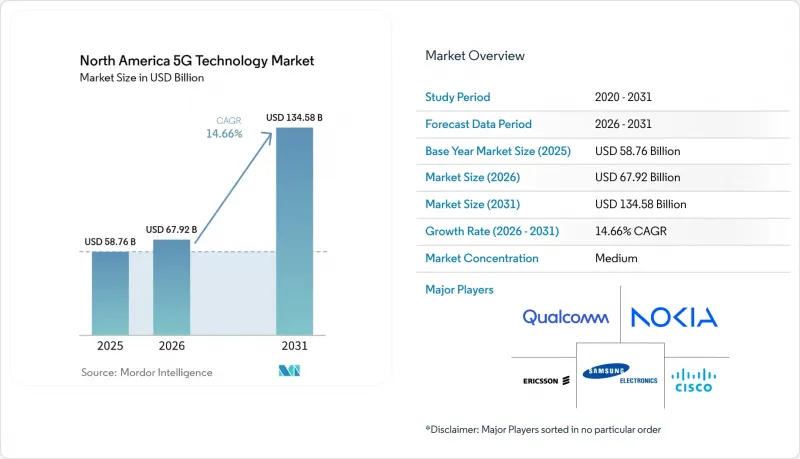
根據 Mordor Intelligence 預測,北美 5G 技術市場規模預計將在 2025 年達到 587.6 億美元,2026 年達到 679.2 億美元,到 2031 年達到 1345.8 億美元,2026 年至 2031 年的複合年成長率為 14.66%。
北美5G技術市場趨勢與洞察
城市中心和企業園區對更高網路密度的需求日益成長。
隨著營運商在大都會圈完成中頻段覆蓋,提高網路密度仍然是關鍵的投資重點。根據無線基礎設施協會 (WIA) 預測,美國室內小型基地台基地台的數量預計將從 2024 年的 802,500 個增加到 2025 年的 830,350 個。這些舉措將支援分散式天線系統 (DAS)、專用 CBRS 網路,並確保場館、醫院和辦公室等場所的室內覆蓋。 T-Mobile 營運超過 85,000 個宏基地台和 57,000 個小型基地台,其 2.5 GHz 頻段的單站覆蓋範圍比競爭對手的 C 頻段部署高出近 70%。因此,北美 5G 技術市場在室內和園區服務方面擁有更廣泛的基礎。此外,引入中立託管方案將使建築物業主在選擇和資金籌措室內連接方面擁有更大的發言權。
固定無線存取作為光纖的替代方案正在迅速發展。
在美國,固定無線存取在住宅寬頻服務中正日益普及。 T-Mobile 預計到 2025 年底將擁有 850 萬固定無線用戶,並將 2030 年的目標提高到 1,500 萬。這一目標的實現得益於頻寬效率的提升、更廣泛的用戶終端設備 (CPE) 選擇以及企業服務的推出。獨立組網 (SA) 允許透過基於策略的容量分配來分離固定無線流量和移動流量。這可以緩解網路擁塞壓力,並支援根據通訊速度提供服務套餐。愛立信在 2025 年 6 月發布的報告顯示,超過 51% 的提供固定無線存取的通訊服務供應商已實施基於速度的套餐計劃,高於一年前的 40%。因此,在北美 5G 技術市場,固定無線存取不僅可以被視為低成本的替代方案,更可以被視為具有差異化效能的寬頻服務。
高頻段的取得與部署成本
頻段成本持續限制區域業者的投資能力。 2025年8月,AT&T同意斥資230億美元收購EchoStar公司在美國400多個市場的頻段牌照。這些牌照涵蓋覆蓋全美的頻寬和頻寬頻段,可用於支援未來的網路覆蓋和容量擴展。美國國會研究服務處(CRS)指出,聯邦法律119-21(PL 119-21)指示聯邦通訊委員會(FCC)競標300兆赫的頻段。該法律可能引入額外的競標週期,並給營運商的資本預算帶來壓力。墨西哥也面臨頻寬分配有限以及法律規範變化的問題。這些因素導致北美5G技術市場資本分佈不均。
細分市場分析
2025年,硬體佔組件銷售額的44.85%。北美5G技術市場的這一佔有率反映了對基地台、小型基地台和無線接取網路(RAN)升級的集中投資。大規模MIMO天線單元、基頻模組和站點設備全部區域覆蓋區域的初步部署提供了支援。隨著營運商部署開放式RAN工具、網路切片平台和RAN管理應用程式,軟體的採用率正在不斷提高。 2025年,以硬體為中心的採購模式仍限制軟體銷售。三星在2026年1月舉行的商用vRAN電話會議上展示了雲端原生軟體可以在單一標準伺服器上運作。這種方法減少了對專用基頻硬體的需求,並提高了營運商在選擇基礎設施供應商方面的柔軟性。隨著覆蓋範圍和容量投資的增加,北美5G技術市場對硬體的需求仍然很高。
預計2026年至2031年,服務市場將以17.10%的複合年成長率成長。服務領域受益於託管網路、私有部署支援和雲端協作訂閱。企業合約擴大將設計、整合、營運和效能管理相結合。 2026年3月,愛立信和Future Technologies擴大了合作夥伴關係,以支援能源、製造、交通和物流行業的企業無線部署。這些經營模式產生的是經常性業務收益,而非一次性設備銷售收入。獨立的網路切片也支援基於特定服務品質(QoS)的合約。這可能會加強專業服務服務和託管服務在營運商和企業採購中的作用。隨著虛擬化網路的日益普及,軟體和服務可能會佔據更大的價值佔有率。
至2025年,6GHz以下頻段將佔頻段營收的56.35%。此頻段營收佔有率主要得益於美國、加拿大和墨西哥各地C頻段和2.5GHz頻段的部署。中頻段在廣域網路中實現了覆蓋範圍和容量的合理平衡。 AT&T與EchoStar達成的協議,透過在3.45GHz和600MHz頻段上進行全國性授權,正在推動這一趨勢。 Verizon在都市區部署中採用C頻段也凸顯了中頻段容量的重要性。毫米波(mmWave)在人口密集地區、中央商務區和大規模企業場所仍然發揮著重要作用。然而,其有限的傳播特性降低了其作為廣域覆蓋層的有效性。 RedCap裝置比功能齊全的數據機功耗更低,因此可以在感測器和穿戴式裝置中更廣泛地使用6GHz以下頻段。這些情況確保了 6 GHz 以下頻段繼續作為區域部署的核心頻段。
混合配置預計將在2026年至2031年間以17.65%的複合年成長率成長。這種配置結合了覆蓋範圍廣的Sub-6 GHz頻段和毫米波頻段,以滿足更高吞吐量的需求。這種方法允許營運商根據位置和流量情況,靈活運用各個頻段,從而最大限度地發揮其性能。 3GPP R17和R18版本中改良的載波聚合功能支援跨頻寬使用多個組成載波。 5G Americas將持續的頻段演進和先進的功能列為其5G藍圖的關鍵要素。混合網路可以提升都市區、場館和校園等混合環境中的效能。此外,營運商還可以在不取代寬頻頻寬層的情況下增加局部容量。終端相容性仍然至關重要,因為客戶需要相容的無線電設備和天線。在北美5G技術市場,利用混合頻寬規劃可以根據當地的流量狀況調整投資。
其他好處:
- Excel格式的市場預測(ME)表
- 3個月的分析師支持
目錄
第1章:引言
- 研究假設和市場定義
- 調查範圍
第2章:調查方法
第3章執行摘要
第4章 市場狀況
- 市場概覽
- 市場促進因素
- 城市中心和企業園區對更高網路密度的需求日益成長。
- 固定無線存取作為光纖的替代方案正在迅速發展。
- 在製造業、物流業和能源業部署私有5G網路
- 一級電信業者對雲端原生核心網路和開放式無線接取網路進行現代化改造
- 工業自動化和聯網汽車。
- 為公共和國防部門提供網路更新,以支援安全的 5G 部署
- 市場限制因素
- 取得和實施高頻率的成本
- 農村和低人口密度市場貨幣化進程的延遲
- 高密度小型基地台部署中對電力消耗和安裝空間的限制
- 設備和生態系統在頻段、標準和用例方面的碎片化。
- 5G的歷史沿革與發展
- 目前引進週期(先行者、採用者、後入者)
- 產業價值鏈分析
- 監理情勢和政策趨勢
- 技術展望
- 波特五力分析
- 5G及未來5G(通往6G之路)
- 宏觀經濟因素對市場的影響
第5章 市場規模與成長預測
- 按組件
- 硬體
- 軟體
- 服務
- 按頻段
- 6GHz以下頻段
- 毫米波
- 混合型(低於 6 GHz 和毫米波)
- 透過使用
- 增強型行動寬頻(eMBB)
- 固定無線接入(FWA)
- 大規模機器類型通訊(mMTC)
- 超高可靠性、低延遲通訊(URLLC)
- 按最終用戶行業分類
- 消費者
- 製造業
- 衛生保健
- 車
- 能源公用事業
- 媒體與娛樂
- 公共安全與國防
- 透過網路架構
- 獨立版 (SA)
- 非獨立式(NSA)
- 國家
- 美國
- 加拿大
- 墨西哥
第6章 競爭情勢
- 市場集中度
- 策略趨勢
- 市佔率分析
- 公司簡介
- Telefonaktiebolaget LM Ericsson(Ericsson)
- Nokia Corporation
- Qualcomm Incorporated
- Samsung Electronics Co., Ltd.
- Cisco Systems, Inc.
- Intel Corporation
- Apple Inc.
- CommScope Holding Company, Inc.
- Juniper Networks, Inc.
- Mavenir plc
- Parallel Wireless Inc.
- MediaTek Inc.
- Skyworks Solutions, Inc.
- Analog Devices, Inc.
- NEC Corporation
- Fujitsu Limited
- Marvell Technology, Inc.
- NVIDIA Corporation
第7章 市場機會與未來展望
According to Mordor Intelligence, the North America 5G technology market size is projected to be USD 58.76 billion in 2025, USD 67.92 billion in 2026, and reach USD 134.58 billion by 2031, growing at a CAGR of 14.66% from 2026 to 2031.
North America 5G Technology Market Trends and Insights
Rising Network Densification Needs Across Urban Cores and Enterprise Campuses
Network densification remains a major capital priority as operators complete mid-band coverage in large cities. The Wireless Infrastructure Association reported 830,350 indoor small-cell nodes in the United States in 2025, up from 802,500 in 2024. This work supports distributed antenna systems, private CBRS networks, and in-building coverage at venues, hospitals, and offices. T-Mobile operates more than 85,000 macro sites and 57,000 small cells, and its 2.5 GHz spectrum covers nearly 70% more area per site than competing C-band deployments. The North America 5G technology market, therefore, has a broader base for indoor and campus services. Neutral-host deployments can also give building owners a larger role in selecting and funding indoor connectivity.
Fast Expansion of Fixed Wireless Access as a Fiber Alternative
Fixed wireless access is becoming a more established part of residential broadband delivery in the United States. T-Mobile ended 2025 with 8.5 million fixed wireless subscribers and raised its 2030 target to 15 million. Improved spectrum efficiency, additional customer-premises equipment options, and business eligibility support that target. Standalone networks can separate fixed wireless traffic from mobile traffic through policy-based capacity allocation. This can reduce congestion pressure and support speed-based service plans. Ericsson reported in June 2025 that more than 51% of communications service providers offering fixed wireless access had speed-based plans, compared with 40% 1 year earlier. The North America 5G technology market can therefore position fixed wireless as a broadband service with differentiated performance rather than solely as a lower-cost alternative.
High Spectrum Acquisition and Deployment Costs
Spectrum costs continue to constrain the investment capacity of regional operators. AT&T agreed in August 2025 to acquire EchoStar spectrum licenses for USD 23 billion across more than 400 United States markets. The licenses include nationwide low-band and mid-band spectrum that can support future coverage and capacity expansion. The Congressional Research Service stated that P.L. 119-21 directs the Federal Communications Commission to auction 300 MHz of spectrum. The legislation introduces an additional auction cycle that can put pressure on operators' capital budgets. Mexico also faces a smaller assigned spectrum base and a changing regulatory structure. These conditions make capital availability uneven across the North America 5G technology market.
Other drivers and restraints analyzed in the detailed report include:
- Private 5G Adoption in Manufacturing, Logistics, and Energy Operations
- Cloud-Native Core and Open RAN Modernization by Tier-1 Operators
- Slow Monetization in Rural and Low-Density Markets
For complete list of drivers and restraints, kindly check the Table Of Contents.
Segment Analysis
Hardware accounted for 44.85% of component revenue in 2025. This North America 5G technology market share reflected intensive spending on base stations, small cells, and radio access network upgrades. Massive MIMO antenna units, baseband modules, and site equipment supported the initial coverage buildout across the region. Software adoption is rising as operators introduce Open RAN tools, network slicing platforms, and RAN management applications. Hardware-centered purchasing models still constrained software revenue during 2025. Samsung's January 2026 commercial vRAN call showed that cloud-native software can run on a single standard server. This approach can reduce the need for proprietary baseband hardware. It also gives operators greater flexibility when selecting infrastructure suppliers. The North America 5G technology market continues to require substantial hardware as coverage and capacity investments proceed.
Services are projected to expand at a 17.10% CAGR from 2026 to 2031. The services segment benefits from managed networks, private deployment support, and cloud orchestration subscriptions. Enterprise contracts increasingly combine design, integration, operations, and performance management. Ericsson and Future Technologies expanded their collaboration in March 2026 to support enterprise wireless deployments in energy, manufacturing, transportation, and logistics. These operating models create recurring service revenue rather than a one-time equipment sale. Standalone network slicing also enables contracts based on specified quality of service. This can strengthen the role of professional and managed services in operator and enterprise procurement. Software and services may capture a larger share of value as virtualized networks become more common.
Sub-6 GHz accounted for 56.35% of the spectrum band revenue in 2025. This spectrum revenue share was anchored by C-band and 2.5 GHz deployments across the United States, Canada, and Mexico. Mid-band spectrum offers a practical balance of coverage and capacity for wide-area networks. AT&T's EchoStar agreement supports that approach through nationwide licenses in the 3.45 GHz and 600 MHz bands. Verizon's use of C-band in metropolitan deployments also shows the importance of mid-band capacity. mmWave remains relevant in dense venues, central business districts, and large enterprise sites. Its propagation limits reduce its effectiveness as a broad-coverage layer. RedCap devices can widen Sub-6 GHz use in sensors and wearables because they use less power than full-capability modems. These conditions retain Sub-6 GHz as the central spectrum tier for regional deployments.
Hybrid configurations are projected to expand at a 17.65% CAGR from 2026 to 2031. They combine broad Sub-6 GHz coverage with mmWave capacity in locations that need higher throughput. The approach lets operators use each band for the locations and traffic profiles where it performs best. Carrier aggregation improvements in 3GPP Releases 17 and 18 support the use of multiple component carriers across frequency ranges. 5G Americas identifies continued spectrum evolution and advanced capabilities as important elements of the regional 5G roadmap. Hybrid networks can improve performance in mixed urban, venue, and campus environments. They also allow operators to add localized capacity without replacing the wider mid-band layer. Device support remains important because customers need compatible radios and antennas. The North America 5G technology market can use hybrid band plans to match investment with local traffic conditions.
Complete Report Scope:
- By Component
- Hardware
- Software
- Services
- By Spectrum Band
- Sub-6 GHz
- mmWave
- Hybrid (Sub-6 GHz and mmWave)
- By Application
- Enhanced Mobile Broadband (eMBB)
- Fixed Wireless Access (FWA)
- Massive Machine-Type Communications (mMTC)
- Ultra-Reliable Low-Latency Communications (URLLC)
- By End-User Industry
- Consumer
- Manufacturing
- Healthcare
- Automotive
- Energy and Utilities
- Media and Entertainment
- Public Safety and Defense
- By Network Architecture
- Stand-Alone (SA)
- Non-Stand-Alone (NSA)
- By Country
- United States
- Canada
- Mexico
List of Companies Covered in this Report:
- Telefonaktiebolaget LM Ericsson (Ericsson)
- Nokia Corporation
- Qualcomm Incorporated
- Samsung Electronics Co., Ltd.
- Cisco Systems, Inc.
- Intel Corporation
- Apple Inc.
- CommScope Holding Company, Inc.
- Juniper Networks, Inc.
- Mavenir plc
- Parallel Wireless Inc.
- MediaTek Inc.
- Skyworks Solutions, Inc.
- Analog Devices, Inc.
- NEC Corporation
- Fujitsu Limited
- Marvell Technology, Inc.
- NVIDIA Corporation
Additional Benefits:
- The market estimate (ME) sheet in Excel format
- 3 months of analyst support
TABLE OF CONTENTS
1 INTRODUCTION
- 1.1 Study Assumptions and Market Definition
- 1.2 Scope of the Study
2 RESEARCH METHODOLOGY
3 EXECUTIVE SUMMARY
4 MARKET LANDSCAPE
- 4.1 Market Overview
- 4.2 Market Drivers
- 4.2.1 Rising Network Densification Needs Across Urban Cores and Enterprise Campuses
- 4.2.2 Fast Expansion of Fixed Wireless Access as a Fiber Alternative
- 4.2.3 Private 5G Adoption in Manufacturing, Logistics, and Energy Operations
- 4.2.4 Cloud-Native Core and Open RAN Modernization by Tier-1 Operators
- 4.2.5 Growing Demand for Ultra-Low Latency in Industrial Automation and Connected Vehicles
- 4.2.6 Public Sector and Defense Network Upgrade Programs Supporting Secure 5G Deployments
- 4.3 Market Restraints
- 4.3.1 High Spectrum Acquisition and Deployment Costs
- 4.3.2 Slow Monetization in Rural and Low-Density Markets
- 4.3.3 Power Consumption and Site Acquisition Constraints for Dense Small-Cell Rollouts
- 4.3.4 Device and Ecosystem Fragmentation Across Bands, Standards, and Use Cases
- 4.4 5G Timeline and Evolution
- 4.5 Current Adoption Cycle (Forerunners, Adopters, and Laggards)
- 4.6 Industry Value Chain Analysis
- 4.7 Regulatory and Policy Landscape
- 4.8 Technological Outlook
- 4.9 Porter's Five Forces Analysis
- 4.9.1 Threat of New Entrants
- 4.9.2 Bargaining Power of Suppliers
- 4.9.3 Bargaining Power of Buyers
- 4.9.4 Threat of Substitutes
- 4.9.5 Competitive Rivalry
- 4.10 5G and Beyond (6G Pathways)
- 4.11 Impact of Macroeconomic Factors on the Market
5 MARKET SIZE AND GROWTH FORECASTS (VALUE)
- 5.1 By Component
- 5.1.1 Hardware
- 5.1.2 Software
- 5.1.3 Services
- 5.2 By Spectrum Band
- 5.2.1 Sub-6 GHz
- 5.2.2 mmWave
- 5.2.3 Hybrid (Sub-6 GHz and mmWave)
- 5.3 By Application
- 5.3.1 Enhanced Mobile Broadband (eMBB)
- 5.3.2 Fixed Wireless Access (FWA)
- 5.3.3 Massive Machine-Type Communications (mMTC)
- 5.3.4 Ultra-Reliable Low-Latency Communications (URLLC)
- 5.4 By End-User Industry
- 5.4.1 Consumer
- 5.4.2 Manufacturing
- 5.4.3 Healthcare
- 5.4.4 Automotive
- 5.4.5 Energy and Utilities
- 5.4.6 Media and Entertainment
- 5.4.7 Public Safety and Defense
- 5.5 By Network Architecture
- 5.5.1 Stand-Alone (SA)
- 5.5.2 Non-Stand-Alone (NSA)
- 5.6 By Country
- 5.6.1 United States
- 5.6.2 Canada
- 5.6.3 Mexico
6 COMPETITIVE LANDSCAPE
- 6.1 Market Concentration
- 6.2 Strategic Moves
- 6.3 Market Share Analysis
- 6.4 Company Profiles (includes Global Level Overview, Market Level Overview, Core Segments, Financials as available, Strategic Information, Market Rank/Share, Products and Services, Recent Developments)
- 6.4.1 Telefonaktiebolaget LM Ericsson (Ericsson)
- 6.4.2 Nokia Corporation
- 6.4.3 Qualcomm Incorporated
- 6.4.4 Samsung Electronics Co., Ltd.
- 6.4.5 Cisco Systems, Inc.
- 6.4.6 Intel Corporation
- 6.4.7 Apple Inc.
- 6.4.8 CommScope Holding Company, Inc.
- 6.4.9 Juniper Networks, Inc.
- 6.4.10 Mavenir plc
- 6.4.11 Parallel Wireless Inc.
- 6.4.12 MediaTek Inc.
- 6.4.13 Skyworks Solutions, Inc.
- 6.4.14 Analog Devices, Inc.
- 6.4.15 NEC Corporation
- 6.4.16 Fujitsu Limited
- 6.4.17 Marvell Technology, Inc.
- 6.4.18 NVIDIA Corporation
7 MARKET OPPORTUNITIES AND FUTURE OUTLOOK
- 7.1 White-Space and Unmet-Need Assessment

 5G波束成形技術市場預測至2034年-全球波束成形類型、組件、天線配置、頻段、應用、最終用戶和區域分析
 亞太地區5G技術:市佔率分析、產業趨勢與統計及成長預測(2026-2031年)非洲5G技術:市場佔有率分析、產業趨勢與統計及成長預測(2026-2031年)南美洲5G技術:市場佔有率分析、產業趨勢與統計及成長預測(2026-2031年)歐洲5G技術:市場佔有率分析、產業趨勢與統計及成長預測(2026-2031年)5G技術:市場佔有率分析、產業趨勢與統計、成長預測(2026-2031年)
 2026年全球5G技術市場報告
 5G技術市場分析及預測(至2035年):按類型、產品類型、服務、技術、組件、應用、部署類型、最終用戶、解決方案和模式分類
 5G技術市場-全球產業規模、佔有率、趨勢、機會及預測(按組件、技術、頻段、應用、地區和競爭格局分類,2021-2031年)
 5G技術市場規模、佔有率和成長分析(按組件、性別、應用和地區分類)—產業預測,2026-2033年