

 |
市場調查報告書
商品編碼
2124581
5G技術:市場佔有率分析、產業趨勢與統計、成長預測(2026-2031年)5G Technology - Market Share Analysis, Industry Trends & Statistics, Growth Forecasts (2026 - 2031) |
||||||

※ 本網頁內容可能與最新版本有所差異。詳細情況請與我們聯繫。
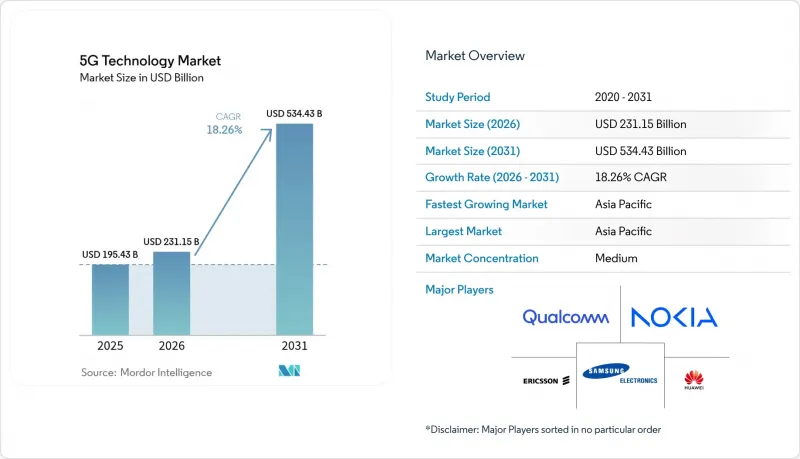
根據 Mordor Intelligence 預測,5G 技術市場將從 2025 年的 1,954.3 億美元成長到 2026 年的 2,311.5 億美元,然後在 2031 年達到 5,344.3 億美元,2026 年至 2031 年的複合成長率為 18.26%。
本報告按組件(硬體、軟體、服務)、頻段(6GHz 以下、毫米波、混合頻段)、應用(eMBB、FWA、MMTC、URLLC)、最終用戶產業(消費、製造等)、網路架構(獨立網路、非獨立網路)和地區進行細分。市場預測以美元計價。
全球5G技術市場趨勢與洞察
連網設備的持續成長
預計到2030年,蜂巢式物聯網連線數將超過59億,這將進一步提升公共網路和專用網路的容量需求。預測性維護和自動化檢測在製造工廠中已廣泛應用,而智慧城市中的交通和環境感測器則推動了數據流量的成長。邊緣運算透過在本地快取時效性強的分析數據,降低了回程傳輸的負載和延遲。在對確定性性能和固有安全性要求極高的危險設施中,專用網路正在取代Wi-Fi。設備的激增推動了數據流量的綜合成長,從而支撐了5G技術市場在無線、傳輸和雲端領域的持續投入。
降低射頻前端和SiGe功率放大器的元件級成本。
從2024年起,矽鍺(SiGe)功率放大器的技術進步預計將使製造成本降低近30%,從而降低中階5G智慧型手機和CPE的價格。先進的多晶片封裝技術整合了濾波器、低雜訊放大器(LNA)和開關,提高了良率並縮小了基板面積。隨著砷化鎵基替代方案轉向CMOS工藝,6GHz以下頻段的無線電單元正在為新興市場營運商實現性能和價格的平衡。供應鏈多元化,擺脫單一供應晶圓代工廠,促進了競爭性競標,並進一步壓縮了資本支出(CAPEX)。這些效率提升措施共同擴大了目標需求,並增強了整個5G技術市場組件供應商的規模經濟效益。
碎片化的頻段分配
不同地區頻段規劃的不一致迫使原始設備製造商 (OEM) 生產多頻段設備,從而增加了物料清單 (BOM) 成本並減緩了規模經濟效益。跨境卡車運輸路線會因用戶設備在不相容的營運商之間切換而出現漫遊問題。高成本的頻段競標使現有業者壟斷了頻段,阻礙了服務不足的農村地區競爭性基礎設施的建設。先進的干擾控制增加了規劃的複雜性,並推高了增加小型基地台密度的成本。這些摩擦因素正在減緩部署速度,但 WRC-23 框架下的監管協調工作旨在在未來十年內縮小差距。
細分市場分析
到2025年,硬體將佔5G技術市場佔有率的47.55%,營運商採購無線單元、天線和傳輸路由器以進行全國範圍的部署。儘管資金持續流入高功率大規模MIMO無線電和光纖回程傳輸線路,但年增率已趨於平緩。隨著營運商編配、雲端管理和網路切片變現外包,業務收益正以19.55%的複合年成長率成長。供應商藍圖現在納入了部署、最佳化和基於訂閱的分析功能,將一次性硬體交易轉變為經常性收入來源。基頻。超大規模資料超大規模資料中心業者營運商透過提供營運商雲端平台,將流量引導和策略控制轉移到基於訂閱的軟體,加劇了競爭。
在5G技術市場,能夠整合異質設備、管理持續軟體發布並根據服務等級協定(SLA)保證關鍵績效指標(KPI)的整合商越來越受到重視。硬體供應商為了應對這項挑戰,正努力透過整合人工智慧加速器、整合回程傳輸和遠端電動傾斜控制功能來保住市場佔有率。同時,區域性鐵塔公司正在中立主機基礎設施之上建立託管服務,為企業和行動虛擬網路營運商(MVNO)提供模組化入口。雖然向服務模式的轉變擴大了生態系統的參與範圍,但也分散了責任,並增加了互通性測試的成本。
至2025年,由於其良好的無線電波傳播特性以及現有宏電網站點的複用潛力,6GHz以下頻段的資產將佔5G技術市場規模的60.70%。中頻段在100-200MHz的連續頻寬和公里級的覆蓋範圍之間取得了良好的平衡,使其成為全國覆蓋的理想選擇。然而,營運商正嘗試透過混合部署400MHz寬的毫米波頻道來保障都市區容量,混合部署的複合年成長率將達到20.95%。具備波束控制功能的毫米波小型基地台正被安裝在路燈和公車站候車區,以分流體育場觀眾和使用固定無線連接的家庭用戶的網路流量。
動態頻譜共享 (DSS) 將未使用的 LTE 載波重新用於 5G,從而緩解頻率競標帶來的價格上漲。美國的 CBRS 和歐洲的共享存取框架 (共用 Access Framework) 為工廠和港口等場所的企業微網路提供了支援。隨著監管機構協調 6 GHz 頻段的中高頻段,設備製造商正在設計三頻數據機以實現無縫漫遊。這項發展藍圖設想,Sub-6 GHz 頻段將支援全國範圍內的行動通訊,而毫米波和未來的兆赫頻段分配將滿足熱點區域的Gigabit級吞吐量需求,從而在整個 5G 技術市場中構建一個分層頻譜戰略。
區域分析
在政府果斷政策、電信營運商規模以及蓬勃發展的設備生態系統的推動下,亞太地區預計到2025年將佔據全球5G技術市場41.05%的佔有率。中國在2024年新增了超過100萬個5G基地台,並利用製造協同效應降低了單節點成本。韓國在商用獨立組網(SA)覆蓋方面處於領先地位,並正在實現雲端遊戲通行證和VR音樂會的商業化。在日本,多家業者共用無線接取網路(RAN)正在減少冗餘,並加速高速鐵路沿線的覆蓋擴展。在印度,繼2024年價值190億美元的頻譜競標之後,營運商正透過中立主機塔和網路共用合作備忘錄(MOU)最佳化資本支出(CAPEX)。東南亞國協正利用多邊融資建設出口導向產業園區,進而提振整個區域5G技術市場的需求。
北美地區在收入方面位居第二,這得益於領先採用者充分利用了美國聯邦通訊委員會(FCC)“5G FAST計劃”釋放的中波頻段。體育場館中的毫米波疊加網路為即時影片串流提供了多Gigabit的上行鏈路,而本地固定無線網路正在取代光纖,成為最後一公里寬頻的替代方案。美國的物流、石化和醫療保健公司正在試點使用具有本地分支邊緣節點的私有頻段,以滿足資料主權要求。加拿大正在協調釋放頻段和強制共用基地台,以降低人口稀少地區的基礎設施建設成本。墨西哥正利用跨境價值鏈,並在加工出口工廠部署5G機器人,展現了對拉丁美洲新興5G技術市場的連鎖反應。
在歐洲,5G技術的穩定普及正得到「數位十年」基準和綠色新政下能源法規的支持。在德國的汽車產業叢集,園區網路正在建設中,用於精密焊接和電池組裝。在北歐國家,透過將可再生能源運作的基地台與人工智慧驅動的睡眠模式調度器結合,降低了能源強度。在跨境貨運走廊,多重運營商邊緣漫遊試驗正在進行中,以維持持續的超可靠低延遲通訊(URLLC)覆蓋。諸如GDPR之類的資料隱私法,促使企業選擇供應商並制定加密策略,增加了合規的負擔。總而言之,可預測性和永續性的監管重點正在塑造歐洲在全球5G技術市場中獨特的發展軌跡。
其他好處:
- Excel格式的市場預測(ME)表
- 3個月的分析師支持
目錄
第1章:引言
- 研究假設和市場定義
- 調查範圍
第2章:調查方法
第3章執行摘要
第4章 市場狀況
- 市場概覽
- 市場促進因素
- 連網設備的持續成長
- 降低元件等級成本(射頻前端、SiGe功率放大器)
- 與 4G 相比,延遲效能和頻寬更優。
- 虛擬化與雲端原生核心的興起
- 開放式無線接取網路對降低新興市場資本支出的影響
- 利用頻率共用框架擴大遍遠地區的通訊覆蓋範圍
- 市場限制因素
- 頻率分配細分
- 每比特能耗和永續性目標
- 超高密度網路面臨的安全挑戰
- 3GPP Rel-19 之後標準的持續延遲
- 5G的歷史沿革與發展
- 目前引進週期(先行者、採用者、後入者)
- 價值鏈分析
- 監理情勢和政策趨勢
- 技術展望
- 波特五力分析
- 5G及未來科技(邁向6G之路)
- 宏觀經濟因素對市場的影響
第5章 市場規模與成長預測
- 按組件
- 硬體
- 軟體
- 服務
- 按頻段
- 6GHz以下頻段
- 毫米波
- 混合(Sub-6 + 毫米波)
- 透過使用
- eMBB
- FWA
- mMTC
- URLLC
- 按最終用戶行業分類
- 一般消費者
- 製造業
- 衛生保健
- 車
- 能源公用事業
- 媒體與娛樂
- 公共安全與國防
- 透過網路架構
- 獨立版 (SA)
- 非獨立式(NSA)
- 按地區
- 北美洲
- 美國
- 加拿大
- 墨西哥
- 南美洲
- 巴西
- 阿根廷
- 其他南美國家
- 歐洲
- 德國
- 英國
- 法國
- 義大利
- 西班牙
- 俄羅斯
- 其他歐洲國家
- 亞太地區
- 中國
- 日本
- 印度
- 韓國
- 澳洲和紐西蘭
- 其他亞太國家
- 中東
- GCC
- 土耳其
- 其他中東國家
- 非洲
- 南非
- 奈及利亞
- 其他非洲國家
- 北美洲
第6章 競爭情勢
- 市場集中度
- 策略趨勢
- 市佔率分析
- 公司簡介
- Huawei Technologies Co., Ltd.
- Telefonaktiebolaget LM Ericsson(Ericsson)
- Nokia Corporation
- Qualcomm Incorporated
- Samsung Electronics Co., Ltd.
- ZTE Corporation
- Intel Corporation
- MediaTek Inc.
- Cisco Systems, Inc.
- NEC Corporation
- Fujitsu Limited
- CommScope Holding Company, Inc.
- Apple Inc.
- Skyworks solutions, Inc.
- Analog Devices, Inc.
- Juniper Networks, Inc.
- Mavenir plc
- Parallel Wireless Inc.
第7章 市場機會與未來展望
According to Mordor Intelligence, the 5G technology market size is expected to grow from USD 195.43 billion in 2025 to USD 231.15 billion in 2026 and is forecast to reach USD 534.43 billion by 2031 at 18.26% CAGR over 2026-2031.
This report is Segmented by Component (Hardware, Software, Services), Spectrum Band (Sub-6 GHz, Mmwave, Hybrid), Application (eMBB, FWA, MMTC, URLLC), End-User Industry (Consumer, Manufacturing, and More), Network Architecture (Stand-Alone, Non-Stand-Alone), and Geography. The Market Forecasts are Provided in Terms of Value (USD).
Global 5G Technology Market Trends and Insights
Sustained Increase in Connected Devices
Cellular IoT connections are projected to surpass 5.9 billion by 2030, intensifying capacity requirements on public and private networks . Manufacturing plants are scaling predictive maintenance and automated inspection, while smart-city traffic and environmental sensors multiply data flows. Edge compute caches time-critical analytics locally, lowering backhaul loads and reducing latency. Private networks are displacing Wi-Fi inside hazardous facilities where deterministic performance and intrinsic security are mandatory. This device surge drives compounding data traffic that underpins sustained spending across radio, transport, and cloud domains in the 5G technology market.
Component-Level Cost Reductions in RF Front-End and SiGe Power Amplifiers
Silicon-germanium power-amplifier innovations have cut manufacturing costs by nearly 30% since 2024, lowering price points for mid-tier 5G smartphones and CPEs. Advanced multi-chip packaging integrates filters, LNAs, and switches, improving yields and shrinking board footprints. As gallium-arsenide alternatives migrate to CMOS processes, Sub-6 GHz radio units balance performance with affordability for emerging-market carriers. Supply-chain diversification away from single-source foundries is spurring competitive bids that further compress equipment capex. Collectively, these efficiencies expand addressable demand and reinforce scale advantages for component suppliers throughout the 5G technology market.
Fragmented Spectrum Allocations
Incoherent regional band plans oblige OEMs to produce multiband devices, inflate BOM costs, and slow scale economics. Cross-border trucking corridors suffer roaming glitches when user equipment hops between mismatched carriers. Cash-intensive auctions lock spectrum behind incumbents, dampening competitive build-outs in underserved rural pockets. Advanced interference coordination adds planning complexity and pushes small-cell densification costs higher. These friction points temper deployment velocity, although regulatory harmonization initiatives under WRC-23 aim to narrow gaps over the next decade.
Other drivers and restraints analyzed in the detailed report include:
- Superior Latency and Bandwidth Performance Versus 4G Networks
- Rise of Virtualized and Cloud-Native 5G Cores
- Energy Consumption Per Bit Versus Sustainability Targets
For complete list of drivers and restraints, kindly check the Table Of Contents.
Segment Analysis
Hardware captured 47.55% of the 5G technology market share in 2025 as operators procured radio units, antennas, and transport routers for nationwide roll-outs. High-power massive-MIMO radios and fiber backhaul lines continue to attract capital, yet year-on-year growth is plateauing. Services revenue is expanding 19.55% CAGR as operators outsource orchestration, cloud management, and network-slice monetization. Vendor roadmaps now bundle installation, optimization, and subscription-based analytics that convert one-time hardware deals into annuities. Open-RAN disaggregation lets carriers mix baseband software from one supplier with radios from another, eroding traditional vendor lock-ins. Hyperscalers deliver telco cloud platforms that shift traffic steering and policy control into subscription software, intensifying competition.
The 5G technology market increasingly rewards integrators that bridge heterogeneous gear, manage continuous software releases, and guarantee KPIs under SLAs. Hardware vendors respond by embedding AI accelerators, integrated backhaul, and remote-electrical-tilt controls to defend their share. Meanwhile, regional tower companies layer managed services on neutral host infrastructure, giving enterprises and MVNOs modular entry points. The pivot to services broadens ecosystem participation, but also fragments accountability, raising interoperability testing overhead.
Sub-6 GHz assets constituted 60.70% of the 5G technology market size in 2025 due to favorable propagation and reuse of existing macro-grid sites. Mid-band delivers a balance of 100-200 MHz contiguous bandwidth with kilometer-scale reach, ideal for nationwide coverage. Operators, however, chase urban capacity through hybrid layering of 400 MHz-wide mmWave channels, propelling a 20.95% CAGR for mixed deployments. Beam-steered mmWave small cells pop up on streetlights and transit shelters to offload stadium crowds and fixed-wireless households.
Dynamic spectrum sharing (DSS) repurposes idle LTE carriers for 5G, mitigating auction sticker shock. U.S. CBRS and European shared-access frameworks unlock enterprise micro-networks inside factories and ports. As regulators harmonize the 6 GHz upper mid-band, device makers are designing triple-band modems to roam seamlessly. The evolutionary roadmap suggests Sub-6 GHz anchors nationwide mobility, while mmWave and future terahertz allocations address hot-spot Gigabit throughput, creating a layered spectrum strategy across the 5G technology market.
Complete Report Scope:
- By Component
- Hardware
- Software
- Services
- By Spectrum Band
- Sub-6 GHz
- mmWave
- Hybrid (Sub-6+mmWave)
- By Application
- eMBB
- FWA
- mMTC
- URLLC
- By End-User Industry
- Consumer
- Manufacturing
- Healthcare
- Automotive
- Energy and Utilities
- Media and Entertainment
- Public Safety and Defense
- By Network Architecture
- Stand-Alone (SA)
- Non-Stand-Alone (NSA)
- By Geography
- North America
- United States
- Canada
- Mexico
- South America
- Brazil
- Argentina
- Rest of South America
- Europe
- Germany
- United Kingdom
- France
- Italy
- Spain
- Russia
- Rest of Europe
- Asia Pacific
- China
- Japan
- India
- South Korea
- Australia and New Zealand
- Rest of Asia Pacific
- Middle East
- GCC
- Turkey
- Rest of Middle East
- Africa
- South Africa
- Nigeria
- Rest of Africa
- North America
Geography Analysis
Asia Pacific held 41.05% of the 5G technology market in 2025, fueled by decisive government policies, operator scale, and vibrant device ecosystems. China added over 1 million 5G base stations in 2024, capturing manufacturing synergies and reducing per-node costs. South Korea leads commercial SA coverage, monetizing cloud gaming passes and VR concerts. Japan's multi-operator RAN sharing lowers redundancy and accelerates coverage along high-speed rail lines. India's USD 19 billion spectrum auction in 2024 pushed carriers to optimize capex through neutral-host towers and network-sharing MOUs. ASEAN countries leverage multilateral financing to build export-oriented industrial parks, boosting regional demand across the 5G technology market.
North America ranks second by revenue as early movers exploit mid-band spectrum cleared under the FCC's 5G FAST Plan. Stadium mmWave overlays deliver multi-gigabit uplinks for live video, while rural fixed wireless substitutes fiber for last-mile broadband. The US enterprises in logistics, petrochemicals, and healthcare pilot private slices with local breakout edge nodes to satisfy data-sovereignty requirements. Canada coordinates spectrum releases and tower-sharing mandates that rationalize build-out costs across sparsely populated territories. Mexico taps cross-border value chains to adopt 5G robotics inside maquiladora plants, illustrating spill-over effects into Latin America's nascent 5G technology market.
Europe records consistent uptake backed by Digital Decade benchmarks and green-deal energy mandates. Germany's automotive clusters orchestrate campus networks for precision welding and battery-cell assembly. The Nordics integrate renewable-powered base stations and AI sleep-mode schedulers to shrink energy intensity. Cross-border freight corridors pilot multi-operator edge roaming to maintain continuous URLLC coverage. Data privacy laws such as GDPR drive selective vendor sourcing and encryption policies, elevating compliance overhead. Overall, regulatory predictability and sustainability priorities shape Europe's differentiated trajectory within the global 5G technology market.
- Huawei Technologies Co., Ltd.
- Telefonaktiebolaget LM Ericsson (Ericsson)
- Nokia Corporation
- Qualcomm Incorporated
- Samsung Electronics Co., Ltd.
- ZTE Corporation
- Intel Corporation
- MediaTek Inc.
- Cisco Systems, Inc.
- NEC Corporation
- Fujitsu Limited
- CommScope Holding Company, Inc.
- Apple Inc.
- Skyworks solutions, Inc.
- Analog Devices, Inc.
- Juniper Networks, Inc.
- Mavenir plc
- Parallel Wireless Inc.
Additional Benefits:
- The market estimate (ME) sheet in Excel format
- 3 months of analyst support
TABLE OF CONTENTS
1 INTRODUCTION
- 1.1 Study Assumptions and Market Definition
- 1.2 Scope of the Study
2 RESEARCH METHODOLOGY
3 EXECUTIVE SUMMARY
4 MARKET LANDSCAPE
- 4.1 Market Overview
- 4.2 Market Drivers
- 4.2.1 Sustained increase in connected devices
- 4.2.2 Component-level cost reductions (RF-front end, SiGe PAs)
- 4.2.3 Superior latency and bandwidth versus 4G
- 4.2.4 Rise of virtualized and cloud-native cores
- 4.2.5 Open-RAN capex savings in emerging markets
- 4.2.6 Spectrum-sharing frameworks unlocking rural coverage
- 4.3 Market Restraints
- 4.3.1 Fragmented spectrum allocations
- 4.3.2 Energy consumption per bit vs sustainability targets
- 4.3.3 Security liabilities in hyper-dense networks
- 4.3.4 Persistent standards delays beyond 3GPP Rel-19
- 4.4 5G Timeline and Evolution
- 4.5 Current Adoption Cycle (Forerunners, Adopters and Laggards)
- 4.6 Value Chain Analysis
- 4.7 Regulatory and Policy Landscape
- 4.8 Technological Outlook
- 4.9 Porter's Five Forces Analysis
- 4.9.1 Threat of New Entrants
- 4.9.2 Bargaining Power of Suppliers
- 4.9.3 Bargaining Power of Buyers
- 4.9.4 Threat of Substitutes
- 4.9.5 Competitive Rivalry
- 4.10 5G and Beyond (6G Pathways)
- 4.11 Impact of Macroeconomic Factors on the Market
5 MARKET SIZE AND GROWTH FORECASTS (VALUE)
- 5.1 By Component
- 5.1.1 Hardware
- 5.1.2 Software
- 5.1.3 Services
- 5.2 By Spectrum Band
- 5.2.1 Sub-6 GHz
- 5.2.2 mmWave
- 5.2.3 Hybrid (Sub-6+mmWave)
- 5.3 By Application
- 5.3.1 eMBB
- 5.3.2 FWA
- 5.3.3 mMTC
- 5.3.4 URLLC
- 5.4 By End-User Industry
- 5.4.1 Consumer
- 5.4.2 Manufacturing
- 5.4.3 Healthcare
- 5.4.4 Automotive
- 5.4.5 Energy and Utilities
- 5.4.6 Media and Entertainment
- 5.4.7 Public Safety and Defense
- 5.5 By Network Architecture
- 5.5.1 Stand-Alone (SA)
- 5.5.2 Non-Stand-Alone (NSA)
- 5.6 By Geography
- 5.6.1 North America
- 5.6.1.1 United States
- 5.6.1.2 Canada
- 5.6.1.3 Mexico
- 5.6.2 South America
- 5.6.2.1 Brazil
- 5.6.2.2 Argentina
- 5.6.2.3 Rest of South America
- 5.6.3 Europe
- 5.6.3.1 Germany
- 5.6.3.2 United Kingdom
- 5.6.3.3 France
- 5.6.3.4 Italy
- 5.6.3.5 Spain
- 5.6.3.6 Russia
- 5.6.3.7 Rest of Europe
- 5.6.4 Asia Pacific
- 5.6.4.1 China
- 5.6.4.2 Japan
- 5.6.4.3 India
- 5.6.4.4 South Korea
- 5.6.4.5 Australia and New Zealand
- 5.6.4.6 Rest of Asia Pacific
- 5.6.5 Middle East
- 5.6.5.1 GCC
- 5.6.5.2 Turkey
- 5.6.5.3 Rest of Middle East
- 5.6.6 Africa
- 5.6.6.1 South Africa
- 5.6.6.2 Nigeria
- 5.6.6.3 Rest of Africa
- 5.6.1 North America
6 COMPETITIVE LANDSCAPE
- 6.1 Market Concentration
- 6.2 Strategic Moves
- 6.3 Market Share Analysis
- 6.4 Company Profiles (includes Global level Overview, Market level overview, Core Segments, Financials as available, Strategic Information, Market Rank/Share for key companies, Products and Services, and Recent Developments)
- 6.4.1 Huawei Technologies Co., Ltd.
- 6.4.2 Telefonaktiebolaget LM Ericsson (Ericsson)
- 6.4.3 Nokia Corporation
- 6.4.4 Qualcomm Incorporated
- 6.4.5 Samsung Electronics Co., Ltd.
- 6.4.6 ZTE Corporation
- 6.4.7 Intel Corporation
- 6.4.8 MediaTek Inc.
- 6.4.9 Cisco Systems, Inc.
- 6.4.10 NEC Corporation
- 6.4.11 Fujitsu Limited
- 6.4.12 CommScope Holding Company, Inc.
- 6.4.13 Apple Inc.
- 6.4.14 Skyworks solutions, Inc.
- 6.4.15 Analog Devices, Inc.
- 6.4.16 Juniper Networks, Inc.
- 6.4.17 Mavenir plc
- 6.4.18 Parallel Wireless Inc.
7 MARKET OPPORTUNITIES AND FUTURE OUTLOOK
- 7.1 White-space and Unmet-Need Assessment


