


 |
市場調查報告書
商品編碼
2124961
亞太地區工業感測器:市場佔有率分析、產業趨勢與統計及成長預測(2026-2031)Asia-Pacific Industrial Sensors - Market Share Analysis, Industry Trends & Statistics, Growth Forecasts (2026 - 2031) |
||||||

※ 本網頁內容可能與最新版本有所差異。詳細情況請與我們聯繫。
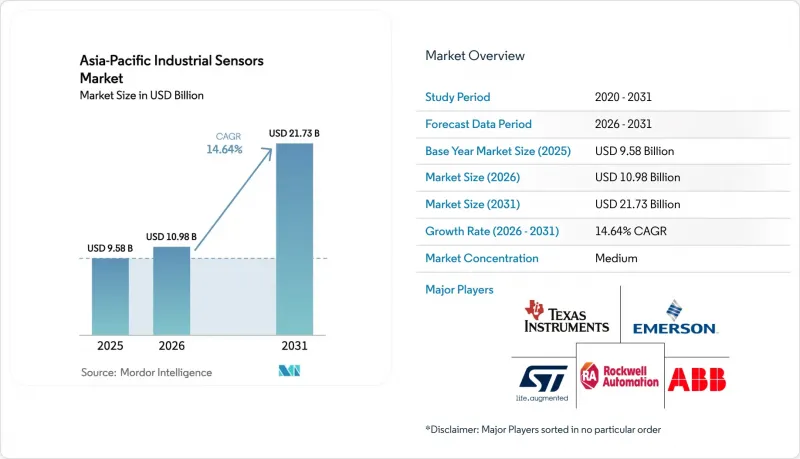
根據 Mordor Intelligence 預測,亞太地區工業感測器市場規模預計將從 2025 年的 95.8 億美元成長到 2026 年的 109.8 億美元,然後在 2031 年達到 217.3 億美元,2026 年至 2031 年的複合年成長率為 14.64%。
本報告按產品類型(壓力、溫度、液位、流量等)、終端用戶產業(汽車、電子半導體等)、感測器連接方式(有線、無線、IO-Link、邊緣整合智慧感測器)、感測技術(基於MEMS、基於CMOS、壓阻等)和地區進行細分。市場預測以美元(USD)為單位。
亞太地區工業感測器市場趨勢及洞察
工業物聯網和工業4.0的普及
製造商正從點級自動化轉向全面互聯的營運模式,所有資產都將時間序列資料流傳輸到本地或雲端分析平台。中國工業人工智慧的普及率預計在2024年達到94%,凸顯了這項轉變的規模。感測器將成為半導體工廠良率最佳化和化工廠能源管理的基礎。日本的「工業5.0」計畫正在加速推動人工智慧的普及,以應對勞動力老化問題。協作機器人依靠力感測器和接近感測器來保障工人安全。韓國的目標是到2025年建成3萬家智慧工廠,將感測器從可選硬體轉變為強制性合規要求。隨著買家對互通性的需求日益成長,支援開放協議的設備也變得越來越普遍,硬體設備的總數也在不斷增加,儘管品牌忠誠度正在下降。主要供應商現在將分析服務訂閱與硬體捆綁銷售,將一次性的感測器銷售轉變為持續的收入來源。
亞太地區製造業的快速自動化
人事費用上升和供應鏈回流迫使製造商實現所有重複性工作的自動化。印度的生產連結獎勵計畫計畫(PLI)預計到2024年將為工廠帶來1308億美元的額外產值,推動新建設電子和汽車工廠對溫度、壓力和光學感測器的新訂單。越南價值1000億美元的電子產品生產依賴光學感測器來確保表面黏著技術精度,隨著微型化元件公差的收緊,感測器每3-5年就需要更換一次。泰國混合動力汽車生產線的維修需要更精確的壓力和流量測量設備,而印尼的食品加工企業正在從人工檢測轉向機器視覺品管。隨著產量目標的提高,感測器更換週期正在縮短,從而提升了年度更換收入。
前期成本高,投資報酬率不確定性
中小企業往往缺乏足夠的營運資金來承擔預測性維護試點部署通常需要12-18個月的投資回收期。印度年銷售額低於1000萬美元的家族式工廠傾向於選擇能夠立即提升產量的機械設備,而不是只能帶來間接效益的感測器。東南亞的汽車零件工廠利潤率低,需要在24個月內收回投資,但考慮到整合和學習曲線,無線部署可能需要長達36個月的時間。允許分期付款的租賃模式仍然很少見,這增加了投資門檻。因此,資金雄厚的大公司和資源有限的供應商之間的數位落差正在擴大。
細分市場分析
到2025年,壓力感測器將在亞太地區的工業感測器市場佔據34.28%的佔有率,凸顯了其在製程控制、液壓系統和車輛安全系統中的關鍵作用。預測顯示,到2031年,壓力感測器市場將以14.95%的複合年成長率保持強勁成長,這主要得益於私有5G網路能夠最佳化壓縮機並消除蒸氣分配迴路中的延遲問題。溫度感測器仍是第二大類別,主要得益於半導體製造廠對低於0.1 度C溫度穩定性的追求,以及生物製藥產業對8 度C以下冷鏈的要求。液位測量的成長則得益於城市供水基礎設施的現代化,腐蝕的機械浮球被基於雷達的感測器所取代,後者即使在高固態含量的廢水中也能有效運作。流量感測器正朝著計量收費交易中的質量流量技術發展,因為以往計量交易中流量波動會導致累計和糾紛。
在其他產品組合領域,氣體感測器正拓展至無菌環境下的室內空氣監測領域;振動感測器正成為預測性維護套件的標配;光學感測器對於每分鐘超過300個單元的標籤精度至關重要。磁場感測器在電動車動力傳動系統對準和電流檢測中發揮獨特的作用。隨著生產逐步升級,買家越來越關注結合壓力、溫度和光學感測的混合感測器堆,以獲得多維可視性,這為多產品供應商拓展了交叉銷售機會。
到2025年,汽車產業將佔亞太地區工業感測器市場規模的26.15%。這主要得益於電動車電池組通常整合超過100個溫度和電壓測量節點,以及高級駕駛輔助系統(ADAS)套件中整合了雷達、超音波設備。相較之下,受監管部門對無菌區域內持續環境監測的要求推動,製藥和生命科學產業預計到2031年將以14.72%的複合年成長率成長。電子製造業排名第三,半導體製造廠通常每個廠區安裝超過5萬個感測器,以維持奈米級製程的穩定性。化學和石化企業依靠壓力和流量檢測來防止失控反應,而電力生產商則利用振動監測來最大限度地運作風力發電機齒輪箱和太陽能逆變器組的正常運行時間。
在海上平台上,由於電纜鋪設成本超過每公尺1000美元,石油和天然氣公司更傾向於採用無線解決方案。食品加工商需要能夠承受高壓沖洗的IP69K防護等級的不銹鋼感測器,從而實現3至5年的更換週期。供水事業正在採用雷達液位計和pH探頭來滿足日益嚴格的廢水處理標準,而礦場則依靠接近感測器和氣體感測器來避免代價高昂的疏散。航太和國防領域仍然是一個特殊的細分市場,需要耐輻射且工作溫度範圍寬廣的設備,因此價格不菲。
其他好處:
- Excel格式的市場預測(ME)表
- 3個月的分析師支持
目錄
第1章:引言
- 研究假設和市場定義
- 調查範圍
第2章:調查方法
第3章執行摘要
第4章 市場狀況
- 市場概覽
- 市場促進因素
- 工業物聯網和工業4.0的普及
- 亞太地區製造業的快速自動化
- 政府對智慧工廠的支持措施
- 對預測性維護解決方案的需求
- 採用IO-Link和邊緣可設定感測器
- 部署私有5G工業園區
- 市場限制因素
- 前期成本高,投資報酬率不確定性
- 整合舊有系統的複雜性
- MEMS元件晶片供應的波動性
- 限制工業無線通訊的頻段法規
- 產業價值鏈分析
- 監理情勢
- 技術展望
- 波特五力分析
第5章 市場規模與成長預測
- 依產品類型
- 壓力
- 溫度
- 等級
- 流動
- 磁場
- 加速度和偏航率
- 氣體
- 振動
- 近距離類型
- 光學/光電
- 按最終用戶行業分類
- 車
- 電子和半導體
- 化工/石油化工
- 發電
- 石油和天然氣
- 食品/飲料
- 水和污水處理
- 製藥和生命科學
- 金屬和採礦
- 航太/國防
- 感測器連接性別
- 有線感應器
- 無線感測器
- IO-Link感測器
- 邊緣整合智慧感測器
- 透過感測技術
- MEMS 基座
- 基於CMOS的
- 壓阻式
- 電容式
- 光學
- 電磁學
- 按地區
- 中國
- 日本
- 韓國
- 印度
- 東南亞
- 澳洲和紐西蘭
- 其他亞太國家
第6章 競爭情勢
- 市場集中度
- 策略趨勢
- 市佔率分析
- 公司簡介
- ABB Ltd.
- Emerson Electric Co.
- Honeywell International Inc.
- Siemens AG
- Rockwell Automation Inc.
- Texas Instruments Incorporated
- STMicroelectronics NV
- Yokogawa Electric Corporation
- Endress+Hauser AG
- Schneider Electric SE
- Mitsubishi Electric Corporation
- Omron Corporation
- Keyence Corporation
- SICK AG
- Pepperl+Fuchs SE
- Balluff GmbH
- ifm electronic gmbh
- Hans Turck GmbH and Co. KG
- TE Connectivity Ltd.
- Analog Devices Inc.
- Infineon Technologies AG
- Sensata Technologies Holding plc
- Panasonic Holdings Corp.
- First Sensor AG
- Amphenol Advanced Sensors
- Ericco International Ltd.
- Others(fully profiled>=20)
第7章 市場機會與未來展望
According to Mordor Intelligence, the Asia-Pacific industrial sensors market size is expected to grow from USD 9.58 billion in 2025 to USD 10.98 billion in 2026 and is forecast to reach USD 21.73 billion by 2031 at 14.64% CAGR over 2026-2031.
This report is Segmented by Product Type (Pressure, Temperature, Level, Flow, and More), End-User Industry (Automotive, Electronics and Semiconductor, and More), Sensor Connectivity (Wired, Wireless, IO-Link, and Edge-Integrated Smart Sensors), Sensing Technology (MEMS-Based, CMOS-Based, Piezoresistive, and More), and Geography. The Market Forecasts are Provided in Terms of Value (USD).
Asia-Pacific Industrial Sensors Market Trends and Insights
IIoT And Industry 4.0 Penetration
Manufacturers are migrating from point-level automation to fully connected operations where every asset streams time-series data to on-premise or cloud analytics platforms. China's 94% industrial-AI adoption in 2024 validates the scale of this shift, with sensors underpinning yield optimization in semiconductor fabs and energy management routines in chemical plants. Japan's Society 5.0 program accelerates adoption in aging-workforce scenarios, as collaborative robots rely on force and proximity sensors to ensure operator safety. South Korea aims to establish 30,000 smart factories by 2025, effectively repositioning sensors from optional hardware to a compliance necessity. Open-protocol devices are proliferating as buyers seek interoperability, fragmenting brand loyalty but enlarging the total hardware pool. Premium vendors now bundle analytics subscriptions with hardware, transforming one-off sensor sales into recurring revenue.
Rapid Automation Across Asia-Pacific Manufacturing
Rising labor costs and the reshoring of supply chains push producers to automate every repetitive task. India's PLI scheme is expected to generate USD 130.8 billion in additional factory output by 2024 and spur new orders for temperature, pressure, and optical sensors in greenfield electronics and automotive plants. Vietnam's USD 100 billion electronics output relies on optical sensors for surface-mount accuracy, replacing them every three to five years as component miniaturization tightens tolerances. Thailand's retrofit of hybrid-vehicle lines demands higher-precision pressure and flow devices, while Indonesia's food processors are shifting from manual checks to machine-vision quality control. As throughput targets climb, sensor refresh cycles shorten, lifting annual replacement revenue.
High Upfront Cost And ROI Uncertainty
SMEs often lack the working capital to absorb 12- to 18-month payback periods typical of predictive-maintenance pilots. Indian family-owned mills with annual revenue below USD 10 million prefer machinery that lifts output immediately over sensors offering indirect gains. Slim margins at Southeast Asian auto-component plants demand ROI in under 24 months, whereas wireless deployments may take up to 36 months when integration and learning curves are counted. Leasing models that could spread payments remain scarce, prolonging the investment hurdle. The result is a widening digital gap between cash-rich corporations and resource-constrained suppliers.
Other drivers and restraints analyzed in the detailed report include:
- Government Incentives For Smart Factories
- Demand For Predictive Maintenance Solutions
- Legacy-System Integration Complexity
For complete list of drivers and restraints, kindly check the Table Of Contents.
Segment Analysis
Pressure sensors commanded 34.28% Asia-Pacific industrial sensors market share in 2025, reflecting their indispensability in process control, hydraulics, and vehicle safety systems. Projections show a strong 14.95% CAGR growth through 2031, driven by private 5G's ability to eliminate latency issues in compressor optimization and steam-distribution loops. Temperature sensors remain the next-largest category, underpinned by semiconductor fabs' pursuit of sub-0.1 °C stability and biologics' requirement for cold-chain integrity below 8 °C. Level-measurement growth is driven by municipal water upgrades replacing corroding mechanical floats with radar units that perform effectively in high-solids effluent. Flow sensors are shifting toward mass-flow technology in custody-transfer transactions, where volumetric variance previously led to inflated billing disputes.
Across the remainder of the portfolio, gas sensors are expanding into indoor-air monitoring for sterile spaces, vibration devices are standard equipment in predictive-maintenance kits, and optical sensors are crucial for label placement accuracy exceeding 300 units per minute. Magnetic-field sensors fulfill niche roles in EV powertrain alignment and current sensing. With each incremental production upgrade, buyers accent hybrid stacks, combining pressure, temperature, and optical sensing, to gain multidimensional visibility, intensifying cross-selling opportunities for multi-product vendors.
Automotive lines accounted for 26.15% of the Asia-Pacific industrial sensors market size in 2025, driven by the embedding of over 100 temperature and voltage nodes per unit in EV battery packs and the integration of radar, lidar, and ultrasonic devices in ADAS suites. In contrast, the pharmaceutical and life sciences segment is on track for a 14.72% CAGR through 2031, as regulators tighten mandates for continuous environmental monitoring within sterile zones. Electronics manufacturing ranks third, as chipfabs often exceed 50,000 installed sensors per site to sustain nanometer-class process stability. Chemical and petrochemical complexes rely on pressure and flow sensing to prevent runaway reactions, while power producers utilize vibration monitoring to maximize the uptime of wind turbine gearboxes and solar inverter strings.
Oil-and-gas operators favor wireless builds on offshore platforms where cabling exceeds USD 1,000 per meter. Food processors are pushing for stainless-steel IP69K sensors that can withstand high-pressure washdowns, resulting in three- to five-year replacement cycles. Water utilities adopt radar level gauges and pH probes to comply with increasingly stringent discharge limits, whereas mining sites rely on proximity and gas sensors to prevent costly evacuations. Aerospace and defense remain specialty niches demanding radiation-hardened, wide-temperature-range devices that command premium pricing.
Complete Report Scope:
- By Product Type
- Pressure
- Temperature
- Level
- Flow
- Magnetic Field
- Acceleration and Yaw Rate
- Gas
- Vibration
- Proximity
- Optical / Photo-electric
- By End-user Industry
- Automotive
- Electronics and Semiconductor
- Chemical and Petrochemical
- Power Generation
- Oil and Gas
- Food and Beverage
- Water and Wastewater
- Pharmaceuticals and Life Sciences
- Metals and Mining
- Aerospace and Defense
- By Sensor Connectivity
- Wired Sensors
- Wireless Sensors
- IO-Link Sensors
- Edge-integrated Smart Sensors
- By Sensing Technology
- MEMS-based
- CMOS-based
- Piezoresistive
- Capacitive
- Optical
- Electromagnetic
- By Geography
- China
- Japan
- South Korea
- India
- Southeast Asia
- Australia and New Zealand
- Rest of Asia-Pacific
List of Companies Covered in this Report:
- ABB Ltd.
- Emerson Electric Co.
- Honeywell International Inc.
- Siemens AG
- Rockwell Automation Inc.
- Texas Instruments Incorporated
- STMicroelectronics N.V.
- Yokogawa Electric Corporation
- Endress+Hauser AG
- Schneider Electric SE
- Mitsubishi Electric Corporation
- Omron Corporation
- Keyence Corporation
- SICK AG
- Pepperl+Fuchs SE
- Balluff GmbH
- ifm electronic gmbh
- Hans Turck GmbH and Co. KG
- TE Connectivity Ltd.
- Analog Devices Inc.
- Infineon Technologies AG
- Sensata Technologies Holding plc
- Panasonic Holdings Corp.
- First Sensor AG
- Amphenol Advanced Sensors
- Ericco International Ltd.
- Others (fully profiled >=20)
Additional Benefits:
- The market estimate (ME) sheet in Excel format
- 3 months of analyst support
TABLE OF CONTENTS
1 INTRODUCTION
- 1.1 Study Assumptions and Market Definition
- 1.2 Scope of the Study
2 RESEARCH METHODOLOGY
3 EXECUTIVE SUMMARY
4 MARKET LANDSCAPE
- 4.1 Market Overview
- 4.2 Market Drivers
- 4.2.1 IIoT And Industry 4.0 Penetration
- 4.2.2 Rapid Automation Across Asia-Pacific Manufacturing
- 4.2.3 Government Incentives For Smart Factories
- 4.2.4 Demand For Predictive Maintenance Solutions
- 4.2.5 IO-Link And Edge-Configurable Sensors Adoption
- 4.2.6 Private 5G Industrial Campus Roll-Outs
- 4.3 Market Restraints
- 4.3.1 High Upfront Cost And ROI Uncertainty
- 4.3.2 Legacy-System Integration Complexity
- 4.3.3 Chip-Supply Volatility For MEMS Devices
- 4.3.4 Spectrum Regulations Limiting Industrial Wireless
- 4.4 Industry Value Chain Analysis
- 4.5 Regulatory Landscape
- 4.6 Technological Outlook
- 4.7 Porter's Five Forces Analysis
- 4.7.1 Threat of New Entrants
- 4.7.2 Bargaining Power of Buyers
- 4.7.3 Bargaining Power of Suppliers
- 4.7.4 Threat of Substitutes
- 4.7.5 Intensity of Competitive Rivalry
5 MARKET SIZE AND GROWTH FORECASTS (VALUE)
- 5.1 By Product Type
- 5.1.1 Pressure
- 5.1.2 Temperature
- 5.1.3 Level
- 5.1.4 Flow
- 5.1.5 Magnetic Field
- 5.1.6 Acceleration and Yaw Rate
- 5.1.7 Gas
- 5.1.8 Vibration
- 5.1.9 Proximity
- 5.1.10 Optical / Photo-electric
- 5.2 By End-user Industry
- 5.2.1 Automotive
- 5.2.2 Electronics and Semiconductor
- 5.2.3 Chemical and Petrochemical
- 5.2.4 Power Generation
- 5.2.5 Oil and Gas
- 5.2.6 Food and Beverage
- 5.2.7 Water and Wastewater
- 5.2.8 Pharmaceuticals and Life Sciences
- 5.2.9 Metals and Mining
- 5.2.10 Aerospace and Defense
- 5.3 By Sensor Connectivity
- 5.3.1 Wired Sensors
- 5.3.2 Wireless Sensors
- 5.3.3 IO-Link Sensors
- 5.3.4 Edge-integrated Smart Sensors
- 5.4 By Sensing Technology
- 5.4.1 MEMS-based
- 5.4.2 CMOS-based
- 5.4.3 Piezoresistive
- 5.4.4 Capacitive
- 5.4.5 Optical
- 5.4.6 Electromagnetic
- 5.5 By Geography
- 5.5.1 China
- 5.5.2 Japan
- 5.5.3 South Korea
- 5.5.4 India
- 5.5.5 Southeast Asia
- 5.5.6 Australia and New Zealand
- 5.5.7 Rest of Asia-Pacific
6 COMPETITIVE LANDSCAPE
- 6.1 Market Concentration
- 6.2 Strategic Moves
- 6.3 Market Share Analysis
- 6.4 Company Profiles (includes Global level Overview, Market level overview, Core Segments, Financials as available, Strategic Information, Market Rank/Share for key companies, Products and Services, and Recent Developments)
- 6.4.1 ABB Ltd.
- 6.4.2 Emerson Electric Co.
- 6.4.3 Honeywell International Inc.
- 6.4.4 Siemens AG
- 6.4.5 Rockwell Automation Inc.
- 6.4.6 Texas Instruments Incorporated
- 6.4.7 STMicroelectronics N.V.
- 6.4.8 Yokogawa Electric Corporation
- 6.4.9 Endress+Hauser AG
- 6.4.10 Schneider Electric SE
- 6.4.11 Mitsubishi Electric Corporation
- 6.4.12 Omron Corporation
- 6.4.13 Keyence Corporation
- 6.4.14 SICK AG
- 6.4.15 Pepperl+Fuchs SE
- 6.4.16 Balluff GmbH
- 6.4.17 ifm electronic gmbh
- 6.4.18 Hans Turck GmbH and Co. KG
- 6.4.19 TE Connectivity Ltd.
- 6.4.20 Analog Devices Inc.
- 6.4.21 Infineon Technologies AG
- 6.4.22 Sensata Technologies Holding plc
- 6.4.23 Panasonic Holdings Corp.
- 6.4.24 First Sensor AG
- 6.4.25 Amphenol Advanced Sensors
- 6.4.26 Ericco International Ltd.
- 6.4.27 Others (fully profiled >=20)
7 MARKET OPPORTUNITIES AND FUTURE OUTLOOK
- 7.1 White-space and Unmet-need Assessment

 印度工業感測器和變送器:市場佔有率分析、行業趨勢和統計數據以及成長預測(2026-2031 年)工業感測器:市場佔有率分析、產業趨勢與統計、成長預測(2026-2031)
 工業感測器市場-2026-2032年全球市場預測
 2026-2030年全球工業感測器市場
 工業感測器和自動化市場預測至2034年—按感測器類型、技術、產業、應用、最終用戶和地區分類的全球分析
 工業感測器市場-全球市場規模、佔有率、趨勢、機會和預測:按產品、應用、地區和競爭對手分類,2021-2031年美國工業感測器:市場佔有率分析、產業趨勢與統計及成長預測(2026-2031 年)
 工業感測器市場規模、佔有率和趨勢分析報告:按感測器類型、技術、最終用途、地區和細分市場預測(2025-2033 年)
 工業感測器市場:按檢測方法、終端用戶產業和地區分類
 工業感測器市場機會、成長要素、產業趨勢分析及2026年至2035年預測