


 |
市場調查報告書
商品編碼
2122996
工業感測器:市場佔有率分析、產業趨勢與統計、成長預測(2026-2031)Industrial Sensors - Market Share Analysis, Industry Trends & Statistics, Growth Forecasts (2026 - 2031) |
||||||

※ 本網頁內容可能與最新版本有所差異。詳細情況請與我們聯繫。
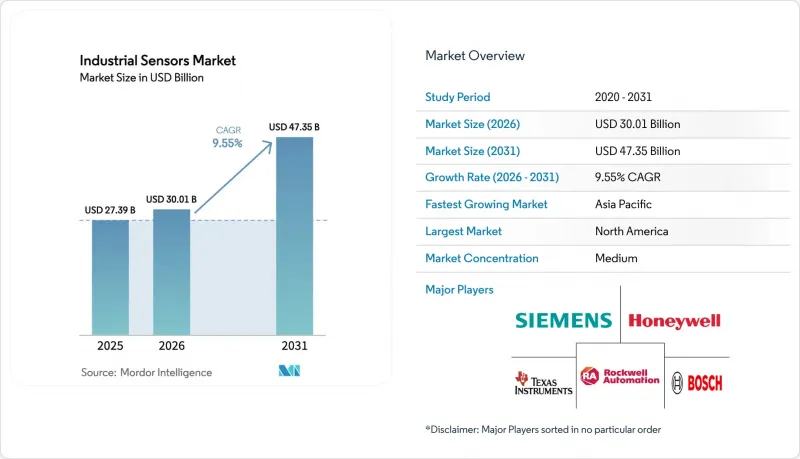
根據 Mordor Intelligence 預測,工業感測器市場規模預計將在 2025 年達到 273.9 億美元,2026 年達到 300.1 億美元,到 2031 年達到 473.5 億美元,2026 年至 2031 年的複合年成長率為 9.55%。
本報告按感測器類型(流量、壓力、接近/面積、液位等)、終端用戶產業(化學/石化、礦業/金屬、電力/能源等)、技術(有線/類比、有線/數位智慧、無線等)、通訊協定(現場匯流排、工業乙太網等)和地區進行細分。市場預測以美元計價。
全球工業感測器市場趨勢與洞察
工業4.0和工業物聯網的應用正在迅速成長。
私有5G網路、OPC UA互通性以及IEC 63278-1數位孿生標準正在打破傳統的資料孤島,使工廠能夠將感測器遙測資料流傳輸到整合分析平台。隨著企業逐步淘汰獨立SCADA部署,並轉向跨多個工廠的可擴展雲端原生平台,西門子預計2024年Xcelerator訂閱量將成長18%。從確定性控制迴路到機率推理的轉變能夠實現早期故障預測,通常提前7至14天,從而顯著減少因緊急停機造成的停機時間。然而,東協地區中小型製造商的能力存在差距,僅有22%的企業具備內部工業物聯網(IIoT)技能,這推動了對承包「感測器整合」解決方案的需求。
對預測性維護和遠端監控的需求
意外停機每年對七國集團(G7)的工廠造成約500億美元的損失,促使企業積極採用振動、溫度和聲波感測器,以便在異常情況發生後幾分鐘內將其檢測到。在製藥業,到2024年,68%的工廠將部署預測性維護感測器,高於2022年的41%,預計生產率中位數將提高32%。像霍尼韋爾Forge這樣的平台,其互聯資產數量在2024年成長了23%,遠端技術人員利用擴增實境(AR)頭顯和即時儀錶板,無需親臨現場即可排除設備故障。然而,據Dragos稱,2024年34%的勒索軟體攻擊利用了存在漏洞的遠端存取閘道器,凸顯了網路安全問題仍然是重中之重。
高額資本支出(CAPEX)和整合的複雜性
專案總成本不僅包括感測器硬體,還包括閘道器、現場基礎設施、中間件許可和系統整合的人事費用。即使使用羅克韋爾自動化控制代碼,建造典型的智慧工廠仍然需要 18 到 24 個月,耗資高達 13 億美元,這對中小企業來說是一個難以逾越的門檻。由於協議不一致導致工程工作量不斷增加,促使企業採用供應商平台,例如Schneider Electric的 EcoStruxure,該平台將多個網路抽像到單一 API 之後。
細分市場分析
預計到2031年,影像和視覺感測器市場將以10.34%的複合年成長率成長。到2025年,隨著卷積類神經網路人工操作員,品質檢測線將取代人工操作員,並保持每分鐘超過1000件的生產線速度,這將推動該類別工業感測器市場規模的成長。SONY將於2024年推出的2,450萬像素全域百葉窗CMOS晶片,將為偵測系統提供偵測微小缺陷所需的解析度。根據康耐視的報告,由於零缺陷要求日益提高,37%的受訪製造商計劃在未來兩年內擴大其視覺系統的部署。
壓力感測器在化學和石化行業的製程控制迴路中發揮重要作用,預計到2025年將佔據工業感測器市場24.73%的佔有率。然而,隨著成熟工廠的應用趨於飽和,新裝置量也趨於平穩,其銷售成長正在放緩。基於科氏原理與超音波原理的流量計在交易量測量領域正逐漸獲得市場認可,並逐步取代渦輪式流量計。接近感測器和麵積感測器正乘著機器人化的浪潮,發揮安全聯鎖裝置和工件檢測器的功能。同時,專用振動感測器和氣體洩漏感測器則在特定的風險緩解應用中佔據較高的價格區間。
預計到2031年,生命科學和製藥產業的複合年成長率將達到10.11%,在所有產業中成長最高。正如美國食品藥物管理局(FDA)新興技術計畫所建議的那樣,用於製程分析技術(PAT)的感測器對於連續生產線至關重要。根據國際石油工程師協會(ISPE)的研究數據,預計到2024年,預測性維護的採用率將飆升至68%,反映出企業對意外停機採取零容忍政策。
儘管電力能源產業成長放緩,但符合 IEEE C37.118 標準、GPS 同步的相量測量單元正被整合到電網現代化改造中,以穩定可再生能源的間歇性,預計到 2025 年將佔銷售額的 23.72%。在化學、金屬加工和食品製造業,由於安全、可追溯性和產量控制方面的要求,高密度感測器的部署仍在繼續。同時,航太、水處理和採礦業也在持續採購能夠承受惡劣環境的堅固耐用的感測器。
區域分析
北美地區受惠於數十年來汽車和航太領域PROFINET和EtherNet/IP技術的廣泛應用,預計2025年將佔全球銷售額的38.73%。 《晶片與科學法案》正在推動亞利桑那州和德克薩斯州的國內模擬感測器製造業發展,縮短前置作業時間並降低地緣政治風險。杜克能源等公共產業在2024年購買了價值80億美元的功率測量單元(PMU)和智慧電錶,這反映了旨在確保電網穩定的相關法規。在加拿大,每噸80加幣(60美元)的碳價正在累計能源測量設備的更新換代;而在墨西哥,電動車和電子產品產業近岸外包的快速擴張,在《美墨加協定》(USMCA)的框架下創造了新的需求。
亞太地區是成長最快的地區,複合年成長率達11.74%。中國的「中國製造2025」計畫旨在實現大型企業70%的數位化,這正在推動感測器技術的快速普及。印度透過向電子和製藥製造業投入260億美元的生產連結獎勵計畫,刺激了對製程感測器和視覺感測器的需求。在日本,儘管資料共用方面存在滯後,但由於其在機器人領域的優勢,高精度編碼器的訂單仍然強勁。在韓國,半導體製造廠正在採購環境感測器以維持一級無塵室的潔淨度。在東南亞國協,由於人事費用上升和本地工程師持續短缺,承包感測器套件正被廣泛採用。
在德國對「工業4.0」的投資以及歐盟「能源效率指令」(根據能源基準值提供資金支持)的推動下,歐洲也紛紛效法。西門子、ABB和Schneider Electric等供應商正利用其整合產品系列交叉銷售感測器和控制軟體,而像Schick AG和Peppel & Fuchs這樣的專業企業則在安全關鍵型和防爆領域佔據主導地位。英國脫歐後監管差異導致英國出口商向歐盟出口產品時合規成本增加。雖然南美洲、中東和非洲的普及速度較慢,但巴西的採礦業以及海灣國家的上游油氣計畫對無線振動感測器的需求日益成長,這些感測器用於監測偏遠地區(佈線不便)的資產。
其他好處:
- Excel格式的市場預測(ME)表
- 3個月的分析師支持
目錄
第1章:引言
- 研究假設和市場定義
- 調查範圍
第2章:調查方法
第3章執行摘要
第4章 市場狀況
- 市場概覽
- 市場促進因素
- 工業4.0/工業物聯網的應用正在快速成長。
- 對預測性維護和遠端監控的需求
- 以機器人為中心的智慧工廠的擴張
- 在遵守淨零排放和能源效率法規方面正在取得進展。
- 邊緣AI感測器節點可降低雲延遲。
- 現有工廠中IO-Link的廣泛應用浪潮
- 市場限制因素
- 巨額資本支出(CAPEX)和合併的複雜性。
- 網路連接感測器中的網路安全漏洞
- 全球半導體供應中斷的風險
- 有關數據主權的法規限制了跨境分析。
- 產業價值鏈分析
- 監理情勢
- 技術展望
- 波特五力分析
第5章 市場規模與成長預測
- 依感測器類型
- 流速
- 壓力
- 鄰近度/面積
- 等級
- 溫度
- 圖像/視覺
- 光電式
- 其他感測器類型
- 按最終用戶行業分類
- 化工/石油化工
- 採礦和金屬
- 電力和能源
- 食品/飲料
- 生命科學和製藥
- 航太/國防
- 供水/污水處理
- 其他終端用戶產業
- 透過技術
- 有線/模擬
- 有線/數字(智慧)
- 無線的
- 邊緣人工智慧/虛擬感測器
- 透過通訊協定
- 現場匯流排(PROFIBUS、Modbus)
- 工業乙太網(PROFINET、EtherNet/IP、EtherCAT)
- IO-Link
- 無線ICP(Wi-Sun、6LoWPAN、BLE-Mesh)
- 按地區
- 北美洲
- 美國
- 加拿大
- 墨西哥
- 南美洲
- 巴西
- 阿根廷
- 其他南美國家
- 歐洲
- 德國
- 英國
- 法國
- 義大利
- 西班牙
- 其他歐洲國家
- 亞太地區
- 中國
- 日本
- 印度
- 韓國
- ASEAN
- 其他亞太國家
- 中東和非洲
- 中東
- 沙烏地阿拉伯
- 阿拉伯聯合大公國
- 其他中東國家
- 非洲
- 南非
- 奈及利亞
- 其他非洲國家
- 中東
- 北美洲
第6章 競爭情勢
- 市場集中度
- 策略趨勢
- 市佔率分析
- 公司簡介
- Siemens AG
- Honeywell International Inc.
- Texas Instruments Incorporated
- Rockwell Automation Inc.
- Bosch Sensortec GmbH
- TE Connectivity Ltd.
- ABB Ltd.
- STMicroelectronics NV
- Infineon Technologies AG
- NXP Semiconductors NV
- Omron Corporation
- Sick AG
- Emerson Electric Co.
- Schneider Electric SE
- Balluff GmbH
- Pepperl+Fuchs SE
- Keyence Corporation
- IFM Electronic GmbH
- Yokogawa Electric Corporation
- Endress+Hauser AG
- Analog Devices Inc.
第7章 市場機會與未來展望
According to Mordor Intelligence, the industrial sensors market size is projected to be USD 27.39 billion in 2025, USD 30.01 billion in 2026, and reach USD 47.35 billion by 2031, growing at a CAGR of 9.55% from 2026 to 2031.
This report is Segmented by Sensor Type (Flow, Pressure, Proximity/Area, Level, and More), End-User Industry (Chemical and Petrochemicals, Mining and Metals, Power and Energy, and More), Technology (Wired/Analog, Wired/Digital Smart, Wireless, and More), Communication Protocol (Fieldbus, Industrial Ethernet, and More), and Geography. The Market Forecasts are Provided in Terms of Value (USD).
Global Industrial Sensors Market Trends and Insights
Industry 4.0 And IIoT Adoption Surge
Private-5G networks, OPC UA interoperability, and the IEC 63278-1 digital-twin standard are dissolving legacy data islands, letting factories stream sensor telemetry into unified analytics stacks. Siemens recorded an 18% uptick in Xcelerator subscriptions during 2024 as firms phased out standalone SCADA deployments in favor of cloud-native platforms that scale across multi-plant footprints. The shift from deterministic control loops to probabilistic inference allows early fault prediction, typically 7-14 days ahead, slashing emergency downtime. Still, small and medium manufacturers in ASEAN report capability gaps, with only 22% having in-house IIoT skills, which is driving turnkey "sensor-in-a-box" offerings.
Predictive-Maintenance And Remote-Monitoring Demand
Unplanned downtime costs G7 factories roughly USD 50 billion each year, prompting aggressive deployment of vibration, temperature, and acoustic sensors able to flag anomalies minutes after they appear. In pharmaceuticals, 68% of plants integrated predictive-maintenance sensors in 2024, up from 41% in 2022, delivering median productivity gains of 32%. Platforms such as Honeywell Forge grew connected assets by 23% in 2024 as remote technicians used augmented-reality headsets and live dashboards to troubleshoot equipment without traveling. Dragos, however, notes that 34% of 2024 ransomware incidents exploited vulnerable remote-access gateways, keeping cybersecurity front-of-mind.
High CAPEX And Integration Complexity
Total project costs extend well beyond sensor hardware to gateways, field infrastructure, middleware licenses, and system-integration labor. Even with Rockwell's auto-generated control code, a typical greenfield smart factory still demands 18-24 months and up to USD 1.3 billion, discouraging small and medium enterprises. Protocol heterogeneity inflates engineering hours, prompting higher uptake of vendor platforms such as Schneider's EcoStruxure that abstract multiple networks behind a single API.
Other drivers and restraints analyzed in the detailed report include:
- Robot-Centric Smart-Factory Expansion
- Rising Compliance With Net-Zero and Energy-Efficiency Mandates
- Cybersecurity Vulnerabilities of Networked Sensors
For complete list of drivers and restraints, kindly check the Table Of Contents.
Segment Analysis
Image and vision sensors are advancing at a 10.34% CAGR through 2031. The industrial sensors market size for this category was bolstered in 2025 by quality-inspection lines replacing human operators with convolutional networks that sustain line speeds above 1,000 parts per minute. Sony's 24.5-megapixel global-shutter CMOS chips, launched in 2024, give inspection systems the resolution needed to catch microscopic defects. Cognex reported that 37% of surveyed manufacturers intend to expand vision deployments within two years, citing accelerating zero-defect mandates.
Pressure sensors retained a 24.73% industrial sensors market share in 2025 thanks to their entrenched role in process-control loops across chemicals and petrochemicals. However, revenue growth is slowing as saturation in mature plants caps fresh installations. Flow meters built on Coriolis and ultrasonic principles are penetrating custody-transfer metering, edging out turbine designs. Proximity and area sensors ride the robotization wave, serving as safety interlocks and workpiece detectors, while specialized vibration and gas-leak sensors command premium price points in niche risk-mitigation roles.
The life sciences and pharmaceuticals segment is projected to record a 10.11% CAGR through 2031, the top growth trajectory among verticals. Process-analytical-technology sensors are essential for continuous manufacturing lines endorsed by the FDA's Emerging Technology Program. ISPE survey data show that predictive-maintenance adoption jumped to 68% in 2024, reflecting zero-tolerance for unplanned outages.
Power and energy, while slower growing, still represented 23.72% of 2025 revenue as grid-modernization efforts embed phasor measurement units synchronized via GPS under IEEE C37.118 to stabilize renewable intermittency. Chemical plants, metals operations, and food manufacturers remain sensor-dense due to safety, traceability, and yield-control requirements, whereas aerospace, water treatment, and mining continue to procure ruggedized transducers that survive extreme environments.
Complete Report Scope:
- By Sensor Type
- Flow
- Pressure
- Proximity / Area
- Level
- Temperature
- Image / Vision
- Photo-electric
- Other Sensor Types
- By End-user Industry
- Chemical and Petrochemicals
- Mining and Metals
- Power and Energy
- Food and Beverage
- Life Sciences and Pharmaceuticals
- Aerospace and Defense
- Water and Waste-water
- Other End-user Industries
- By Technology
- Wired / Analog
- Wired / Digital (Smart)
- Wireless
- Edge-AI / Virtual Sensors
- By Communication Protocol
- Fieldbus (PROFIBUS, Modbus)
- Industrial Ethernet (PROFINET, EtherNet/IP, EtherCAT)
- IO-Link
- Wireless ICPs (Wi-Sun, 6LoWPAN, BLE-Mesh)
- By Geography
- North America
- United States
- Canada
- Mexico
- South America
- Brazil
- Argentina
- Rest of South America
- Europe
- Germany
- United Kingdom
- France
- Italy
- Spain
- Rest of Europe
- Asia-Pacific
- China
- Japan
- India
- South Korea
- ASEAN
- Rest of Asia-Pacific
- Middle East and Africa
- Middle East
- Saudi Arabia
- United Arab Emirates
- Rest of Middle East
- Africa
- South Africa
- Nigeria
- Rest of Africa
- Middle East
- North America
Geography Analysis
North America controlled 38.73% of 2025 revenue, lifted by decades of PROFINET and EtherNet/IP deployments in automotive and aerospace. The CHIPS and Science Act is catalyzing domestic analog-sensor fabrication in Arizona and Texas, which shortens lead times and mitigates geopolitical risk. Utilities such as Duke Energy earmarked USD 8 billion in 2024 for PMUs and smart meters, reflecting grid-stability mandates. Canada's CAD 80 per-tonne (USD 60) carbon price drives energy-metering retrofits, while Mexico's nearshoring boom in EVs and electronics creates fresh demand under USMCA provisions.
Asia-Pacific is the fastest-growing region at an 11.74% CAGR. China's Made in China 2025 plan aims for 70% digitalization of large enterprises, fueling steep sensor uptake. India channeled USD 26 billion of Production-Linked Incentives into electronics and pharma manufacturing, lifting demand for process and vision sensors. Japan's strength in robotics, despite lagging data-sharing, sustains high-accuracy encoder orders, and South Korea's semiconductor fabs procure environmental sensors that maintain class 1 cleanrooms. ASEAN economies absorb turnkey sensor kits as labor costs rise and local skill shortages persist.
Europe follows closely, propelled by Germany's Industrie 4.0 investments and the EU's Energy Efficiency Directive, which predicates funding on metered energy baselines. Vendors such as Siemens, ABB, and Schneider leverage integrated portfolios to cross-sell sensors and control software, while niche players Sick AG and Pepperl+Fuchs dominate safety-critical and explosion-proof niches. Regulatory divergence post-Brexit raises compliance costs for U.K. exporters shipping into the EU. South America and the Middle East and Africa trail in adoption, though Brazil's mining and the Gulf's upstream oil and gas projects increasingly specify wireless vibration sensors to monitor remote assets where rewiring is impractical.
- Siemens AG
- Honeywell International Inc.
- Texas Instruments Incorporated
- Rockwell Automation Inc.
- Bosch Sensortec GmbH
- TE Connectivity Ltd.
- ABB Ltd.
- STMicroelectronics N.V.
- Infineon Technologies AG
- NXP Semiconductors N.V.
- Omron Corporation
- Sick AG
- Emerson Electric Co.
- Schneider Electric SE
- Balluff GmbH
- Pepperl+Fuchs SE
- Keyence Corporation
- IFM Electronic GmbH
- Yokogawa Electric Corporation
- Endress+Hauser AG
- Analog Devices Inc.
Additional Benefits:
- The market estimate (ME) sheet in Excel format
- 3 months of analyst support
TABLE OF CONTENTS
1 INTRODUCTION
- 1.1 Study Assumptions and Market Definition
- 1.2 Scope of the Study
2 RESEARCH METHODOLOGY
3 EXECUTIVE SUMMARY
4 MARKET LANDSCAPE
- 4.1 Market Overview
- 4.2 Market Drivers
- 4.2.1 Industry 4.0 / IIoT adoption surge
- 4.2.2 Predictive-maintenance and remote-monitoring demand
- 4.2.3 Robot-centric smart-factory expansion
- 4.2.4 Rising compliance with net-zero and energy-efficiency mandates
- 4.2.5 Edge-AI sensor nodes cut cloud latency
- 4.2.6 IO-Link retrofit wave in brown-field plants
- 4.3 Market Restraints
- 4.3.1 High CAPEX and integration complexity
- 4.3.2 Cyber-security vulnerabilities of networked sensors
- 4.3.3 Global semiconductor-supply disruption risk
- 4.3.4 Data-sovereignty rules limit cross-border analytics
- 4.4 Industry Value Chain Analysis
- 4.5 Regulatory Landscape
- 4.6 Technological Outlook
- 4.7 Porter's Five Forces Analysis
- 4.7.1 Bargaining Power of Suppliers
- 4.7.2 Bargaining Power of Buyers
- 4.7.3 Threat of New Entrants
- 4.7.4 Threat of Substitutes
- 4.7.5 Intensity of Competitive Rivalry
- 4.7.6 Assessment of Macroeconomic Trends on Market
5 MARKET SIZE AND GROWTH FORECASTS (VALUE)
- 5.1 By Sensor Type
- 5.1.1 Flow
- 5.1.2 Pressure
- 5.1.3 Proximity / Area
- 5.1.4 Level
- 5.1.5 Temperature
- 5.1.6 Image / Vision
- 5.1.7 Photo-electric
- 5.1.8 Other Sensor Types
- 5.2 By End-user Industry
- 5.2.1 Chemical and Petrochemicals
- 5.2.2 Mining and Metals
- 5.2.3 Power and Energy
- 5.2.4 Food and Beverage
- 5.2.5 Life Sciences and Pharmaceuticals
- 5.2.6 Aerospace and Defense
- 5.2.7 Water and Waste-water
- 5.2.8 Other End-user Industries
- 5.3 By Technology
- 5.3.1 Wired / Analog
- 5.3.2 Wired / Digital (Smart)
- 5.3.3 Wireless
- 5.3.4 Edge-AI / Virtual Sensors
- 5.4 By Communication Protocol
- 5.4.1 Fieldbus (PROFIBUS, Modbus)
- 5.4.2 Industrial Ethernet (PROFINET, EtherNet/IP, EtherCAT)
- 5.4.3 IO-Link
- 5.4.4 Wireless ICPs (Wi-Sun, 6LoWPAN, BLE-Mesh)
- 5.5 By Geography
- 5.5.1 North America
- 5.5.1.1 United States
- 5.5.1.2 Canada
- 5.5.1.3 Mexico
- 5.5.2 South America
- 5.5.2.1 Brazil
- 5.5.2.2 Argentina
- 5.5.2.3 Rest of South America
- 5.5.3 Europe
- 5.5.3.1 Germany
- 5.5.3.2 United Kingdom
- 5.5.3.3 France
- 5.5.3.4 Italy
- 5.5.3.5 Spain
- 5.5.3.6 Rest of Europe
- 5.5.4 Asia-Pacific
- 5.5.4.1 China
- 5.5.4.2 Japan
- 5.5.4.3 India
- 5.5.4.4 South Korea
- 5.5.4.5 ASEAN
- 5.5.4.6 Rest of Asia-Pacific
- 5.5.5 Middle East and Africa
- 5.5.5.1 Middle East
- 5.5.5.1.1 Saudi Arabia
- 5.5.5.1.2 United Arab Emirates
- 5.5.5.1.3 Rest of Middle East
- 5.5.5.2 Africa
- 5.5.5.2.1 South Africa
- 5.5.5.2.2 Nigeria
- 5.5.5.2.3 Rest of Africa
- 5.5.5.1 Middle East
- 5.5.1 North America
6 COMPETITIVE LANDSCAPE
- 6.1 Market Concentration
- 6.2 Strategic Moves
- 6.3 Market Share Analysis
- 6.4 Company Profiles (includes Global level Overview, Market level overview, Core Segments, Financials as available, Strategic Information, Market Rank/Share for key companies, Products and Services, and Recent Developments)
- 6.4.1 Siemens AG
- 6.4.2 Honeywell International Inc.
- 6.4.3 Texas Instruments Incorporated
- 6.4.4 Rockwell Automation Inc.
- 6.4.5 Bosch Sensortec GmbH
- 6.4.6 TE Connectivity Ltd.
- 6.4.7 ABB Ltd.
- 6.4.8 STMicroelectronics N.V.
- 6.4.9 Infineon Technologies AG
- 6.4.10 NXP Semiconductors N.V.
- 6.4.11 Omron Corporation
- 6.4.12 Sick AG
- 6.4.13 Emerson Electric Co.
- 6.4.14 Schneider Electric SE
- 6.4.15 Balluff GmbH
- 6.4.16 Pepperl+Fuchs SE
- 6.4.17 Keyence Corporation
- 6.4.18 IFM Electronic GmbH
- 6.4.19 Yokogawa Electric Corporation
- 6.4.20 Endress+Hauser AG
- 6.4.21 Analog Devices Inc.
7 MARKET OPPORTUNITIES AND FUTURE OUTLOOK
- 7.1 White-space and Unmet-need Assessment

 亞太地區工業感測器:市場佔有率分析、產業趨勢與統計及成長預測(2026-2031)印度工業感測器和變送器:市場佔有率分析、行業趨勢和統計數據以及成長預測(2026-2031 年)
 工業感測器市場-2026-2032年全球市場預測
 2026-2030年全球工業感測器市場
 工業感測器和自動化市場預測至2034年—按感測器類型、技術、產業、應用、最終用戶和地區分類的全球分析
 工業感測器市場-全球市場規模、佔有率、趨勢、機會和預測:按產品、應用、地區和競爭對手分類,2021-2031年美國工業感測器:市場佔有率分析、產業趨勢與統計及成長預測(2026-2031 年)
 工業感測器市場規模、佔有率和趨勢分析報告:按感測器類型、技術、最終用途、地區和細分市場預測(2025-2033 年)
 工業感測器市場:按檢測方法、終端用戶產業和地區分類
 工業感測器市場機會、成長要素、產業趨勢分析及2026年至2035年預測