

 |
市場調查報告書
商品編碼
1959591
工業感測器市場機會、成長要素、產業趨勢分析及2026年至2035年預測Industrial Sensor Market Opportunity, Growth Drivers, Industry Trend Analysis, and Forecast 2026 - 2035 |
||||||
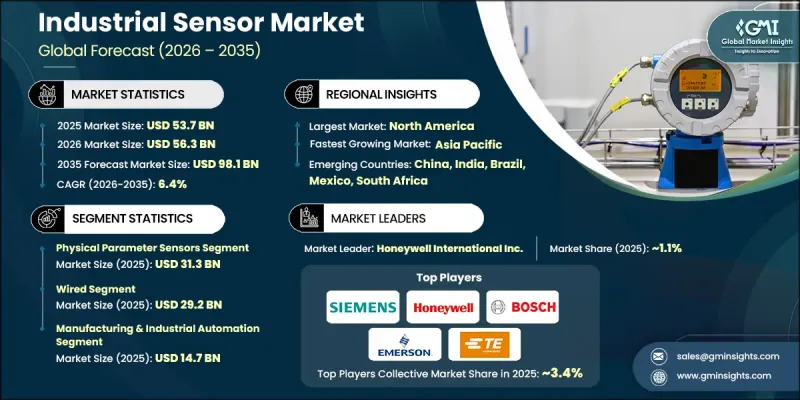
2025 年全球工業感測器市場價值為 537 億美元,預計到 2035 年將達到 981 億美元,年複合成長率為 6.4%。
工業感測器已成為現代製造業、能源、航太和物流運作中不可或缺的一部分,能夠對機械、流程和環境狀況進行精確的監控和控制。隨著工業環境日益複雜和自動化,對即時數據和情境察覺的需求也日益成長。這些感測器使企業能夠追蹤設備性能、確保符合安全標準並維持流程效率。除了產量不斷成長之外,智慧製造、工業IoT和預測性維護解決方案的日益普及也進一步推動了市場需求。如今,企業不僅依賴感測器技術來提高營運可靠性,還將其用於流程最佳化、早期故障檢測以及與分析平台的無縫整合。對更高精度、效率和永續性的追求,持續推動全球各工業領域的創新與應用。
| 市場範圍 | |
|---|---|
| 開始年份 | 2025 |
| 預測年份 | 2026-2035 |
| 起始值 | 537億美元 |
| 預測金額 | 981億美元 |
| 複合年成長率 | 6.4% |
預計2025年,物理參數感測器市場規模將達到313億美元。物理參數感測器憑藉其高精度測量力、扭矩、壓力、振動和溫度的能力,在市場上佔據領先地位。這些感測器對於防止停機、維持運作效率以及實現工業機械和生產線的預測性維護至關重要。它們在惡劣環境下的耐用性以及與自動化系統的兼容性,使其在製造業、能源和航太應用領域不可或缺。
到2025年,有線感測器市場規模將達到292億美元。有線感測器因其可靠的數據傳輸、堅固耐用和抗干擾能力而備受歡迎。在工業設施、加工廠和能源企業中,有線解決方案因其能夠提供不間斷且準確的資料流而成為持續監控的首選。與現有自動化基礎設施的兼容性確保了即使在惡劣環境下也能穩定運作。
預計到2025年,北美工業感測器市場佔有率將達到35.2%。這一區域成長主要得益於對智慧製造、互聯工廠和工業自動化解決方案的投資。各公司正加速採用物聯網、人工智慧和進階分析技術,以最佳化流程、減少停機時間並提高安全性。此外,監管合規、能源效率和永續性措施也在推動高精度、特定應用感測器的應用,進一步鞏固了北美在工業感測器市場的主導地位。
目錄
第1章:調查方法和範圍
第2章執行摘要
第3章業界考察
- 生態系分析
- 供應商情況
- 利潤率分析
- 成本結構
- 每個階段增加的價值
- 影響價值鏈的因素
- 中斷
- 影響產業的因素
- 促進因素
- 擴大工業自動化和智慧製造的應用
- 物聯網和工業物聯網 (IIoT) 技術的融合
- 對預測性維護和即時監控的需求日益成長
- 拓展可再生能源和先進電力系統領域
- 嚴格遵守規章制度和安全標準
- 產業潛在風險與挑戰
- 初始投資高且整合複雜
- 資料安全和可靠性問題
- 市場機遇
- 智慧工廠和工業4.0舉措的實施
- 可再生能源和先進電力系統的擴展
- 促進因素
- 成長潛力分析
- 監管環境
- 北美洲
- 歐洲
- 亞太地區
- 拉丁美洲
- 中東和非洲
- 波特的分析
- PESTEL 分析
- 科技與創新趨勢
- 當前技術趨勢
- 新興技術
- 價格趨勢
- 按地區
- 依產品
- 定價策略
- 新興經營模式
- 合規要求
- 地緣政治和貿易趨勢
第4章 競爭情勢
- 介紹
- 企業市佔率分析
- 按地區
- 北美洲
- 歐洲
- 亞太地區
- 拉丁美洲
- 中東和非洲
- 按地區
- 主要企業的競爭標竿分析
- 財務績效比較
- 收入
- 利潤率
- 研究與開發
- 產品系列比較
- 產品線的廣度
- 科技
- 創新
- 區域分佈比較
- 全球擴張分析
- 服務網路覆蓋
- 按地區分類的市場滲透率
- 競爭定位矩陣
- 領導企業
- 受讓人
- 追蹤者
- 小眾玩家
- 戰略展望矩陣
- 財務績效比較
- 2022-2025 年重大發展
- 併購
- 合作夥伴關係和合資企業
- 技術進步
- 擴張和投資策略
- 數位轉型計劃
- 新興/Start-Ups競爭對手的發展趨勢
第5章 市場估算與預測:依感測器類型分類,2022-2035年
- 物理參數感測器
- 溫度感測器
- 壓力感測器
- 流量感測器
- 液位感測器
- 位置和運動感應器
- 接近感測器
- 電感式和電容式接近感測器
- 光學/光電感測器
- 環境監測感測器
- 濕度/水分感測器
- 振動/狀態感測器
- 氣體和化學感測器
第6章 市場估計與預測:依技術分類,2022-2035年
- 微電子機械系統(MEMS)
- 光/光子
- 電化學
- 機械的
- 電磁學
- 超音波/聲學
- 其他
第7章 市場估計與預測:以連結方式分類,2022-2035年
- 有線
- 無線的
第8章 市場估算與預測:依最終用途產業分類,2022-2035年
- 化工/石油化工
- 能源與電力
- 食品/飲料
- 製造和工業自動化
- 金屬和採礦
- 石油和天然氣
- 製藥
- 汽車/運輸設備
- 水處理和污水處理
- 其他
第9章 市場估計與預測:依地區分類,2022-2035年
- 北美洲
- 美國
- 加拿大
- 歐洲
- 德國
- 英國
- 法國
- 西班牙
- 義大利
- 荷蘭
- 亞太地區
- 中國
- 印度
- 日本
- 澳洲
- 韓國
- 拉丁美洲
- 巴西
- 墨西哥
- 阿根廷
- 中東和非洲
- 南非
- 沙烏地阿拉伯
- 阿拉伯聯合大公國
第10章:公司簡介
- ABB Ltd.
- Allegro MicroSystems, Inc.
- Balluff GmbH
- Banner Engineering
- Bosch Group
- Endress+Hauser Group Services AG
- Emerson Electric Co.
- Honeywell International Inc.
- ifm electronic gmbh
- Keyence Corporation
- LEM Holding
- Melexis
- OMRON Corporation
- Panasonic Industry
- Pepperl+Fuchs SE
- Rockwell Automation, Inc.
- SICK AG
- Sensatec GmbH
- Sensata Technologies
- Schneider Electric SE
- Siemens AG
- STMicroelectronics
- TE Connectivity
- Texas Instruments
- Turck Group
The Global Industrial Sensor Market was valued at USD 53.7 billion in 2025 and is estimated to grow at a CAGR of 6.4% to reach USD 98.1 billion by 2035.
Industrial sensors have become integral to modern manufacturing, energy, aerospace, and logistics operations, enabling precise monitoring and control of machinery, processes, and environmental conditions. As industrial environments grow more complex and automated, the need for real-time data and situational awareness has intensified. These sensors allow organizations to track equipment performance, ensure safety compliance, and maintain process efficiency. Increasing production volumes, coupled with rising adoption of smart manufacturing, industrial IoT, and predictive maintenance solutions, are further boosting demand. Companies now rely on sensor technology not only for operational reliability but also for process optimization, early fault detection, and seamless integration with analytics platforms. The push for higher precision, efficiency, and sustainability continues to drive innovation and deployment across global industrial sectors.
| Market Scope | |
|---|---|
| Start Year | 2025 |
| Forecast Year | 2026-2035 |
| Start Value | $53.7 Billion |
| Forecast Value | $98.1 Billion |
| CAGR | 6.4% |
The physical parameter sensors segment generated USD 31.3 billion in 2025. Physical parameter sensors dominate due to their ability to provide high-precision measurements of force, torque, pressure, vibration, and temperature. These sensors are crucial for preventing downtime, maintaining operational efficiency, and enabling predictive maintenance in industrial machinery and production lines. Their durability in harsh conditions and compatibility with automation systems make them indispensable across manufacturing, energy, and aerospace applications.
The wired segment held USD 29.2 billion in 2025. Wired sensors remain popular due to their reliable data transmission, robustness, and resistance to interference. Industrial facilities, processing plants, and energy operations prefer wired solutions for continuous monitoring, where uninterrupted and accurate data flow is critical. Their compatibility with existing automation infrastructure ensures consistent performance in challenging environments.
North America Industrial Sensor Market accounted for 35.2% share in 2025. Growth in this region is fueled by investments in smart manufacturing, connected factories, and industrial automation solutions. Companies are increasingly implementing IoT, AI, and advanced analytics to optimize processes, reduce downtime, and improve safety. Regulatory compliance, energy efficiency, and sustainability initiatives are also driving the adoption of high-precision and application-specific sensors, strengthening North America's leadership in the industrial sensor market.
Prominent players in the Global Industrial Sensor Market include ABB Ltd., Allegro MicroSystems, Inc., Balluff GmbH, Banner Engineering, Bosch Group, Endress+Hauser Group Services AG, Emerson Electric Co., Honeywell International Inc., ifm electronic gmbh, Keyence Corporation, LEM Holding, Melexis, OMRON Corporation, Panasonic Industry, Pepperl+Fuchs SE, Rockwell Automation, Inc., SICK AG, Sensatec GmbH, Sensata Technologies, Schneider Electric SE, Siemens AG, STMicroelectronics, TE Connectivity, Texas Instruments, and Turck Group. Key strategies adopted by industrial sensor companies to strengthen market presence include expanding R&D to develop high-precision and application-specific sensors, integrating AI and IoT capabilities for predictive maintenance and process optimization, and forming partnerships with industrial automation and manufacturing solution providers. Companies focus on enhancing reliability, durability, and performance under harsh operating conditions, while also improving energy efficiency and reducing costs. Geographic expansion, targeting emerging industrial markets, and compliance with regional standards help increase global reach. Businesses are leveraging direct sales, distribution networks, and digital platforms to improve customer engagement, ensure quick deployment, and provide value-added services. Product innovation, service support, and sustainable manufacturing practices further solidify market position and long-term competitiveness.
Table of Contents
Chapter 1 Methodology and Scope
- 1.1 Market scope and definition
- 1.2 Research design
- 1.2.1 Research approach
- 1.2.2 Data collection methods
- 1.3 Data mining sources
- 1.3.1 Global
- 1.3.2 Regional/Country
- 1.4 Base estimates and calculations
- 1.4.1 Base year calculation
- 1.4.2 Key trends for market estimation
- 1.5 Primary research and validation
- 1.5.1 Primary sources
- 1.6 Forecast model
- 1.7 Research assumptions and limitations
Chapter 2 Executive Summary
- 2.1 Industry 360° synopsis, 2022 - 2035
- 2.2 Key market trends
- 2.2.1 Sensor type trends
- 2.2.2 Technology trends
- 2.2.3 Connectivity trends
- 2.2.4 End Use industry trends
- 2.2.5 Regional trends
- 2.3 TAM analysis, 2025-2035
- 2.4 CXO perspectives: Strategic imperatives
Chapter 3 Industry Insights
- 3.1 Industry ecosystem analysis
- 3.1.1 Supplier landscape
- 3.1.2 Profit margin analysis
- 3.1.3 Cost structure
- 3.1.4 Value addition at each stage
- 3.1.5 Factor affecting the value chain
- 3.1.6 Disruptions
- 3.2 Industry impact forces
- 3.2.1 Growth drivers
- 3.2.1.1 Increasing Adoption of Industrial Automation and Smart Manufacturing
- 3.2.1.2 Integration of IoT and Industrial Internet of Things (IIoT) Technologies
- 3.2.1.3 Rising Demand for Predictive Maintenance and Real-Time Monitoring
- 3.2.1.4 Expansion in Renewable Energy and Advanced Power Generation Systems
- 3.2.1.5 Stringent Regulatory Compliance and Safety Standards
- 3.2.2 Industry pitfalls and challenges
- 3.2.2.1 High Initial Investment and Integration Complexity
- 3.2.2.2 Data Security and Reliability Concerns
- 3.2.3 Market opportunities
- 3.2.3.1 Adoption of Smart Factories and Industry 4.0 Initiatives
- 3.2.3.2 Expansion in Renewable Energy and Advanced Power Systems
- 3.2.1 Growth drivers
- 3.3 Growth potential analysis
- 3.4 Regulatory landscape
- 3.4.1 North America
- 3.4.2 Europe
- 3.4.3 Asia Pacific
- 3.4.4 Latin America
- 3.4.5 Middle East & Africa
- 3.5 Porter’s analysis
- 3.6 PESTEL analysis
- 3.7 Technology and innovation landscape
- 3.7.1 Current technological trends
- 3.7.2 Emerging technologies
- 3.8 Price trends
- 3.8.1 By region
- 3.8.2 By product
- 3.9 Pricing Strategies
- 3.10 Emerging Business Models
- 3.11 Compliance Requirements
- 3.12 Geopolitical and trade dynamics
Chapter 4 Competitive Landscape, 2025
- 4.1 Introduction
- 4.2 Company market share analysis
- 4.2.1 By region
- 4.2.1.1 North America
- 4.2.1.2 Europe
- 4.2.1.3 Asia Pacific
- 4.2.1.4 Latin America
- 4.2.1.5 Middle East & Africa
- 4.2.1 By region
- 4.3 Competitive benchmarking of key players
- 4.3.1 Financial performance comparison
- 4.3.1.1 Revenue
- 4.3.1.2 Profit margin
- 4.3.1.3 R&D
- 4.3.2 Product portfolio comparison
- 4.3.2.1 Product range breadth
- 4.3.2.2 Technology
- 4.3.2.3 Innovation
- 4.3.3 Geographic presence comparison
- 4.3.3.1 Global footprint analysis
- 4.3.3.2 Service network coverage
- 4.3.3.3 Market penetration by region
- 4.3.4 Competitive positioning matrix
- 4.3.4.1 Leaders
- 4.3.4.2 Challengers
- 4.3.4.3 Followers
- 4.3.4.4 Niche players
- 4.3.5 Strategic outlook matrix
- 4.3.1 Financial performance comparison
- 4.4 Key developments, 2022-2025
- 4.4.1 Mergers and acquisitions
- 4.4.2 Partnerships and collaborations
- 4.4.3 Technological advancements
- 4.4.4 Expansion and investment strategies
- 4.4.5 Digital transformation initiatives
- 4.5 Emerging/ startup competitors landscape
Chapter 5 Market Estimates and Forecast, By Sensor Type, 2022 - 2035 (USD Billion)
- 5.1 Key trends
- 5.2 Physical Parameter Sensors
- 5.2.1 Temperature Sensors
- 5.2.2 Pressure Sensors
- 5.2.3 Flow Sensors
- 5.2.4 Level Sensors
- 5.2.5 Position & Motion Sensors
- 5.3 Proximity Sensors
- 5.3.1 Inductive & Capacitive Proximity
- 5.3.2 Optical / Photoelectric Sensors
- 5.4 Environmental Monitoring Sensors
- 5.4.1 Humidity & Moisture Sensors
- 5.4.2 Vibration & Condition Sensors
- 5.4.3 Gas & Chemical Sensors
Chapter 6 Market Estimates and Forecast, By Technology, 2022 - 2035 (USD Billion)
- 6.1 Key trends
- 6.2 MEMS (Micro-Electro-Mechanical Systems)
- 6.3 Optical/Photonic
- 6.4 Electrochemical
- 6.5 Mechanical
- 6.6 Electromagnetic
- 6.7 Ultrasonic/Acoustic
- 6.8 Others
Chapter 7 Market Estimates and Forecast, By Connectivity, 2022 - 2035 (USD Billion)
- 7.1 Key trends
- 7.2 Wired
- 7.3 Wireless
Chapter 8 Market Estimates and Forecast, By End-use Industry, 2022 - 2035 (USD Billion)
- 8.1 Key trends
- 8.2 Chemicals & Petrochemicals
- 8.3 Energy & Power
- 8.4 Food & Beverage
- 8.5 Manufacturing & Industrial Automation
- 8.6 Metals & Mining
- 8.7 Oil & Gas
- 8.8 Pharmaceuticals
- 8.9 Automotive & Transportation
- 8.10 Water & Wastewater Treatment
- 8.11 Others
Chapter 9 Market Estimates and Forecast, By Region, 2022 - 2035 (USD Billion)
- 9.1 Key trends
- 9.2 North America
- 9.2.1 U.S.
- 9.2.2 Canada
- 9.3 Europe
- 9.3.1 Germany
- 9.3.2 UK
- 9.3.3 France
- 9.3.4 Spain
- 9.3.5 Italy
- 9.3.6 Netherlands
- 9.4 Asia Pacific
- 9.4.1 China
- 9.4.2 India
- 9.4.3 Japan
- 9.4.4 Australia
- 9.4.5 South Korea
- 9.5 Latin America
- 9.5.1 Brazil
- 9.5.2 Mexico
- 9.5.3 Argentina
- 9.6 Middle East and Africa
- 9.6.1 South Africa
- 9.6.2 Saudi Arabia
- 9.6.3 UAE
Chapter 10 Company Profiles
- 10.1 ABB Ltd.
- 10.2 Allegro MicroSystems, Inc.
- 10.3 Balluff GmbH
- 10.4 Banner Engineering
- 10.5 Bosch Group
- 10.6 Endress+Hauser Group Services AG
- 10.7 Emerson Electric Co.
- 10.8 Honeywell International Inc.
- 10.9 ifm electronic gmbh
- 10.10 Keyence Corporation
- 10.11 LEM Holding
- 10.12 Melexis
- 10.13 OMRON Corporation
- 10.14 Panasonic Industry
- 10.15 Pepperl+Fuchs SE
- 10.16 Rockwell Automation, Inc.
- 10.17 SICK AG
- 10.18 Sensatec GmbH
- 10.19 Sensata Technologies
- 10.20 Schneider Electric SE
- 10.21 Siemens AG
- 10.22 STMicroelectronics
- 10.23 TE Connectivity
- 10.24 Texas Instruments
- 10.25 Turck Group
 工業感測器和自動化市場預測至2034年—按感測器類型、技術、產業、應用、最終用戶和地區分類的全球分析
 工業感測器市場-全球市場規模、佔有率、趨勢、機會和預測:按產品、應用、地區和競爭對手分類,2021-2031年
 美國工業感測器:市場佔有率分析、產業趨勢與統計及成長預測(2026-2031 年)
 工業感測器市場規模、佔有率和趨勢分析報告:按感測器類型、技術、最終用途、地區和細分市場預測(2025-2033 年)
 工業感測器市場:2026-2032年全球市場預測(按感測器類型、技術、通訊協定、應用和銷售管道)
 工業感測器市場:按檢測方法、終端用戶產業和地區分類
 半導體氣體感測器市場分析及預測至 2035 年:按類型、產品、技術、應用、材料類型、最終用戶、功能和安裝類型分類。工業感測器市場分析及預測(至2035年):依類型、產品類型、技術、組件、應用、最終用戶、功能、安裝類型、設備及解決方案分類中國工業感測器市場:市場佔有率分析、產業趨勢與統計、成長預測(2026-2031)
 日本工業自動化感測器市場規模、佔有率、趨勢及預測(按感測器類型、類型、自動化模式、最終用戶和地區分類,2026-2034年)