


 |
市場調查報告書
商品編碼
2124741
歐洲廂型車:市場佔有率分析、產業趨勢與統計數據、成長預測(2026-2031 年)Europe Van - Market Share Analysis, Industry Trends & Statistics, Growth Forecasts (2026 - 2031) |
||||||

※ 本網頁內容可能與最新版本有所差異。詳細情況請與我們聯繫。
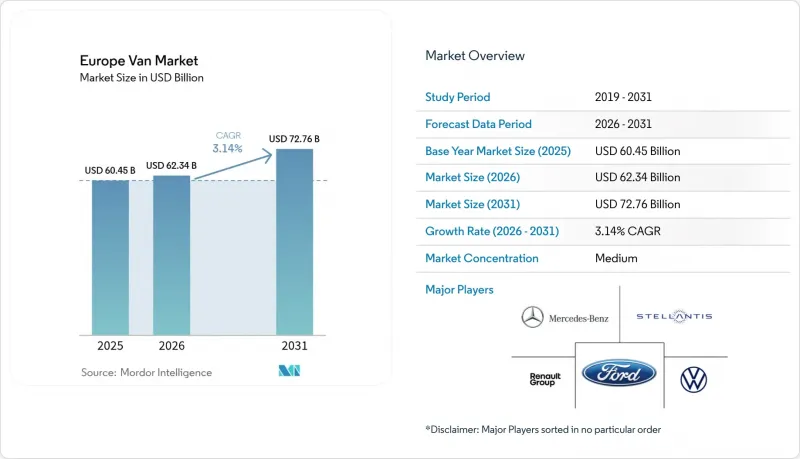
根據 Mordor Intelligence 預測,歐洲貨車市場規模預計在 2025 年達到 604.5 億美元,2026 年達到 623.4 億美元,到 2031 年達到 727.6 億美元,2026 年至 2031 年的複合年成長率為 3.14%。
本報告按車輛總重(N1 I 類、N1 II 類及其他)、貨艙容積(小於 5 立方米、大於 5 立方米)、最終用戶(商用車隊、政府/市政部門及其他)、動力系統(汽油內燃機、柴油內燃機及其他)、銷售管道(直接銷售給 OEM 車隊、授權經銷商及其他)和國家/地區進行細分。市場預測以價值(美元)和銷售(輛)為單位呈現。
歐洲廂型車市場的趨勢與洞察
電動貨車銷量成長
2024年,由於補助削減,純電動貨車僅佔新車註冊量的5.9%,但隨著企業在車隊中採用純電動貨車的義務加強,2025年上半年這一比例回升至9.5%。清潔車輛指令規定,公共機構自2026年起必須購買零排放貨車,確保了市場需求的穩定。 2024年至2026年間,汽車製造商推出了新的純電動車車型,進一步拓展了負載容量選擇範圍。在英國,一旦車輛達到一定的里程標準,其總擁有成本(TCO)就與柴油車相當。許多車隊營運商在短時間內就實現了這一目標。儘管充電基礎設施有其局限性,但這種採購趨勢的轉變正促使人們更傾向於選擇零排放車輛而非柴油車。
電子商務最後一公里配送的快速發展。
預計到2030年,西歐的小包裹量將顯著成長。這一成長將促使車隊營運商擴大選擇小型貨車,以便在狹窄的都市區穿梭,並增加每日配送次數。預計到2024年,自動小包裹櫃的數量將會增加,凸顯了頻繁、低負載容量配送的趨勢。像Otto Group這樣的業者表示,與柴油車相比,使用緊湊型純電動貨車可以提高配送效率。快速電商公司正在策略性地將微型倉配中心部署在更靠近消費者的位置,這進一步推動了對小型貨車的需求。由於配送頻率比載貨量更為重要,汽車製造商(OEM)正致力於改善溫度控管和快速充電功能,而不是簡單地增加載貨量。
電池和車輛的高資本支出 (CAPEX)
在英國,純電動貨車的價格仍然遠高於柴油車。雖然預計高里程用戶在幾年內就能看到總成本與柴油車持平,但對於小規模車輛車主來說,這可能需要更長時間,阻礙了純電動貨車的快速普及。儘管近年來電池組價格有所下降,但原物料價格的穩定減緩了價格進一步降低的趨勢。德國取消補貼後,預計2024年純電動貨車註冊量將會下滑,凸顯了這些政策的脆弱性。租賃可以降低初始成本,但殘值風險會轉移給租賃公司,而租賃公司會將這種不確定性計入月租費中。
細分市場分析
2025年,N1類I型貨車(總重低於2噸)佔了50.33%的市場佔有率,佔據主導地位。預計到2031年,這類貨車將以3.85%的複合年成長率穩定成長,顯示電子商務產業更傾向於選擇機動性強、適合在狹窄城市空間穿梭的車輛。隨著配送公司不斷調整以滿足都市區配送需求,II類貨車也日益受到關注。這類貨車擴大用於都市區運營,並且正在擴大規模以適應更廣泛的區域運營。 III類貨車主要用於建築和公共產業領域,面臨電池重量帶來的挑戰。例如,75千瓦時的電池組會增加450公斤的重量,這使得一些純電動車車型被歸類在更高的級別,並降低了其實際有效載荷能力。
Stellantis透過引進複合材料貨廂來應對這項挑戰,成功減重60公斤。現行駕照規定允許持有標準B類駕照的駕駛員駕駛總重不超過3.5噸的貨車,但部分州對更重的純電動車(BEV)增加了額外的測試,使合規性變得更加複雜。梅賽德斯-奔馳提供模組化電池容量,使車隊營運商能夠靈活地在統一底盤上選擇續航里程和負載容量。隨著都市區零排放區法規的日益嚴格,輕型貨車在歐洲貨車市場越來越受歡迎。
到2025年,容積超過5立方公尺的廂型車將佔據64.11%的市場。這主要是由於小包裹遞送公司和手工藝者需要更大的貨物空間來運輸大件商品。儘管廂型車的成長率以顯著的複合年成長率(CAGR)呈現強勁成長,但容積小於5立方公尺的緊湊型廂型車的成長率僅為5.01%,這主要得益於快速電商平台對頻繁營運的重視。由於都市區高密度需求,緊湊型廂型車市場預計將快速擴張。雷諾Master E-Tech提供高達22立方公尺的載貨空間和130千瓦時的電池,即使滿載也能維持250公里的續航里程。
另一方面,Stellantis 的 e-Berlingo 提供 4.4 立方公尺的貨艙空間,符合巴黎和米蘭居住者停車許可證的要求,從而減輕了營運負擔。模組化貨架使車隊能夠在幾分鐘內切換貨架式和開放式貨艙,提高資產利用率,並模糊了傳統細分市場之間的界限。隨著靈活的內部空間在有效載荷負載容量中變得比簡單的容量更重要,原始設備製造商 (OEM) 開始銷售可配置的貨艙和免工具緊固系統。
其他好處:
- Excel格式的市場預測(ME)表
- 3個月的分析師支持
目錄
第1章:引言
- 研究假設和市場定義
- 調查範圍
第2章:調查方法
第3章執行摘要
第4章 市場狀況
- 市場概覽
- 市場促進因素
- 電動貨車銷量成長
- 電子商務的「最後一公里」繁榮
- 歐盟關於低排放區的強制規定
- 面向滑板車製造商的電動車平台
- 在都市區引入微型倉配
- 電池即服務 (BaaS) 車隊模式
- 市場限制因素
- 電池和汽車相關設備的高資本支出(CAPEX)。
- 充電站數量有限
- 半導體供應受限
- 促進要素短缺及駕照管理規定
- 價值供應鏈分析
- 監理情勢
- 技術展望
- 波特五力模型
第5章 市場規模與成長預測
- 按車輛總重量
- N1 類 I 級(2 噸以下)
- N1 II 類(2-2.5 噸)
- N1 III 級(2.5-3.5 噸)
- 透過貨艙
- 5立方米或更少
- 超過 5 立方米
- 最終用戶
- 商用車隊
- 政府/市政當局
- 租賃公司
- 透過驅動系統
- 內燃機/汽油
- 內燃機和柴油引擎
- 電池式電動車
- 油電混合車
- 燃料電池電動車
- 替代燃料(壓縮天然氣/液化石油氣)
- 按銷售管道
- OEM 車隊直銷
- 授權零售商
- 線上/數位平台
- 國家
- 德國
- 英國
- 法國
- 義大利
- 西班牙
- 荷蘭
- 瑞典
- 挪威
- 其他歐洲國家
第6章 競爭情勢
- 市場集中度
- 策略趨勢
- 市佔率分析
- 公司簡介
- Stellantis NV
- Mercedes-Benz Group AG
- Volkswagen AG
- Ford Motor Company
- Renault Group
- Iveco SpA
- Toyota Motor Corporation
- Nissan Motor Co., Ltd
- BYD Co., Ltd.
- Hyundai Motor Company
- SAIC Maxus Automotive Co. Ltd.
- MAN Truck & Bus SE
- London Electric Vehicle Company(LEVC)
- Rivian Automotive LLC
第7章 市場機會與未來展望
According to Mordor Intelligence, the european van market size is projected to be USD 60.45 billion in 2025, USD 62.34 billion in 2026, and reach USD 72.76 billion by 2031, growing at a CAGR of 3.14% from 2026 to 2031.
This report is Segmented by Gross Vehicle Weight (N1 Class I, N1 Class II, and More), Cargo Space (<=5 M3, Above 5 M3), End User (Commercial Fleets, Government and Municipal, and More), Drive Type (IC Engine - Petrol, IC Engine - Diesel, and More), Sales Channel (Direct OEM Fleet Sales, Authorized Dealerships, and More), and Country. The Market Forecasts are Provided in Terms of Value (USD) and Volume (Units).
Europe Van Market Trends and Insights
Rise in Sales of Electric Vans
Battery-electric vans accounted for 5.9% of new registrations in 2024 after subsidy cuts, but rebounded to 9.5% during H1 2025 as corporate fleet mandates intensified . The Clean Vehicles Directive mandates that public entities procure only zero-emission vans starting in 2026, ensuring consistent demand. Between 2024 and 2026, OEMs introduced new BEV models, offering a wider range of payload options. In the United Kingdom, total-cost-of-ownership parity is achieved when vehicles meet certain mileage thresholds, a target many fleets reach within a short period. This shift in procurement preferences favors zero-emission vehicles over diesel, despite existing charger limitations.
E-commerce Last-Mile Boom
By 2030, parcel volumes in Western Europe are expected to grow significantly. This growth is prompting fleets to increasingly opt for smaller vans, enabling them to navigate tight urban spaces and complete more delivery loops daily. The number of automated parcel machines has increased by 2024, highlighting a trend towards frequent, low-payload deliveries. Operators like Otto Group have reported achieving greater delivery efficiency using compact BEV vans compared to their diesel counterparts. Quick-commerce companies are strategically positioning micro-fulfilment hubs close to their consumers, driving up the demand for vans with smaller cargo volumes. With delivery frequency taking precedence over payload capacity, OEMs are now focusing on enhancing thermal management and fast-charging capabilities, rather than merely expanding cubic space.
High Battery and Vehicle CAPEX
In the United Kingdom, battery-electric vans remain significantly costlier than their diesel counterparts. High-mileage users can expect total-cost parity within a few years, but smaller fleets may take longer, hindering quicker adoption. While battery pack prices declined in recent years, stabilization of commodities has slowed further reductions. A decline in BEV van registrations in 2024, following Germany's subsidy withdrawal, underscores the fragility of such policies. Although leasing eases initial costs, it transfers the residual-value risk to lessors, who then factor this uncertainty into monthly rates.
Other drivers and restraints analyzed in the detailed report include:
- EU Low-Emission-Zone Mandates
- OEM Skateboard EV Platforms
- Limited Depot Fast-Charging Sites
For complete list of drivers and restraints, kindly check the Table Of Contents.
Segment Analysis
In 2025, N1 Class I vans (with a gross vehicle weight of <=2 tons) commanded a dominant 50.33% market share. These vans are projected to grow at a steady 3.85% CAGR through 2031, underscoring the e-commerce industry's preference for nimble vehicles adept at navigating tight urban spaces. Class II vans are gaining traction as fleets adapt to urban and regional delivery needs. These vans are increasingly used for city tasks or scaled up for broader regional operations. Class III vans, primarily serving construction and utility sectors, face challenges related to battery weight. For instance, a 75 kWh battery pack adds an extra 450 kg, pushing certain BEV models into a higher class and diminishing their usable capacity.
Stellantis has countered this challenge by introducing a composite cargo floor, effectively reducing weight by 60 kg. While licensing regulations permit standard B-category drivers to operate vans weighing up to 3.5 tons, certain states introduce additional testing for heavier BEVs, complicating compliance. Mercedes-Benz offers modular battery sizes, allowing fleets to prioritize either range or payload on a unified chassis. As urban zero-emission zones become more stringent, the European van market is increasingly favoring lighter classes.
Vans above 5 m3 commanded 64.11% share during 2025 because parcel carriers and tradespeople require cubic space for bulky loads. Growth is muted at a notable CAGR, while compact vans (<=5 m3) grow 5.01% as quick-commerce platforms prioritize trip frequency. The European van market size for compact formats is forecast to advance rapidly on the back of dense urban demand. Renault's Master E-Tech offers up to 22 m3 with a 130 kWh battery to maintain a 250 km range under load.
At the other extreme, Stellantis' e-Berlingo provides 4.4 m3 cargo space and qualifies for resident parking permits in Paris and Milan, lowering operational friction. Modular racking improves asset utilization by allowing fleets to switch between shelving and open cargo bays in minutes, blurring rigid segment lines. Payload trade-offs increasingly favor flexible interiors over sheer volume, prompting OEMs to market configurable decks and tool-less lashing systems.
Complete Report Scope:
- By Gross Vehicle Weight
- N1 Class I (<= 2 t GVW)
- N1 Class II (2-2.5 t GVW)
- N1 Class III (2.5-3.5 t GVW)
- By Cargo Space
- <= 5 m3
- Above 5 m3
- By End User
- Commercial Fleets
- Government and Municipal
- Rental and Leasing Operators
- By Drive Type
- IC Engine - Petrol
- IC Engine - Diesel
- Battery Electric
- Hybrid Electric
- Fuel-Cell Electric
- Alternative Fuel (CNG/LPG)
- By Sales Channel
- Direct OEM Fleet Sales
- Authorized Dealerships
- Online / Digital Platforms
- By Country
- Germany
- United Kingdom
- France
- Italy
- Spain
- Netherlands
- Sweden
- Norway
- Rest of Europe
List of Companies Covered in this Report:
- Stellantis N.V.
- Mercedes-Benz Group AG
- Volkswagen AG
- Ford Motor Company
- Renault Group
- Iveco S.p.A.
- Toyota Motor Corporation
- Nissan Motor Co., Ltd
- BYD Co., Ltd.
- Hyundai Motor Company
- SAIC Maxus Automotive Co. Ltd.
- MAN Truck & Bus SE
- London Electric Vehicle Company (LEVC)
- Rivian Automotive LLC
Additional Benefits:
- The market estimate (ME) sheet in Excel format
- 3 months of analyst support
TABLE OF CONTENTS
1 Introduction
- 1.1 Study Assumptions and Market Definition
- 1.2 Scope of the Study
2 Research Methodology
3 Executive Summary
4 Market Landscape
- 4.1 Market Overview
- 4.2 Market Drivers
- 4.2.1 Rise in Sales of Electric Vans
- 4.2.2 E-commerce Last-Mile Boom
- 4.2.3 EU Low-Emission-Zone Mandates
- 4.2.4 OEM Skateboard EV Platforms
- 4.2.5 Urban Micro-fulfilment Hub Adoption
- 4.2.6 Battery-as-a-Service Fleet Models
- 4.3 Market Restraints
- 4.3.1 High Battery and Vehicle CAPEX
- 4.3.2 Limited Depot Fast-Charging Sites
- 4.3.3 Semiconductor Supply Constraints
- 4.3.4 Driver Shortage and License Rules
- 4.4 Value / Supply-Chain Analysis
- 4.5 Regulatory Landscape
- 4.6 Technological Outlook
- 4.7 Porter's Five Forces
- 4.7.1 Threat of New Entrants
- 4.7.2 Bargaining Power of Buyers
- 4.7.3 Bargaining Power of Suppliers
- 4.7.4 Threat of Substitutes
- 4.7.5 Intensity of Competitive Rivalry
5 Market Size and Growth Forecasts (Value (USD) and Volume (Units))
- 5.1 By Gross Vehicle Weight
- 5.1.1 N1 Class I (<= 2 t GVW)
- 5.1.2 N1 Class II (2-2.5 t GVW)
- 5.1.3 N1 Class III (2.5-3.5 t GVW)
- 5.2 By Cargo Space
- 5.2.1 <= 5 m3
- 5.2.2 Above 5 m3
- 5.3 By End User
- 5.3.1 Commercial Fleets
- 5.3.2 Government and Municipal
- 5.3.3 Rental and Leasing Operators
- 5.4 By Drive Type
- 5.4.1 IC Engine - Petrol
- 5.4.2 IC Engine - Diesel
- 5.4.3 Battery Electric
- 5.4.4 Hybrid Electric
- 5.4.5 Fuel-Cell Electric
- 5.4.6 Alternative Fuel (CNG/LPG)
- 5.5 By Sales Channel
- 5.5.1 Direct OEM Fleet Sales
- 5.5.2 Authorized Dealerships
- 5.5.3 Online / Digital Platforms
- 5.6 By Country
- 5.6.1 Germany
- 5.6.2 United Kingdom
- 5.6.3 France
- 5.6.4 Italy
- 5.6.5 Spain
- 5.6.6 Netherlands
- 5.6.7 Sweden
- 5.6.8 Norway
- 5.6.9 Rest of Europe
6 Competitive Landscape
- 6.1 Market Concentration
- 6.2 Strategic Moves
- 6.3 Market Share Analysis
- 6.4 Company Profiles (Includes Global Level Overview, Market Level Overview, Core Segments, Financials as Available, Strategic Information, Market Rank/Share for Key Companies, Products and Services, SWOT Analysis, and Recent Developments)
- 6.4.1 Stellantis N.V.
- 6.4.2 Mercedes-Benz Group AG
- 6.4.3 Volkswagen AG
- 6.4.4 Ford Motor Company
- 6.4.5 Renault Group
- 6.4.6 Iveco S.p.A.
- 6.4.7 Toyota Motor Corporation
- 6.4.8 Nissan Motor Co., Ltd
- 6.4.9 BYD Co., Ltd.
- 6.4.10 Hyundai Motor Company
- 6.4.11 SAIC Maxus Automotive Co. Ltd.
- 6.4.12 MAN Truck & Bus SE
- 6.4.13 London Electric Vehicle Company (LEVC)
- 6.4.14 Rivian Automotive LLC
7 Market Opportunities and Future Outlook
- 7.1 White-space and Unmet-Need Assessment

 2026年全球側開門改裝套件市場報告2026年全球後入式改裝套件市場報告
 北美廂型車市場:市佔率分析、產業趨勢與統計及成長預測(2026-2031 年)
 廂型車市場-全球產業規模、佔有率、趨勢、機會與預測:按載重能力、驅動方式、應用、地區和競爭格局分類,2021-2031年
 電動車底盤域控制單元市場按控制架構、車輛類型、底盤功能、自動駕駛等級和作業系統分類 - 全球預測(2026-2032 年)
 廂型車市場機會、成長促進因素、產業趨勢分析及預測(2026-2035年)電動貨車改裝套件市場機會、成長促進因素、產業趨勢分析及預測(2025-2034年)
 2032 年廂型車改裝市場預測:按車型、尺寸、改裝、應用、最終用戶和地區進行的全球分析美國貨車:市場佔有率分析、行業趨勢和統計數據、成長預測(2025-2030 年)
 貨車市場規模、佔有率、趨勢分析報告:按噸位、推進器、最終用途、地區、細分市場預測,2025-2030 年