


 |
市場調查報告書
商品編碼
2073625
北美廂型車市場:市佔率分析、產業趨勢與統計及成長預測(2026-2031 年)North America Van - Market Share Analysis, Industry Trends & Statistics, Growth Forecasts (2026 - 2031) |
||||||

※ 本網頁內容可能與最新版本有所差異。詳細情況請與我們聯繫。
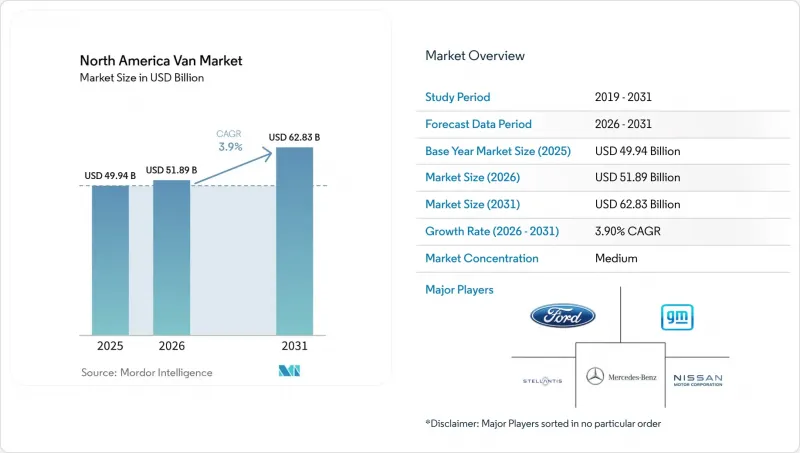
根據 Mordor Intelligence 預測,北美廂型車市場規模預計將在 2025 年達到 499.4 億美元,2026 年達到 518.9 億美元,2031 年達到 628.3 億美元,在預測期(2026-2031 年)內複合年成長率為 3.90%。
本報告按動力系統(混合動力汽車、內燃機車)、車輛類型(貨車、搭乘用等)、最終用戶(最後一公里配送和小包裹運輸、現場服務和公共產業等)、負載容量(2噸以下、2-3噸、其他)、電池續航里程和國家/地區進行細分。市場預測以價值(美元)和銷售(輛)表示。
北美廂型車市場的趨勢與洞察
小包裹的快速發展和最後一公里配送的激增。
2024年,美國電子商務小包裹遞送量大幅成長。這一成長加劇了對遞送時間的限制,迫使承運商使用小型貨車,以便在住宅街道上順暢行駛的同時,最大限度地提高載貨量。亞馬遜承諾在2030年部署10萬輛Rivian貨車,為確保運輸能力向電氣化轉型提供了藍圖。聯邦快遞和UPS也透過各自的多年協議效仿,但建立與電網相容的配送中心仍然是一項挑戰。據美國國家可再生能源實驗室(NREL)稱,部分都市區配送貨車的電氣化將需要大幅增加充電負荷,相當於幾座大型發電廠的發電量。為了應對需求面費用風險,每家快遞公司都在策略性地在同一地點安裝太陽能發電和儲能解決方案。將配送中心改造為微型電網不僅可以降低尖峰時段的費用,還可以透過輔助服務創造商機。
國內對電動車和電池的投資由《通貨膨脹控制法案》(IRA) 提供支持
《通膨控制法案》(IRA) 為符合條件的重型商用車提供最高 4 萬美元的稅額扣抵,前提是車輛的最終組裝和關鍵電池零件在北美製造。該法案實施後的第一年,絕大多數符合條件的車輛都享受了全額稅額扣抵,凸顯了這項政策在計算總擁有成本 (TCO) 方面的重要性。這一系列獎勵推動了眾多與電池相關的項目,其中最引人注目的是 LG 與本田在俄亥俄州的合資企業以及Panasonic在堪薩斯州的擴張。透過縮短物流路線和在地採購,美國本土汽車製造商 (OEM) 正在縮短從訂單到交貨的前置作業時間,從而在未來幾年監管標準日益嚴格的背景下,獲得速度方面的競爭優勢。
快速充電需求和收費迅速成長
在用電高峰期,商業收費系統通常會收取高額的用電費用。擁有多輛貨車並使用大容量充電樁的車輛停車場可能面臨每月巨額的用電費用。這會抵消燃料成本的節省,並延長電動車的投資回收期,使其超出正常的更換週期。目前,企業客戶參與充電管理計畫的比例仍參差不齊,只有一小部分符合資格的企業客戶參與其中。因此,車主被迫投資昂貴的現場儲能電池來應付用電高峰。同時,諸如加州AB 2061法案等相關立法行動仍停滯不前,導致營運商只能獨自應對複雜的收費系統。
細分市場分析
預計到2025年,內燃機驅動系統將維持73.45%的市場佔有率,而電動車(EV)和混合動力汽車在北美廂型車市場的複合年成長率(CAGR)為8.25%,是整體市場成長率的兩倍。純電動廂型車(BEV)在電動配送領域佔據主導地位,其更高的性價比使其比插電式混合動力汽車更具吸引力。在現有獎勵政策的支持下,北美純電動廂型車市場預計將顯著成長。儘管燃料電池汽車的試驗規模仍然小規模,但由於國家層面的舉措推動了綠色氫成本的下降,燃料電池汽車在長途運輸應用方面被認為前景廣闊。
就內燃機而言,雖然輕型車輛領域正逐步向汽油和壓縮天然氣(CNG)過渡,但重型車輛領域仍以柴油引擎為主,因為柴油引擎在扭力和加氣速度方面具有優勢。然而,隨著能量密度的提高,柴油引擎的有效負載容量優勢正在減弱。鑑於固態電池的商業性化應用尚不廣泛,這一趨勢預示著市場可能即將迎來轉折點。
預計到2025年,貨車將佔車輛交付總量的64.01%,這反映了它們在最後一公里配送領域的主導地位。同時,特種貨車(冷藏車、露營車、救護車等)的成長速度最快,到2031年複合年成長率將達到6.24%。開利和冷王的電動運輸冷凍機組透過提供驅動能量或使用輔助電池組,幫助托運人輕鬆遵守加州和紐約州等州的怠速規定,儘管有效負載容量有所下降。露營車改裝現在是梅賽德斯-奔馳eSprinter的原廠選配配置,這反映出追求生活方式的客戶願意為安靜、離網運行支付更高的價格。
然而,針對特定應用的電氣化在重量範圍方面仍面臨尚未解決的權衡取捨。由於缺乏專門的NFPA標準,救護車改裝商必須獲得高壓醫療系統的認證,這延長了核准週期並限制了產量。在這些監管嚴格、價值極高的細分市場中,早期投資於特定應用整合的原始設備製造商(OEM)有望獲得高於平均水準的利潤率。
其他好處:
- Excel格式的市場預測(ME)表
- 3個月的分析師支持
目錄
第1章:引言
- 研究假設和市場定義
- 調查範圍
第2章:調查方法
第3章執行摘要
第4章:主要產業趨勢
- 都市化、人口以及對汽車和大眾運輸的需求
- 廂型車市場電動車滲透率
- 燃油價格與電費之間的差價(每公里)
- 電動車和內燃機汽車總擁有成本的差異
- 資金籌措和所有權模式(貸款、租賃、認購)
- 電池化學成分和電池組能量密度
- 家庭、職場和公共場所充電樁的安裝密度
- 快速充電網路滲透率與輸出頻寬現狀
- 替代燃料基礎設施(燃料電池電動車的氫氣)
- 補貼和消費者獎勵的價值
- OEM電動車產品線及未來車型計劃
- 價值鍊和通路分析
- 監管、財政和產業政策框架
第5章 市場狀況
- 市場概覽
- 市場促進因素
- 小包裹的快速發展和最後一公里配送的激增。
- IRA支持的國內電動車和電池投資
- 到2027年,每度電池組的價格將低於100美元。
- 省級零排放車輛和車輛配置需求
- 滑板式廂型車平台可減少30%的資本投資
- 透過智慧倉庫V2G累積收入
- 市場限制因素
- 快速充電樁的需求和充電量激增
- 純電動廂型車初始價格溢價
- 電動動力傳動系統維修技師短缺
- 由於電池重量,車輛總重超過 4.5 噸。
- 價值供應鏈分析
- 監理情勢
- 技術展望
- 波特五力模型
第6章 市場規模與成長預測
- 依推進類型
- 混合動力汽車和電動車
- 電池式電動車(BEV)
- 插電式混合動力車(PHEV)
- 混合動力電動車(HEV)
- 燃料電池電動車(FCEV)
- 內燃機(ICE)
- 柴油引擎
- 汽油
- CNG 和其他
- 混合動力汽車和電動車
- 車輛類型
- 貨車
- 搭乘用
- 專用廂型車(冷藏車、露營車、救護車)
- 最終用戶
- 最後一公里配送和小包裹
- 現場服務與公共產業
- 租賃車輛
- 休閒和房車生活
- 政府和地方政府車輛
- 為企業客戶提供客運服務
- 按載重能力
- 2噸或以下
- 2-3噸
- 3至5.5噸
- 5.5噸或以上
- 按電池容量
- 最遠可達100英里
- 100-200英里
- 超過200英里
- 國家
- 美國
- 加拿大
- 墨西哥
第7章 競爭情勢
- 市場集中度
- 策略趨勢
- 市佔率分析
- 公司簡介
- Mercedes-Benz Group AG
- Ford Motor Company
- General Motors Company
- Stellantis NV
- Nissan Motor Co., Ltd.
- Toyota Motor Corporation
- Volkswagen AG
- Rivian Automotive Inc.
- Workhorse Group Inc.
- Kia Corporation
- Isuzu Motors Ltd.
- Hino Motors Ltd.
- SAIC Motor Corp., Ltd.
第8章 市場機會與未來展望
第9章:執行長面臨的關鍵策略挑戰
According to Mordor Intelligence, the north american van market was valued at USD 49.94 billion in 2025 and estimated to grow from USD 51.89 billion in 2026 to reach USD 62.83 billion by 2031, at a CAGR of 3.90% during the forecast period (2026-2031).
This report is Segmented by Propulsion Type (Hybrid and Electric Vehicles, Internal Combustion Engine), Vehicle Type (Cargo Van, Passenger Van, and More), End-User (Last-Mile Delivery and Parcel, Field Services and Utilities, and More), Tonnage Capacity (Up To 2 Tons, 2-3 Tons, and More), Battery Range, and Country. The Market Forecasts are Provided in Terms of Value (USD) and Volume (Units).
North America Van Market Trends and Insights
Parcel E-commerce Boom and Last-Mile Surge
In 2024, the United States experienced significant growth in e-commerce parcel shipments. This increase has tightened delivery windows, prompting operators to utilize smaller vans adept at navigating residential streets while maximizing payload capacity. Amazon's pledge to field 100,000 Rivian vans by 2030 created a blueprint for electrified capacity reservations. FedEx and UPS have echoed this sentiment with their own multi-year orders, yet the challenge of grid-ready depots persists. According to the National Renewable Energy Laboratory, electrifying a portion of urban delivery vans would require a considerable increase in charging load, comparable to the output of multiple utility-scale plants. In response to demand-charge risks, fleets are strategically co-locating solar and storage solutions. This transformation of depots into microgrids not only reduces peak tariffs but also unlocks potential revenue from ancillary services.
IRA-Backed Domestic EV and Battery Investments
The Inflation Reduction Act provides up to USD 40,000 per qualifying heavy-duty commercial vehicle, so long as final assembly and key battery content are North America-based . In the inaugural year following the enactment, a significant majority of eligible units capitalized on the full credit, underscoring its importance in the total-cost-of-ownership equation. This incentive surge catalyzed numerous battery-related announcements, notably featuring LG-Honda's joint venture in Ohio and Panasonic's expansion in Kansas. By shortening logistics routes and sourcing cells locally, domestic OEMs have reduced the order-to-delivery timeline, gaining a competitive speed advantage as compliance benchmarks escalate through the coming years.
Fast-Charger Demand-Charge Spikes
During peak months, commercial tariffs often impose significant demand fees. A depot with multiple vans utilizing high-capacity chargers could face substantial monthly demand charges. This erodes fuel savings and extends the electric vehicle (EV) payback period beyond the typical replacement timeframe. Managed-charging program enrollment remains inconsistent, with only a small portion of eligible commercial clients participating. This has forced fleets to invest in costly on-site batteries as load buffers. Meanwhile, legislative remedies like California's AB 2061 remain stalled, leaving operators to navigate tariff complexities independently.
Other drivers and restraints analyzed in the detailed report include:
- Sub-USD 100 kWh Battery Packs by 2027
- State-Level ZEV and Fleet Mandates
- Up-Front BEV Van Price Premium
For complete list of drivers and restraints, kindly check the Table Of Contents.
Segment Analysis
Internal-combustion drivetrains retained 73.45% of 2025 volumes, but electric and hybrid formats are pacing the North America van market at an 8.25% CAGR, double headline growth. Battery-electric vans dominate the electrified delivery segment, with improving range-per-dollar metrics driving a preference for BEVs over plug-in hybrids. The North American market for BEV vans is expected to grow significantly, supported by the current incentive framework. Although fuel-cell pilot fleets remain small in scale, they show promise for long-range applications, particularly as green hydrogen costs decrease in line with national initiatives.
Internal combustion engines are shifting toward gasoline and CNG options in lighter vehicle classes, while diesel continues to be favored in heavier categories due to its torque and refueling speed advantages. However, advancements in energy density are reducing diesel's payload superiority. This development indicates a potential turning point in the market as solid-state chemistries begin to see limited commercial adoption.
Cargo configurations occupied 64.01% of deliveries in 2025, mirroring last-mile dominance. Specialty vans-refrigerated, camper, and ambulance builds-are, however, posting the quickest uptake at a 6.24% CAGR to 2031. Electric transport-refrigeration units from Carrier and Thermo King draw propulsion energy or tap auxiliary packs, slicing payload yet helping shippers meet anti-idling rules in California and New York . Camper conversions are now a fully factory option on Mercedes-Benz's eSprinter, reflecting the lifestyle segment's willingness to pay premiums for silent off-grid operation.
Yet, specialty electrification faces unresolved weight-range trade-offs. Ambulance upfitters must certify high-voltage medical systems in the absence of a dedicated NFPA standard, lengthening approval cycles and tempering volume. OEMs that invest early in application-specific integrations stand to capture above-average margins in these regulated, high-value niches.
Complete Report Scope:
- By Propulsion Type
- Hybrid and Electric Vehicles
- Battery Electric Vehicle (BEV)
- Plug-in Hybrid Electric Vehicle (PHEV)
- Hybrid Electric Vehicle (HEV)
- Fuel-Cell Electric Vehicle (FCEV)
- Internal Combustion Engine (ICE)
- Diesel
- Gasoline
- CNG and Others
- Hybrid and Electric Vehicles
- By Vehicle Type
- Cargo Van
- Passenger Van
- Specialty Van (Refrigerated, Camper, Ambulance)
- By End-User
- Last-Mile Delivery and Parcel
- Field Services and Utilities
- Rental and Leasing Fleets
- Recreational and Van-Life
- Government and Municipal Fleets
- Corporate Passenger Transport
- By Tonnage Capacity
- Up to 2 Tons
- 2-3 Tons
- 3- 5.5 Tons
- Above 5.5 Tons
- By Battery Range
- Up to 100 miles
- 100-200 miles
- Above 200 miles
- By Country
- United States
- Canada
- Mexico
List of Companies Covered in this Report:
- Mercedes-Benz Group AG
- Ford Motor Company
- General Motors Company
- Stellantis N.V.
- Nissan Motor Co., Ltd.
- Toyota Motor Corporation
- Volkswagen AG
- Rivian Automotive Inc.
- Workhorse Group Inc.
- Kia Corporation
- Isuzu Motors Ltd.
- Hino Motors Ltd.
- SAIC Motor Corp., Ltd.
Additional Benefits:
- The market estimate (ME) sheet in Excel format
- 3 months of analyst support
TABLE OF CONTENTS
1 Introduction
- 1.1 Study Assumptions & Market Definition
- 1.2 Scope of the Study
2 Research Methodology
3 Executive Summary
4 Key Industry Trends
- 4.1 Urbanization, Population & Vehicle/Transit Demand
- 4.2 EV Penetration in Van Market
- 4.3 Fuel vs Electricity Price Spread (per km)
- 4.4 EV vs ICE Total Cost of Ownership Gap
- 4.5 Financing & Ownership Models (Loan, Lease, Subscription)
- 4.6 Battery Chemistry Mix & Pack Energy Density
- 4.7 Home, Workplace & Public Charger Density
- 4.8 Fast-Charging Network Coverage & Power Bands
- 4.9 Alternative Fuels Infrastructure (Hydrogen for FCEVs)
- 4.10 Subsidy & Consumer-Incentive Value
- 4.11 OEM EV Line-up & Model Pipeline
- 4.12 Value-Chain & Distribution-Channel Analysis
- 4.13 Regulatory, Fiscal & Industrial Policy Framework
5 Market Landscape
- 5.1 Market Overview
- 5.2 Market Drivers
- 5.2.1 Parcel E-commerce Boom and Last-Mile Surge
- 5.2.2 IRA-Backed Domestic EV and Battery Investments
- 5.2.3 Sub-USD 100 kWh Battery Packs by 2027
- 5.2.4 State-Level ZEV and Fleet Mandates
- 5.2.5 Skateboard Van Platforms Cut CAPEX 30%
- 5.2.6 Smart-Depot V2G Revenue Stacking
- 5.3 Market Restraints
- 5.3.1 Fast-Charger Demand-Charge Spikes
- 5.3.2 Up-Front BEV Van Price Premium
- 5.3.3 E-Powertrain Service-Tech Shortage
- 5.3.4 Battery Weight Pushes Above 4.5 t GVWR
- 5.4 Value / Supply-Chain Analysis
- 5.5 Regulatory Landscape
- 5.6 Technological Outlook
- 5.7 Porter's Five Forces
- 5.7.1 Threat of New Entrants
- 5.7.2 Bargaining Power of Suppliers
- 5.7.3 Bargaining Power of Buyers
- 5.7.4 Threat of Substitutes
- 5.7.5 Industry Rivalry
6 Market Size & Growth Forecasts (Value (USD) and Volume (Units))
- 6.1 By Propulsion Type
- 6.1.1 Hybrid and Electric Vehicles
- 6.1.1.1 Battery Electric Vehicle (BEV)
- 6.1.1.2 Plug-in Hybrid Electric Vehicle (PHEV)
- 6.1.1.3 Hybrid Electric Vehicle (HEV)
- 6.1.1.4 Fuel-Cell Electric Vehicle (FCEV)
- 6.1.2 Internal Combustion Engine (ICE)
- 6.1.2.1 Diesel
- 6.1.2.2 Gasoline
- 6.1.2.3 CNG and Others
- 6.1.1 Hybrid and Electric Vehicles
- 6.2 By Vehicle Type
- 6.2.1 Cargo Van
- 6.2.2 Passenger Van
- 6.2.3 Specialty Van (Refrigerated, Camper, Ambulance)
- 6.3 By End-User
- 6.3.1 Last-Mile Delivery and Parcel
- 6.3.2 Field Services and Utilities
- 6.3.3 Rental and Leasing Fleets
- 6.3.4 Recreational and Van-Life
- 6.3.5 Government and Municipal Fleets
- 6.3.6 Corporate Passenger Transport
- 6.4 By Tonnage Capacity
- 6.4.1 Up to 2 Tons
- 6.4.2 2-3 Tons
- 6.4.3 3- 5.5 Tons
- 6.4.4 Above 5.5 Tons
- 6.5 By Battery Range
- 6.5.1 Up to 100 miles
- 6.5.2 100-200 miles
- 6.5.3 Above 200 miles
- 6.6 By Country
- 6.6.1 United States
- 6.6.2 Canada
- 6.6.3 Mexico
7 Competitive Landscape
- 7.1 Market Concentration
- 7.2 Strategic Moves
- 7.3 Market Share Analysis
- 7.4 Company Profiles (includes Global Level Overview, Market Level Overview, Core Segments, Financials as Available, Strategic Information, Market Rank/Share for Key Companies, Products and Services, SWOT Analysis, and Recent Developments)
- 7.4.1 Mercedes-Benz Group AG
- 7.4.2 Ford Motor Company
- 7.4.3 General Motors Company
- 7.4.4 Stellantis N.V.
- 7.4.5 Nissan Motor Co., Ltd.
- 7.4.6 Toyota Motor Corporation
- 7.4.7 Volkswagen AG
- 7.4.8 Rivian Automotive Inc.
- 7.4.9 Workhorse Group Inc.
- 7.4.10 Kia Corporation
- 7.4.11 Isuzu Motors Ltd.
- 7.4.12 Hino Motors Ltd.
- 7.4.13 SAIC Motor Corp., Ltd.
8 Market Opportunities & Future Outlook
9 Key Strategic Questions for CEOs

 2026年全球側開門改裝套件市場報告2026年全球後入式改裝套件市場報告
 廂型車市場-全球產業規模、佔有率、趨勢、機會與預測:按載重能力、驅動方式、應用、地區和競爭格局分類,2021-2031年
 電動車底盤域控制單元市場按控制架構、車輛類型、底盤功能、自動駕駛等級和作業系統分類 - 全球預測(2026-2032 年)
 歐洲廂型車市場-佔有率分析、產業趨勢與統計、成長預測(2026-2031)
 廂型車市場機會、成長促進因素、產業趨勢分析及預測(2026-2035年)電動貨車改裝套件市場機會、成長促進因素、產業趨勢分析及預測(2025-2034年)
 2032 年廂型車改裝市場預測:按車型、尺寸、改裝、應用、最終用戶和地區進行的全球分析美國貨車:市場佔有率分析、行業趨勢和統計數據、成長預測(2025-2030 年)
 貨車市場規模、佔有率、趨勢分析報告:按噸位、推進器、最終用途、地區、細分市場預測,2025-2030 年