


 |
市場調查報告書
商品編碼
1892874
廂型車市場機會、成長促進因素、產業趨勢分析及預測(2026-2035年)Vans Market Opportunity, Growth Drivers, Industry Trend Analysis, and Forecast 2026 - 2035 |
||||||
2025 年全球廂型車市場價值為 3,253 億美元,預計到 2035 年將以 7.3% 的複合年成長率成長至 6,501 億美元。
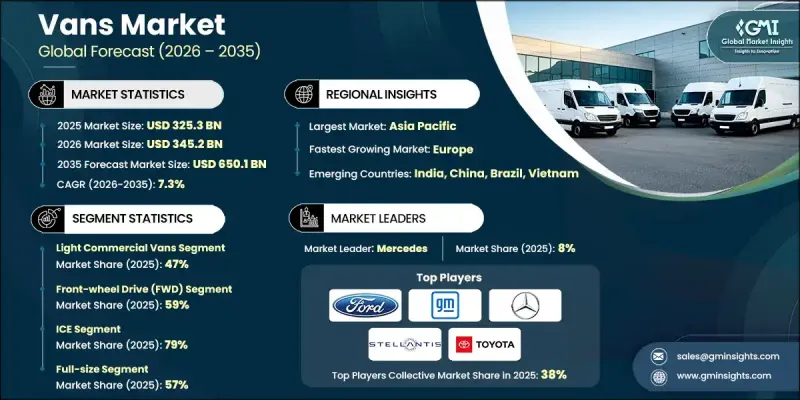
該市場涵蓋輕型商用貨車、貨運貨車和客運貨車,為物流、醫療保健、酒店、政府營運和電子商務等眾多行業提供支援。企業依靠這些車輛實現靈活高效的出行,而車隊遠端資訊處理、互聯互通和數據驅動管理系統的進步正在重塑營運績效。儘管電動貨車的初始投資較高,但其更低的能源和維護成本使其成為車隊越來越青睞的選擇。市場發展受到監管壓力、不斷變化的客戶期望以及車輛技術進步的影響。快速電氣化、自動駕駛和互聯系統的日益融合以及最後一公里配送網路的轉型等趨勢正在深刻影響產品開發和車隊策略。永續發展目標、政府激勵措施以及對營運效率的重視,持續加速全球市場向電動貨車平台的轉型。
| 市場範圍 | |
|---|---|
| 起始年份 | 2025 |
| 預測年份 | 2026-2035 |
| 起始值 | 3253億美元 |
| 預測值 | 6501億美元 |
| 複合年成長率 | 7.3% |
輕型商用貨車在2025年佔據了47%的市場佔有率,預計2026年至2035年將以7.6%的複合年成長率成長。這些貨車的總重通常在6,000至10,000磅之間,兼具燃油經濟性、有效載荷能力和操控性,非常適合在人口密集的城市道路上行駛。包括Rivian、福特汽車、梅賽德斯-奔馳和通用汽車在內的領先製造商正在推出專為配送和服務應用而設計的新型電動車型,進一步推動了該細分市場向電氣化轉型的強勁勢頭。
2025年,前輪驅動(FWD)汽車市佔率將達到59%,預計2035年將以7.2%的年均複合成長率成長。前輪驅動的優勢在於其生產成本更低、燃油效率更高、在鋪裝路面上牽引力更強,以及最佳化了內部佈局以增加可用載貨空間。這些優勢使得前輪驅動車型尤其適合注重成本控制和城市及郊區高效運輸的配送車隊和服務業者。
預計到2025年,中國廂型車市場佔有率將達到39%,這主要得益於車隊需求的成長、國內龐大的產能以及電動輕型商用車的快速普及。中國的物流、服務和配送產業正在推動多功能廂型車的廣泛應用,這些車型既適用於小型企業主,也適用於大型車隊營運商。此外,促進清潔能源車輛、投資充電網路以及製定更嚴格的排放標準的政策措施,正在加速車隊電氣化進程,並激勵企業升級到低排放廂型車。
目錄
第1章:方法論
第2章:執行概要
第3章:行業洞察
- 產業生態系分析
- 供應商格局
- 利潤率分析
- 成本結構
- 每個階段的價值增加
- 影響價值鏈的因素
- 中斷
- 產業影響因素
- 成長促進因素
- 電子商務和最後一公里配送需求不斷成長
- 都市化和基礎設施改善
- 轉向電動和低排放貨車
- 中小企業 (SME) 的成長
- 車隊管理與安全的技術進步
- 產業陷阱與挑戰
- 電動和先進貨車的初期成本較高
- 各地區的複雜法規
- 市場機遇
- 電動貨車普及率成長
- 電子商務配送需求不斷成長
- 新興市場的擴張
- 智慧車隊管理技術的應用
- 成長潛力分析
- 監管環境
- 北美洲
- 美國:聯邦機動車輛安全標準(FMVSS)
- 加拿大:加拿大機動車輛安全標準(CMVSS)
- 歐洲
- 德國:歐盟型式認可條例(EU)
- 英國:GB型式認證(英國脫歐後聯合國歐洲經濟委員會法規)
- 法國:歐盟貨車二氧化碳排放性能標準(歐盟法規)
- 義大利:歐盟整車類型認證(WVTA)框架
- 亞太地區
- 中國:中國強制產品認證(CCC)- GB標準
- 印度:第六階段(BS)排放標準
- 日本:國土交通省(MLIT)型式認可
- 韓國:韓國機動車安全標準(KMVSS)
- 拉丁美洲
- 巴西:CONTRAN車輛認證(環境與技術分析)
- 墨西哥:NOM(Norma Oficial Mexicana)安全與排放標準
- MEA
- 沙烏地阿拉伯:SASO(沙烏地阿拉伯標準、計量和品質組織)技術法規
- 北美洲
- 波特的分析
- PESTEL 分析
- 技術與創新格局
- 當前技術趨勢
- 新興技術
- 價格趨勢
- 按地區
- 依產品
- 生產統計
- 生產中心
- 消費中心
- 進出口
- 成本細分分析
- 製造成本結構
- 研發成本分析
- 監理合規成本
- 分銷和物流成本
- 行銷和銷售成本
- 專利分析
- 永續性和環境方面
- 永續實踐
- 減少廢棄物策略
- 生產中的能源效率
- 環保舉措
- 碳足跡考量
- 未來展望與機遇
第4章:競爭格局
- 介紹
- 公司市佔率分析
- 北美洲
- 歐洲
- 亞太地區
- 拉丁美洲
- MEA
- 主要市場參與者的競爭分析
- 競爭定位矩陣
- 戰略展望矩陣
- 關鍵進展
- 併購
- 合作夥伴關係與合作
- 新產品發布
- 擴張計劃和資金
第5章:市場估價與預測:依車輛類型分類,2022-2035年
- 輕型商用貨車
- 客運貨車
- 貨車
第6章:市場估算與預測:以推進方式分類,2022-2035年
- 冰
- 電的
- 混合
第7章:市場規模估算與預測(2022-2035年)
- 袖珍的
- 中型
- 全尺寸
第8章:市場估算與預測:以驅動方式分類,2022-2035年
- 前輪驅動(FWD)
- 後輪驅動(RWD)
- 全輪驅動(AWD)/ 4x4
第9章:市場估算與預測:依最終用途分類,2022-2035年
- 物流與運輸
- 電子商務與零售
- 公部門
- 衛生保健
- 飯店業
- 其他
第10章:市場估計與預測:依地區分類,2022-2035年
- 北美洲
- 美國
- 加拿大
- 歐洲
- 德國
- 英國
- 法國
- 義大利
- 西班牙
- 俄羅斯
- 北歐
- 比荷盧經濟聯盟
- 亞太地區
- 中國
- 印度
- 日本
- 澳洲
- 韓國
- 新加坡
- 泰國
- 印尼
- 越南
- 拉丁美洲
- 巴西
- 墨西哥
- 阿根廷
- 哥倫比亞
- MEA
- 南非
- 沙烏地阿拉伯
- 阿拉伯聯合大公國
第11章:公司簡介
- 全球參與者
- Ford Motor
- General Motors
- Hyundai Motor Company
- Mercedes-Benz
- Nissan
- Renault
- SAIC Motor
- Stellantis
- Tata Motors
- Toyota Motor
- 區域玩家
- Ashok Leyland
- Foton Motor
- Isuzu
- Iveco
- JMC
- Mahindra & Mahindra
- Maxus
- Rivian
- Emerging Technology Innovators
- Arrival
- BYD
- Canoo
- Wuling Motors
The Global Vans Market was valued at USD 325.3 billion in 2025 and is estimated to grow at a CAGR of 7.3% to reach USD 650.1 billion by 2035.
This market includes light commercial vans, cargo vans, and passenger vans that support a wide range of activities across logistics, healthcare, hospitality, government operations, and e-commerce. Businesses rely on these vehicles for flexible and cost-efficient mobility, and advancements in fleet telematics, connectivity, and data-driven management systems are reshaping operational performance. Although electric vans involve a higher initial investment, their lower energy and maintenance costs are making them an increasingly favorable option for fleets. Market evolution is being shaped by regulatory pressures, shifting customer expectations, and advances in vehicle technologies. Trends such as rapid electrification, growing integration of autonomous and connected systems, and the transformation of last-mile delivery networks are heavily influencing product development and fleet strategies. Sustainability goals, government incentives, and an emphasis on operational efficiency continue to accelerate the transition toward electric van platforms across global markets.
| Market Scope | |
|---|---|
| Start Year | 2025 |
| Forecast Year | 2026-2035 |
| Start Value | $325.3 Billion |
| Forecast Value | $650.1 Billion |
| CAGR | 7.3% |
The light commercial vans category held a 47% share in 2025 and is expected to grow at a CAGR of 7.6% from 2026 to 2035. These vans, typically within the 6,000 to 10,000-pound GVWR range, offer a practical mix of fuel economy, payload capabilities, and maneuverability suitable for dense urban corridors. Leading manufacturers, including Rivian, Ford Motor, Mercedes, and GM, are rolling out new electric designs built specifically for delivery and service applications, reinforcing the segment's strong shift toward electrification.
The front-wheel drive (FWD) vehicles segment held 59% share in 2025 and is forecast to grow at a rate of 7.2% through 2035. Their appeal stems from benefits such as reduced production costs, enhanced fuel efficiency, improved traction on paved streets, and optimized interior layouts that increase usable cargo space. These advantages make FWD configurations particularly well-suited for delivery fleets and service operators focused on cost control and efficient mobility in urban and suburban landscapes.
China Vans Market held a 39% share in 2025, supported by rising fleet demand, extensive domestic production capacity, and accelerating adoption of electric light commercial vehicles. The country's logistics, service, and delivery sectors are driving widespread use of versatile van models designed for both small business owners and large-scale fleet operators. Policy measures promoting cleaner vehicles, investment in charging networks, and stricter emission standards are speeding up fleet electrification and motivating companies to upgrade to low-emission vans.
Major companies active in the Global Vans Market include Ford Motor, Hyundai Motor, Nissan, SAIC Motor, Renault, Stellantis, Tata Motors, Toyota Motor, Mercedes, and General Motors. Companies in the Vans Market are strengthening their competitive position through a combination of strategic initiatives. Many automakers are accelerating investments in electric platforms to meet rising sustainability requirements and appeal to fleet operators seeking lower total cost of ownership. Firms are expanding their connected vehicle ecosystems, enabling real-time diagnostics, predictive maintenance, and performance optimization for large fleets. Collaborations with logistics providers and technology partners are helping companies integrate advanced driver-assistance systems and autonomous capabilities into van lineups.
Table of Contents
Chapter 1 Methodology
- 1.1 Market scope and definition
- 1.2 Research design
- 1.2.1 Research approach
- 1.2.2 Data collection methods
- 1.3 Data mining sources
- 1.3.1 Global
- 1.3.2 Regional/Country
- 1.4 Base estimates and calculations
- 1.4.1 Base year calculation
- 1.4.2 Key trends for market estimation
- 1.5 Primary research and validation
- 1.5.1 Primary sources
- 1.6 Forecast model
- 1.7 Research assumptions and limitations
Chapter 2 Executive Summary
- 2.1 Industry 360° synopsis, 2022 - 2035
- 2.2 Key market trends
- 2.2.1 Regional
- 2.2.2 Vehicle
- 2.2.3 Propulsion
- 2.2.4 Size
- 2.2.5 Drive
- 2.2.6 End Use
- 2.3 TAM Analysis, 2026-2035
- 2.4 CXO perspectives: Strategic imperatives
- 2.4.1 Executive decision points
- 2.4.2 Critical success factors
- 2.5 Future outlook and strategic recommendations
Chapter 3 Industry Insights
- 3.1 Industry ecosystem analysis
- 3.1.1 Supplier landscape
- 3.1.2 Profit margin analysis
- 3.1.3 Cost structure
- 3.1.4 Value addition at each stage
- 3.1.5 Factor affecting the value chain
- 3.1.6 Disruptions
- 3.2 Industry impact forces
- 3.2.1.1 Growth drivers
- 3.2.1.2 Rising e-commerce and last-mile delivery demand
- 3.2.1.3 Urbanization and improved infrastructure
- 3.2.1.4 Shift towards electric and low-emission vans
- 3.2.1.5 Growth of small and medium enterprises (SMEs)
- 3.2.1.6 Technological advancements in fleet management and safety
- 3.2.2 Industry pitfalls and challenges
- 3.2.2.1 High upfront costs of electric and advanced vans
- 3.2.2.2 Complex regulations across regions
- 3.2.3 Market opportunities
- 3.2.3.1 Growth in electric van adoption
- 3.2.3.2 Rising demand from e-commerce deliveries
- 3.2.3.3 Expansion in emerging markets
- 3.2.3.4 Use of smart fleet management technologies
- 3.3 Growth potential analysis
- 3.4 Regulatory landscape
- 3.4.1 North America
- 3.4.1.1 US: Federal Motor Vehicle Safety Standards (FMVSS)
- 3.4.1.2 Canada: Canada Motor Vehicle Safety Standards (CMVSS)
- 3.4.2 Europe
- 3.4.2.1 Germany: EU Type Approval Regulation (EU) 2018/858
- 3.4.2.2 UK: GB Type Approval (Post-Brexit UNECE Regulations)
- 3.4.2.3 France: EU CO2 Emission Performance Standards for Vans (Regulation EU 2019/631)
- 3.4.2.4 Italy: EU Whole Vehicle Type Approval (WVTA) Framework
- 3.4.3 Asia Pacific
- 3.4.3.1 China: China Compulsory Certification (CCC) - GB Standards
- 3.4.3.2 India: Bharat Stage (BS) VI Emission Standards
- 3.4.3.3 Japan: Ministry of Land, Infrastructure, Transport and Tourism (MLIT) Type Approval
- 3.4.3.4 South Korea: Korea Motor Vehicle Safety Standards (KMVSS)
- 3.4.4 Latin America
- 3.4.4.1 Brazil: CONTRAN Vehicle Homologation (Environmental & Technical Analysis)
- 3.4.4.2 Mexico: NOM (Norma Oficial Mexicana) Safety & Emissions Standards
- 3.4.5 MEA
- 3.4.5.1 Saudi Arabia: SASO (Saudi Standards, Metrology and Quality Organization) Technical Regulations
- 3.4.1 North America
- 3.5 Porter's analysis
- 3.6 PESTEL analysis
- 3.7 Technology and innovation landscape
- 3.7.1 Current technological trends
- 3.7.2 Emerging technologies
- 3.8 Price trends
- 3.8.1 By region
- 3.8.2 By product
- 3.9 Production statistics
- 3.9.1 Production hubs
- 3.9.2 Consumption hubs
- 3.9.3 Export and import
- 3.10 Cost breakdown analysis
- 3.10.1 Manufacturing cost structure
- 3.10.2 R&D cost analysis
- 3.10.3 Regulatory compliance costs
- 3.10.4 Distribution & logistics costs
- 3.10.5 Marketing & sales costs
- 3.11 Patent analysis
- 3.12 Sustainability and environmental aspects
- 3.12.1 Sustainable practices
- 3.12.2 Waste reduction strategies
- 3.12.3 Energy efficiency in production
- 3.12.4 Eco-friendly Initiatives
- 3.12.5 Carbon footprint considerations
- 3.13 Future outlook and opportunities
Chapter 4 Competitive Landscape, 2025
- 4.1 Introduction
- 4.2 Company market share analysis
- 4.2.1 North America
- 4.2.2 Europe
- 4.2.3 Asia Pacific
- 4.2.4 LATAM
- 4.2.5 MEA
- 4.3 Competitive analysis of major market players
- 4.4 Competitive positioning matrix
- 4.5 Strategic outlook matrix
- 4.6 Key developments
- 4.6.1 Mergers & acquisitions
- 4.6.2 Partnerships & collaborations
- 4.6.3 New Product Launches
- 4.6.4 Expansion Plans and funding
Chapter 5 Market Estimates & Forecast, By Vehicle, 2022 2035 (USD Bn, Units)
- 5.1 Key trends
- 5.2 Light commercial vans
- 5.3 Passenger vans
- 5.4 Cargo vans
Chapter 6 Market Estimates & Forecast, By Propulsion, 2022 - 2035 (USD Bn, Units)
- 6.1 Key trends
- 6.2 ICE
- 6.3 Electric
- 6.4 Hybrid
Chapter 7 Market Estimates & Forecast, By Size, 2022 - 2035 (USD Bn, Units)
- 7.1 Key trends
- 7.2 Compact
- 7.3 Mid-size
- 7.4 Full-size
Chapter 8 Market Estimates & Forecast, By Drive, 2022 - 2035 (USD Bn, Units)
- 8.1 Key trends
- 8.2 Front-wheel drive (FWD)
- 8.3 Rear-wheel drive (RWD)
- 8.4 All-wheel drive (AWD) / 4x4
Chapter 9 Market Estimates & Forecast, By End Use, 2022 - 2035 (USD Bn, Units)
- 9.1 Key trends
- 9.2 Logistics & transportation
- 9.3 Ecommerce & retail
- 9.4 Public sector
- 9.5 Healthcare
- 9.6 Hospitality
- 9.7 Others
Chapter 10 Market Estimates & Forecast, By Region, 2022 - 2035 (USD Mn, Units)
- 10.1 Key trends
- 10.2 North America
- 10.2.1 US
- 10.2.2 Canada
- 10.3 Europe
- 10.3.1 Germany
- 10.3.2 UK
- 10.3.3 France
- 10.3.4 Italy
- 10.3.5 Spain
- 10.3.6 Russia
- 10.3.7 Nordics
- 10.3.8 Benelux
- 10.4 Asia Pacific
- 10.4.1 China
- 10.4.2 India
- 10.4.3 Japan
- 10.4.4 Australia
- 10.4.5 South Korea
- 10.4.6 Singapore
- 10.4.7 Thailand
- 10.4.8 Indonesia
- 10.4.9 Vietnam
- 10.5 Latin America
- 10.5.1 Brazil
- 10.5.2 Mexico
- 10.5.3 Argentina
- 10.5.4 Colombia
- 10.6 MEA
- 10.6.1 South Africa
- 10.6.2 Saudi Arabia
- 10.6.3 UAE
Chapter 11 Company Profiles
- 11.1 Global Players
- 11.1.1 Ford Motor
- 11.1.2 General Motors
- 11.1.3 Hyundai Motor Company
- 11.1.4 Mercedes-Benz
- 11.1.5 Nissan
- 11.1.6 Renault
- 11.1.7 SAIC Motor
- 11.1.8 Stellantis
- 11.1.9 Tata Motors
- 11.1.10 Toyota Motor
- 11.2 Regional Players
- 11.2.1 Ashok Leyland
- 11.2.2 Foton Motor
- 11.2.3 Isuzu
- 11.2.4 Iveco
- 11.2.5 JMC
- 11.2.6 Mahindra & Mahindra
- 11.2.7 Maxus
- 11.2.8 Rivian
- 11.3 Emerging Technology Innovators
- 11.3.1 Arrival
- 11.3.2 BYD
- 11.3.3 Canoo
- 11.3.4 Wuling Motors
 北美廂型車市場:市佔率分析、產業趨勢與統計及成長預測(2026-2031 年)
 廂型車市場-全球產業規模、佔有率、趨勢、機會與預測:按載重能力、驅動方式、應用、地區和競爭格局分類,2021-2031年
 電動車底盤域控制單元市場按控制架構、車輛類型、底盤功能、自動駕駛等級和作業系統分類 - 全球預測(2026-2032 年)歐洲廂型車市場-佔有率分析、產業趨勢與統計、成長預測(2026-2031)
 電動貨車改裝套件市場機會、成長促進因素、產業趨勢分析及預測(2025-2034年)
 2032 年廂型車改裝市場預測:按車型、尺寸、改裝、應用、最終用戶和地區進行的全球分析美國貨車:市場佔有率分析、行業趨勢和統計數據、成長預測(2025-2030 年)
 貨車市場規模、佔有率、趨勢分析報告:按噸位、推進器、最終用途、地區、細分市場預測,2025-2030 年