


 |
市場調查報告書
商品編碼
1892690
電動貨車改裝套件市場機會、成長促進因素、產業趨勢分析及預測(2025-2034年)Electric Van Conversion Kits Market Opportunity, Growth Drivers, Industry Trend Analysis, and Forecast 2025 - 2034 |
||||||
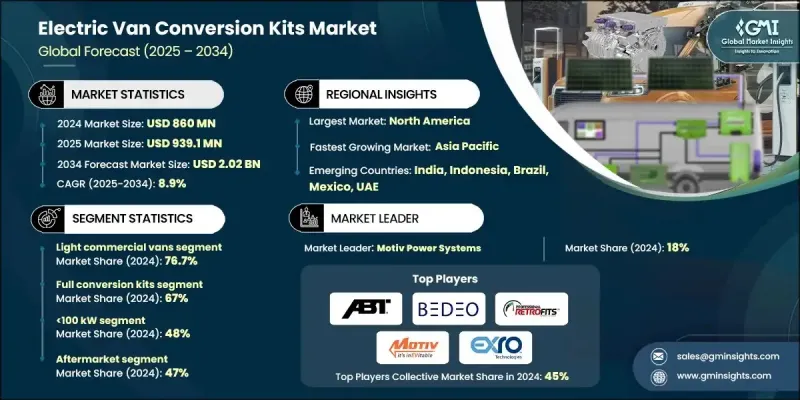
2024 年全球電動貨車改裝套件市場價值為 8.6 億美元,預計到 2034 年將以 8.9% 的複合年成長率成長至 20.2 億美元。
遠端資訊處理、物聯網系統和現代車隊管理軟體的進步,使營運商能夠透過改進路線規劃、電池利用率和維護計劃來最佳化車輛使用。隨著技術的演進,改裝套件本身也在不斷改進,從而支持向靈活所有權模式的轉變。許多車隊營運商正從一次性購買轉向訂閱和按需付費模式,使他們能夠以最小的前期資本將貨車改裝成電動車。這些財務模式使每月支出更加可預測,並使車隊營運商(尤其是小型企業)能夠根據營運需求的變化進行擴展。硬體供應商和數位服務平台之間日益增強的整合進一步推動了向電動出行的更廣泛轉變,使營運商能夠更容易獲得交鑰匙電氣化解決方案。隨著市場加速發展,電動貨車改裝正成為尋求降低排放、提高效率和改善城市和區域運輸路線營運控制的組織的實用且經濟高效的途徑。
| 市場範圍 | |
|---|---|
| 起始年份 | 2024 |
| 預測年份 | 2025-2034 |
| 起始值 | 8.6億美元 |
| 預測值 | 20.2億美元 |
| 複合年成長率 | 8.9% |
2024年,輕型商用車市佔率達76.7%,預計2025年至2034年間將以9.6%的複合年成長率成長。這一市場主導地位得益於輕型商用車典型使用週期與當前純電動車輛性能的契合,其日常行駛里程和有效載荷需求均符合現代電動貨車的性能標準。隨著低排放區准入範圍的擴大和營運成本的降低,以及主要地區總體擁有成本的持續下降,電動貨車的普及率將進一步提升。
2024年,全套改裝套件市佔率達到67%,預計2025年至2034年將以10%的複合年成長率成長。全電動改裝套件正朝著模組化、平台無關的設計方向發展,從而縮短安裝時間並擴大與各種廂型車車型的兼容性。基於標準化高壓組件構建的整合電池和馬達系統,結合遠端資訊處理支援的診斷功能,正在提高車隊的利用率,並增強電氣化在最後一公里配送和城市配送應用中的吸引力。
2024年,美國電動貨車改裝套件市場規模達2.571億美元。企業強而有力的永續發展目標,以及聯邦和州政府日益嚴格的排放法規,正促使車隊採用改裝套件,將其作為購買全新電動貨車的一種經濟高效的替代方案。政府資金、稅收優惠和補助金等措施,幫助中小企業快速轉型,也促使市政當局和物流供應商更加依賴改造升級來滿足合規期限要求。
目錄
第1章:方法論
第2章:執行概要
第3章:行業洞察
- 產業生態系分析
- 供應商格局
- 利潤率
- 成本結構
- 每個階段的價值增加
- 影響價值鏈的因素
- 中斷
- 產業影響因素
- 成長促進因素
- 偏好靈活移動而非所有權
- 電動車普及率不斷提高,車隊電氣化程度也不斷提高。
- 企業車隊需求不斷成長
- 連網汽車和遠端資訊處理技術的進步
- 產業陷阱與挑戰
- 高額資本投資
- 監理和保險方面的挑戰
- 市場機遇
- 新興城市市場的擴張
- 與智慧城市和旅遊即服務 (MaaS) 平台整合
- 包含保險和維護的捆綁服務
- 專業電動車和商用車解決方案
- 成長促進因素
- 成長潛力分析
- 監管環境
- 全球的
- 美國環保署替代燃料轉換法規
- 美國國家公路交通安全管理局 (NHTSA) 機動車輛安全標準 (FMVSS 305a)
- CARB認證要求
- 基於年齡的認證途徑
- 北美洲
- 歐洲
- 亞太地區
- 拉丁美洲
- 中東和非洲
- 全球的
- 波特的分析
- PESTEL 分析
- 技術與創新格局
- 當前技術趨勢
- 電池技術演進(NMC、LFP、固態電池路線圖)
- 馬達和逆變器技術的進步(線圈驅動技術、效率提升)
- 熱管理系統(被動冷卻與主動冷卻)
- 新興技術
- 車輛控制單元(VCU)及軟體架構
- 再生煞車最佳化
- 模組化和可擴展的電池配置
- 整合充電解決方案(車載充電器整合)
- 當前技術趨勢
- 定價分析
- 按車輛類別分類的改裝套件價格
- 電池組成本趨勢
- 安裝人工成本結構
- 充電基礎設施成本(二級充電與直流快速充電)
- 成本細分分析
- 專利分析
- 動力總成整合專利
- 電池封裝和熱管理專利
- 電子齒輪和線圈驅動器技術專利(Exro)
- 充電介面和通訊協定專利
- 永續性和環境方面
- 永續實踐
- 減少廢棄物策略
- 生產中的能源效率
- 環保舉措
- 碳足跡考量
- 用例
- 最佳情況
- 投資與融資分析
- 聯邦基礎設施資金(NEVI、CFI 計畫)
- IRA製造業獎勵措施和OBBBA修改
- 州和地區撥款項目(HVIP、NYTVIP、德克薩斯州)
- 對轉換技術公司的私人投資
- 充電基礎設施整合
- 充電站設計及場地規劃
- 公用事業協調與互聯時間表
- 管理式充電策略
- 充電器與車輛的兼容性(CCS、J1772、功率位準)
- 車輛平台適用性及驗證
- 平台選擇標準
- 福特全順平台分析
- RAM ProMaster平台分析
- GM Express/Savana平台分析
第4章:競爭格局
- 介紹
- 公司市佔率分析
- 北美洲
- 歐洲
- 亞太地區
- 拉丁美洲
- MEA
- 主要市場參與者的競爭分析
- 競爭定位矩陣
- 戰略展望矩陣
- 關鍵進展
- 併購
- 合作夥伴關係與合作
- 新產品發布
- 擴張計劃和資金
- 產品和服務基準測試
- 研發投資分析
- 供應商選擇標準
第5章:市場估價與預測:依車輛類型分類,2021-2034年
- 輕型商用車
- 中型商用車
- 重型商用車輛
第6章:市場估算與預測:依轉換率分類,2021-2034年
- 全電動改裝套件
- 油電改裝套件
第7章:市場估算與預測:以推進方式分類,2021-2034年
- 小於 100 千瓦
- 100-200千瓦
- 大於200千瓦
第8章:市場估算與預測:依最終用途分類,2021-2034年
- 商業車隊營運商
- 物流和配送公司
- 市政當局
- 公用事業和服務提供者
- 中小企業
第9章:市場估算與預測:依銷售管道分類,2021-2034年
- OEM改裝套件
- 售後改裝套件
- 認證改造商
第10章:市場估計與預測:依地區分類,2021-2034年
- 北美洲
- 美國
- 加拿大
- 歐洲
- 德國
- 英國
- 法國
- 義大利
- 西班牙
- 北歐
- 俄羅斯
- 波蘭
- 羅馬尼亞
- 亞太地區
- 中國
- 印度
- 日本
- 韓國
- 澳新銀行
- 越南
- 印尼
- 拉丁美洲
- 巴西
- 墨西哥
- 阿根廷
- MEA
- 南非
- 沙烏地阿拉伯
- 阿拉伯聯合大公國
第11章:公司簡介
- 全球公司
- ABT e-Line
- BEDEO
- Contravans
- E-Drive Retrofits
- EV West
- Lightning eMotors
- Motiv Power Systems
- REE Automotive
- Ricardo
- SEA Electric (Exro)
- 區域玩家
- BisonEV Retrofits
- Efficient Drivetrains Inc. (EDI)
- Hyliion
- Logan Bus Company
- Odyne Systems
- Optimal EV
- Phoenix Motorcars
- TransPower
- Unique Electric Solutions
- US Hybrid
- 新興玩家
- Arrival
- Bollinger Motors
- Canoo
- Chanje
- Electric Last Mile Solutions (ELMS)
- GreenPower Motor Company
- Harbinger Motors
- Proterra
- Rivian (Commercial Van Division)
- Vicinity Motor Corp
The Global Electric Van Conversion Kits Market was valued at USD 860 million in 2024 and is estimated to grow at a CAGR of 8.9% to reach USD 2.02 billion by 2034.
Advancements in telematics, IoT systems, and modern fleet-management software are enabling operators to optimize vehicle usage by improving route planning, battery utilization, and maintenance scheduling. Conversion kits themselves are becoming more advanced as technology evolves, supporting the shift toward flexible ownership models. Many fleet operators are moving from outright purchasing to subscription and pay-per-use options, allowing them to convert vans to electric power with minimal upfront capital. These financial models create more predictable monthly expenses and allow fleet operators, especially smaller businesses, to scale as operational needs change. The broader shift toward electric mobility is further supported by increasing integration between hardware providers and digital service platforms, giving operators greater access to turnkey electrification solutions. As the market accelerates, electric van conversions are becoming a practical and cost-effective pathway for organizations seeking lower emissions, higher efficiency, and improved operational control across urban and regional transport routes.
| Market Scope | |
|---|---|
| Start Year | 2024 |
| Forecast Year | 2025-2034 |
| Start Value | $860 Million |
| Forecast Value | $2.02 Billion |
| CAGR | 8.9% |
The light commercial vans segment held a 76.7% share in 2024 and is anticipated to grow at a 9.6% CAGR through 2025-2034. This dominance is supported by the alignment between typical light-commercial duty cycles and current battery-electric capabilities, with daily mileage requirements and payload needs fitting within contemporary electric van performance profiles. Expanding access to low-emission zones and favorable operating costs further strengthen adoption as the total cost of ownership continues to improve across key regions.
The full conversion kits segment held a 67% share in 2024 and is expected to grow at a CAGR of 10% from 2025 to 2034. Fully electric conversion packages are moving toward modular, platform-agnostic engineering that shortens installation times and broadens compatibility across various van models. Integrated battery and motor systems built around standardized high-voltage components, combined with telematics-supported diagnostics, are increasing utilization rates for fleets and enhancing the appeal of electrification for last-mile and urban delivery applications.
US Electric Van Conversion Kits Market reached USD 257.1 million in 2024. Strong corporate sustainability targets, paired with federal and state emissions requirements, are motivating fleets to adopt conversion kits as a cost-effective alternative to purchasing new electric vans. Government funding, tax incentives, and grants assist small and mid-sized organizations in transitioning quickly, prompting municipalities and logistics providers to rely more heavily on retrofitting to meet compliance timelines.
Key companies active in the Electric Van Conversion Kits Market include ABT e-Line, BEDEO, Contravans, E-Drive Retrofits, EV West, Motiv Power Systems, REE Automotive, Ricardo, and SEA Electric (Exro). Companies in the Electric Van Conversion Kits Market are strengthening their market position by developing modular, standardized platforms that work across multiple vehicle types, reducing installation complexity and shortening fleet downtime. Many firms are expanding service partnerships with fleet operators to offer bundled packages that include conversion hardware, software integration, maintenance, and telematics support. Subscriptions and leasing programs are becoming central strategies, allowing customers to adopt electrification with reduced upfront costs.
Table of Contents
Chapter 1 Methodology
- 1.1 Market scope and definition
- 1.2 Research design
- 1.2.1 Research approach
- 1.2.2 Data collection methods
- 1.3 Data mining sources
- 1.3.1 Global
- 1.3.2 Regional/Country
- 1.4 Base estimates and calculations
- 1.4.1 Base year calculation
- 1.4.2 Key trends for market estimation
- 1.5 Primary research and validation
- 1.5.1 Primary sources
- 1.6 Forecast model
- 1.7 Research assumptions and limitations
Chapter 2 Executive Summary
- 2.1 Industry 360° synopsis
- 2.2 Key market trends
- 2.2.1 Regional
- 2.2.2 Vehicle
- 2.2.3 Conversion
- 2.2.4 Propulsion
- 2.2.5 End Use
- 2.2.6 Sales channel
- 2.3 TAM analysis, 2025-2034
- 2.4 CXO perspectives: Strategic imperatives
- 2.4.1 Executive decision points
- 2.4.2 Critical success factors
- 2.5 Future outlook
- 2.6 Strategic recommendations
Chapter 3 Industry Insights
- 3.1 Industry ecosystem analysis
- 3.1.1 Supplier landscape
- 3.1.2 Profit margin
- 3.1.3 Cost structure
- 3.1.4 Value addition at each stage
- 3.1.5 Factor affecting the value chain
- 3.1.6 Disruptions
- 3.2 Industry impact forces
- 3.2.1 Growth drivers
- 3.2.1.1 Preference for flexible mobility over ownership
- 3.2.1.2 Growing EV adoption and fleet electrification
- 3.2.1.3 Rising corporate fleet demand
- 3.2.1.4 Connected vehicle and telematics advancements
- 3.2.2 Industry pitfalls and challenges
- 3.2.2.1 High capital investment
- 3.2.2.2 Regulatory and insurance challenges
- 3.2.3 Market opportunities
- 3.2.3.1 Expansion in emerging urban markets
- 3.2.3.2 Integration with smart cities and MaaS platforms
- 3.2.3.3 Bundled services with insurance and maintenance
- 3.2.3.4 Specialized EV and commercial vehicle solutions
- 3.2.1 Growth drivers
- 3.3 Growth potential analysis
- 3.4 Regulatory landscape
- 3.4.1 Global
- 3.4.1.1 EPA alternative fuel conversion regulations
- 3.4.1.2 NHTSA FMVSS standards (FMVSS 305a)
- 3.4.1.3 CARB certification requirements
- 3.4.1.4 Age-based certification pathways
- 3.4.2 North America
- 3.4.3 Europe
- 3.4.4 Asia Pacific
- 3.4.5 Latin America
- 3.4.6 Middle East & Africa
- 3.4.1 Global
- 3.5 Porter's analysis
- 3.6 PESTEL analysis
- 3.7 Technology and innovation landscape
- 3.7.1 Current technological trends
- 3.7.1.1 Battery technology evolution (NMC, LFP, solid-state roadmap)
- 3.7.1.2 Motor & inverter advancements (coil driver tech, efficiency gains)
- 3.7.1.3 Thermal management systems (passive vs active cooling)
- 3.7.2 Emerging technologies
- 3.7.2.1 Vehicle control unit (VCU) & software architecture
- 3.7.2.2 Regenerative braking optimization
- 3.7.2.3 Modular & scalable battery configurations
- 3.7.2.4 Integrated charging solutions (on-board charger integration)
- 3.7.1 Current technological trends
- 3.8 Pricing analysis
- 3.8.1 Conversion kit pricing by vehicle class
- 3.8.2 Battery pack cost trends
- 3.8.3 Installation labor cost structure
- 3.8.4 Charging infrastructure costs (Level 2 vs DC fast charging)
- 3.9 Cost breakdown analysis
- 3.10 Patent analysis
- 3.10.1 Powertrain integration patents
- 3.10.2 Battery packaging & thermal management patents
- 3.10.3 Electronic gearing & coil driver technology patents (Exro)
- 3.10.4 Charging interface & communication protocol patents
- 3.11 Sustainability and environmental aspects
- 3.11.1 Sustainable practices
- 3.11.2 Waste reduction strategies
- 3.11.3 Energy efficiency in production
- 3.11.4 Eco-friendly initiatives
- 3.11.5 Carbon footprint considerations
- 3.12 Use cases
- 3.13 Best case scenario
- 3.14 Investment & funding analysis
- 3.14.1 Federal infrastructure funding (NEVI, CFI programs)
- 3.14.2 IRA manufacturing incentives & OBBBA modifications
- 3.14.3 State & regional grant programs (HVIP, NYTVIP, Texas)
- 3.14.4 Private investment in conversion technology companies
- 3.15 Charging infrastructure integration
- 3.15.1 Depot charging design & site planning
- 3.15.2 Utility coordination & interconnection timelines
- 3.15.3 Managed charging strategies
- 3.15.4 Charger-vehicle compatibility (CCS, J1772, power levels)
- 3.16 Vehicle platform suitability & validation
- 3.16.1 Platform selection criteria
- 3.16.2 Ford Transit platform analysis
- 3.16.3 RAM ProMaster platform analysis
- 3.16.4 GM Express/Savana platform analysis
Chapter 4 Competitive Landscape, 2024
- 4.1 Introduction
- 4.2 Company market share analysis
- 4.2.1 North America
- 4.2.2 Europe
- 4.2.3 Asia Pacific
- 4.2.4 LATAM
- 4.2.5 MEA
- 4.3 Competitive analysis of major market players
- 4.4 Competitive positioning matrix
- 4.5 Strategic outlook matrix
- 4.6 Key developments
- 4.6.1 Mergers & acquisitions
- 4.6.2 Partnerships & collaborations
- 4.6.3 New product launches
- 4.6.4 Expansion plans and funding
- 4.7 Product and service benchmarking
- 4.8 R&D investment analysis
- 4.9 Vendor selection criteria
Chapter 5 Market Estimates & Forecast, By Vehicle, 2021 - 2034 ($Mn, Units)
- 5.1 Key trends
- 5.2 Light commercial vehicles
- 5.3 Medium commercial vehicles
- 5.4 Heavy commercial vehicles
Chapter 6 Market Estimates & Forecast, By Conversion, 2021 - 2034 ($Mn, Units)
- 6.1 Key trends
- 6.2 Fully electric conversion kits
- 6.3 Hybrid electric conversion kits
Chapter 7 Market Estimates & Forecast, By Propulsion, 2021 - 2034 ($Mn, Units)
- 7.1 Key trends
- 7.2 < 100 kW
- 7.3 100-200 kW
- 7.4 >200 kW
Chapter 8 Market Estimates & Forecast, By End Use, 2021 - 2034 ($Mn, Units)
- 8.1 Key trends
- 8.2 Commercial fleet operators
- 8.3 Logistics & delivery companies
- 8.4 Municipal authorities
- 8.5 Utility & service providers
- 8.6 Small & medium enterprises
Chapter 9 Market Estimates & Forecast, By Sales Channel, 2021 - 2034 ($Mn, Units)
- 9.1 Key trends
- 9.2 OEM conversion kits
- 9.3 Aftermarket conversion kits
- 9.4 Certified retrofitters
Chapter 10 Market Estimates & Forecast, By Region, 2021 - 2034 ($Mn, Units)
- 10.1 Key trends
- 10.2 North America
- 10.2.1 US
- 10.2.2 Canada
- 10.3 Europe
- 10.3.1 Germany
- 10.3.2 UK
- 10.3.3 France
- 10.3.4 Italy
- 10.3.5 Spain
- 10.3.6 Nordics
- 10.3.7 Russia
- 10.3.8 Poland
- 10.3.9 Romania
- 10.4 Asia Pacific
- 10.4.1 China
- 10.4.2 India
- 10.4.3 Japan
- 10.4.4 South Korea
- 10.4.5 ANZ
- 10.4.6 Vietnam
- 10.4.7 Indonesia
- 10.5 Latin America
- 10.5.1 Brazil
- 10.5.2 Mexico
- 10.5.3 Argentina
- 10.6 MEA
- 10.6.1 South Africa
- 10.6.2 Saudi Arabia
- 10.6.3 UAE
Chapter 11 Company Profiles
- 11.1 Global companies
- 11.1.1 ABT e-Line
- 11.1.2 BEDEO
- 11.1.3 Contravans
- 11.1.4 E-Drive Retrofits
- 11.1.5 EV West
- 11.1.6 Lightning eMotors
- 11.1.7 Motiv Power Systems
- 11.1.8 REE Automotive
- 11.1.9 Ricardo
- 11.1.10 SEA Electric (Exro)
- 11.2 Regional players
- 11.2.1 BisonEV Retrofits
- 11.2.2 Efficient Drivetrains Inc. (EDI)
- 11.2.3 Hyliion
- 11.2.4 Logan Bus Company
- 11.2.5 Odyne Systems
- 11.2.6 Optimal EV
- 11.2.7 Phoenix Motorcars
- 11.2.8 TransPower
- 11.2.9 Unique Electric Solutions
- 11.2.10 US Hybrid
- 11.3 Emerging players
- 11.3.1 Arrival
- 11.3.2 Bollinger Motors
- 11.3.3 Canoo
- 11.3.4 Chanje
- 11.3.5 Electric Last Mile Solutions (ELMS)
- 11.3.6 GreenPower Motor Company
- 11.3.7 Harbinger Motors
- 11.3.8 Proterra
- 11.3.9 Rivian (Commercial Van Division)
- 11.3.10 Vicinity Motor Corp
 北美廂型車市場:市佔率分析、產業趨勢與統計及成長預測(2026-2031 年)
 廂型車市場-全球產業規模、佔有率、趨勢、機會與預測:按載重能力、驅動方式、應用、地區和競爭格局分類,2021-2031年
 電動車底盤域控制單元市場按控制架構、車輛類型、底盤功能、自動駕駛等級和作業系統分類 - 全球預測(2026-2032 年)歐洲廂型車市場-佔有率分析、產業趨勢與統計、成長預測(2026-2031)
 廂型車市場機會、成長促進因素、產業趨勢分析及預測(2026-2035年)
 2032 年廂型車改裝市場預測:按車型、尺寸、改裝、應用、最終用戶和地區進行的全球分析美國貨車:市場佔有率分析、行業趨勢和統計數據、成長預測(2025-2030 年)
 貨車市場規模、佔有率、趨勢分析報告:按噸位、推進器、最終用途、地區、細分市場預測,2025-2030 年