


 |
市場調查報告書
商品編碼
1693614
美國貨車:市場佔有率分析、行業趨勢和統計數據、成長預測(2025-2030 年)United States Vans - Market Share Analysis, Industry Trends & Statistics, Growth Forecasts (2025 - 2030) |
||||||
價格
※ 本網頁內容可能與最新版本有所差異。詳細情況請與我們聯繫。
簡介目錄
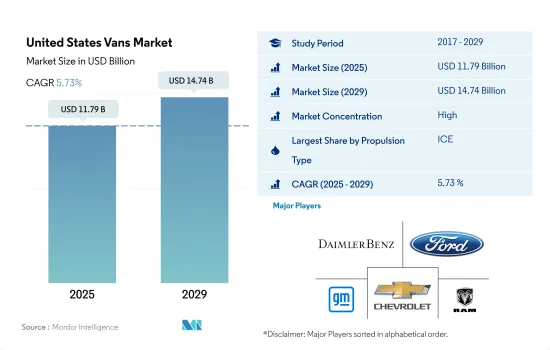
預計 2025 年美國貨車市場規模將達到 117.9 億美元,預計到 2029 年將達到 147.4 億美元,預測期間(2025-2029 年)的複合年成長率為 5.73%。
美國輕型商用車市場預計將從 2017 年的 41 萬輛成長到 2022 年的 33 萬輛,然後在 2024 年恢復到 346,949 輛。
- 2022年美國輕型商用車銷售量將降至33萬輛,延續2021年34萬輛的下降趨勢。過去幾年來一直出現這種下降趨勢,反映出商業物流和城市規劃的變化導致對這些車輛的需求減少,尤其是在人口稠密的地區。然而,市場似乎正在趨於穩定。 2023 年的預測銷售量約為 332,665 輛。預計 2024 年銷量將復甦,達到約 346,949 輛,顯示輕型商用車的需求可能會復甦。
- 2017年,美國輕型商用車市場銷售強勁,達41萬輛。直到 2019 年,銷售量一直保持相對穩定,但從 2020 年開始大幅下降。最初的穩定歸因於那些嚴重依賴這些貨車來滿足運輸和物流需求的行業。然而,隨後的下降與城市擁擠和不斷發展的經營模式帶來的挑戰相吻合,這些模式傾向於更緊湊、更有效率的交通解決方案。
- 展望2024年以後,美國輕型商用車市場將逐步復甦。儘管銷量會略有波動,但預計將保持上升趨勢,到 2030 年將達到 385,000 輛。汽車設計的進步、送貨上門服務的需求不斷成長以及城市基礎設施的不斷發展預計將推動這一成長。
美國廂型車市場趨勢
政府措施和不斷成長的需求推動美國電動車銷售繁榮
- 近年來,美國電動車(EV)的普及率一直呈現蓬勃發展之勢。這種成長是由人們對電動車的認知不斷提高、對環境問題的日益關注以及政府監管所推動的。特別是2016年,加州推出了零排放汽車(ZEV)計劃,旨在減少二氧化碳排放,改善空氣品質。這項措施不僅推動了加州電動車的普及,也影響了其他州採取類似的零排放汽車法規。因此,2017 年至 2022 年間,電池式電動車(BEV) 的需求激增 634%。
- 美國對電動商用車的需求也在上升。電子商務行業的蓬勃發展、物流活動的增加以及政府對清潔交通的舉措等因素正在推動這一成長。紐約州州長於2021年9月簽署了一項重要措施—先進清潔卡車(ACT)法規。該法規設定的目標是到2035年使所有新型輕型汽車實現零排放,到2045年使所有中型和重型汽車實現零排放。受此影響,2022年美國電動商用車需求與前一年同期比較激增21%。
- 政府的回扣、補貼和戰略規劃等措施正在進一步支持全國範圍內的汽車電氣化。 2022年5月,拜登總統宣布了一項30億美元的計劃,旨在促進國內電池製造業的發展,以實現從燃氣驅動汽車向電動車的過渡。預計這項措施將顯著推動該國的電動車發展,尤其是在 2024 年至 2030 年期間,從而增加對電池組的需求。
美國貨車產業概況
美國廂型車市場格局較為集中,前五大公司佔79.21%的市佔率。該市場的主要企業有:戴姆勒股份公司(梅賽德斯-奔馳股份公司)、福特汽車公司、通用汽車公司、通用汽車公司(雪佛蘭)和Ram Trucking, Inc.(按字母順序排列)
其他福利
- Excel 格式的市場預測 (ME) 表
- 3個月的分析師支持
目錄
第1章執行摘要和主要發現
第2章 報告要約
第3章 引言
- 研究假設和市場定義
- 研究範圍
- 調查方法
第4章 產業主要趨勢
- 人口
- 人均GDP
- 消費者汽車支出(cvp)
- 通貨膨脹率
- 汽車貸款利率
- 共乘
- 電氣化的影響
- 電動車充電站
- 電池組價格
- 新款 Xev 車型發布
- 燃油價格
- OEM生產統計
- 法律規範
- 價值鍊和通路分析
第5章市場區隔
- 推進類型
- 混合動力汽車和電動車
- 按燃料類別
- BEV
- HEV
- ICE
- 按燃料類別
- 柴油引擎
- 汽油
- 混合動力汽車和電動車
第6章競爭格局
- 關鍵策略趨勢
- 市場佔有率分析
- 商業狀況
- 公司簡介
- Daimler AG(Mercedes-Benz AG)
- Fiat Chrysler Automobiles NV
- Ford Motor Company
- General Motors Company
- GM Motor(Chevrolet)
- IVECO SpA
- Nissan Motor Co. Ltd.
- Ram Trucking, Inc.
- Volkswagen AG
- Workhorse Group Inc.
第7章:CEO面臨的關鍵策略問題
第 8 章 附錄
- 世界概況
- 概述
- 五力分析框架
- 全球價值鏈分析
- 市場動態(DRO)
- 資訊來源及延伸閱讀
- 圖片列表
- 關鍵見解
- 數據包
- 詞彙表
簡介目錄
Product Code: 92998
The United States Vans Market size is estimated at 11.79 billion USD in 2025, and is expected to reach 14.74 billion USD by 2029, growing at a CAGR of 5.73% during the forecast period (2025-2029).
US light commercial van market grew from 410,000 units in 2017 to 330,000 in 2022, with a rebound to 346,949 units expected by 2024
- In 2022, the sales of light commercial vans in the United States dipped to 330,000 units, continuing the downward trend from the 2021 figure of 340,000 units. This decline, observed over the past few years, reflects shifting dynamics in business logistics and urban planning, resulting in reduced demand for these vehicles, particularly in densely populated areas. However, the market appears to be stabilizing. Projections for 2023 indicated sales of around 332,665 units. A rebound is anticipated in 2024, with sales forecasted to reach approximately 346,949 units, signaling a potential resurgence in demand for light commercial vans.
- Back in 2017, the US light commercial van market boasted a robust figure of 410,000 units. Sales remained relatively steady until 2019, but a notable decline set in from 2020. The initial stability can be attributed to sectors heavily reliant on these vans for their transportation and logistics needs. However, the subsequent drop aligns with the challenges posed by urban congestion and evolving business models, favoring more compact and efficient transport solutions.
- Looking beyond 2024, the US light commercial van market is poised for a gradual recovery. Sales volumes are projected to exhibit slight fluctuations but maintain an upward trajectory, culminating in an estimated 380,500 units by 2030. Factors such as advancements in vehicle design, a growing appetite for door-to-door delivery services, and the evolution of urban infrastructure are expected to fuel this growth.
United States Vans Market Trends
Rapid growth in electric vehicle sales driven by government initiatives and increasing demand in the US
- The United States has witnessed a significant surge in the adoption of electric vehicles (EVs) in recent years. This uptick can be attributed to a heightened awareness of EVs, growing environmental concerns, and the implementation of government regulations. Notably, in 2016, California introduced the Zero-Emission Vehicle (ZEV) program aimed at curbing carbon emissions and improving air quality. This initiative has not only spurred the growth of electric cars within California but has also influenced other states to adopt similar ZEV regulations. Consequently, the nation saw a remarkable 634% surge in demand for battery electric vehicles (BEVs) from 2017 to 2022.
- The demand for electric commercial vehicles in the United States is also on the rise. Factors such as the booming e-commerce industry, increased logistics activities, and governmental initiatives for cleaner transportation have fueled this growth. In a significant move, the governor of New York signed the Advanced Clean Truck (ACT) Rule in September 2021. This rule sets a target for all new light-duty vehicles to be zero-emission by 2035 and the same for medium- and heavy-duty vehicles by 2045. As a result, the United States witnessed a 21% surge in demand for electric commercial vehicles in 2022 compared to the previous year.
- Governmental efforts, including rebates, subsidies, and strategic plans, are further bolstering the electrification of vehicles nationwide. In May 2022, President Biden unveiled a USD 3 billion plan to expedite domestic battery manufacturing, with the aim of transitioning gas-powered vehicles to electric ones. This push is expected to significantly boost electric mobility in the country, particularly during 2024-2030, thereby amplifying the demand for battery packs.
United States Vans Industry Overview
The United States Vans Market is fairly consolidated, with the top five companies occupying 79.21%. The major players in this market are Daimler AG (Mercedes-Benz AG), Ford Motor Company, General Motors Company, GM Motor (Chevrolet) and Ram Trucking, Inc. (sorted alphabetically).
Additional Benefits:
- The market estimate (ME) sheet in Excel format
- 3 months of analyst support
TABLE OF CONTENTS
1 EXECUTIVE SUMMARY & KEY FINDINGS
2 REPORT OFFERS
3 INTRODUCTION
- 3.1 Study Assumptions & Market Definition
- 3.2 Scope of the Study
- 3.3 Research Methodology
4 KEY INDUSTRY TRENDS
- 4.1 Population
- 4.2 GDP Per Capita
- 4.3 Consumer Spending For Vehicle Purchase (cvp)
- 4.4 Inflation
- 4.5 Interest Rate For Auto Loans
- 4.6 Shared Rides
- 4.7 Impact Of Electrification
- 4.8 EV Charging Station
- 4.9 Battery Pack Price
- 4.10 New Xev Models Announced
- 4.11 Fuel Price
- 4.12 Oem-wise Production Statistics
- 4.13 Regulatory Framework
- 4.14 Value Chain & Distribution Channel Analysis
5 MARKET SEGMENTATION (includes market size in Value in USD and Volume, Forecasts up to 2029 and analysis of growth prospects)
- 5.1 Propulsion Type
- 5.1.1 Hybrid and Electric Vehicles
- 5.1.1.1 By Fuel Category
- 5.1.1.1.1 BEV
- 5.1.1.1.2 HEV
- 5.1.2 ICE
- 5.1.2.1 By Fuel Category
- 5.1.2.1.1 Diesel
- 5.1.2.1.2 Gasoline
- 5.1.1 Hybrid and Electric Vehicles
6 COMPETITIVE LANDSCAPE
- 6.1 Key Strategic Moves
- 6.2 Market Share Analysis
- 6.3 Company Landscape
- 6.4 Company Profiles
- 6.4.1 Daimler AG (Mercedes-Benz AG)
- 6.4.2 Fiat Chrysler Automobiles N.V
- 6.4.3 Ford Motor Company
- 6.4.4 General Motors Company
- 6.4.5 GM Motor (Chevrolet)
- 6.4.6 IVECO S.p.A
- 6.4.7 Nissan Motor Co. Ltd.
- 6.4.8 Ram Trucking, Inc.
- 6.4.9 Volkswagen AG
- 6.4.10 Workhorse Group Inc.
7 KEY STRATEGIC QUESTIONS FOR VEHICLES CEOS
8 APPENDIX
- 8.1 Global Overview
- 8.1.1 Overview
- 8.1.2 Porter's Five Forces Framework
- 8.1.3 Global Value Chain Analysis
- 8.1.4 Market Dynamics (DROs)
- 8.2 Sources & References
- 8.3 List of Tables & Figures
- 8.4 Primary Insights
- 8.5 Data Pack
- 8.6 Glossary of Terms
02-2729-4219
+886-2-2729-4219
 北美廂型車市場:市佔率分析、產業趨勢與統計及成長預測(2026-2031 年)
 廂型車市場-全球產業規模、佔有率、趨勢、機會與預測:按載重能力、驅動方式、應用、地區和競爭格局分類,2021-2031年
 電動車底盤域控制單元市場按控制架構、車輛類型、底盤功能、自動駕駛等級和作業系統分類 - 全球預測(2026-2032 年)歐洲廂型車市場-佔有率分析、產業趨勢與統計、成長預測(2026-2031)
 廂型車市場機會、成長促進因素、產業趨勢分析及預測(2026-2035年)電動貨車改裝套件市場機會、成長促進因素、產業趨勢分析及預測(2025-2034年)
 2032 年廂型車改裝市場預測:按車型、尺寸、改裝、應用、最終用戶和地區進行的全球分析
 貨車市場規模、佔有率、趨勢分析報告:按噸位、推進器、最終用途、地區、細分市場預測,2025-2030 年