

 |
市場調查報告書
商品編碼
2124710
石油和天然氣行業的無損檢測 (NDT):市場佔有率分析、行業趨勢和統計數據以及成長預測 (2026-2031)Oil And Gas NDT - Market Share Analysis, Industry Trends & Statistics, Growth Forecasts (2026 - 2031) |
||||||

※ 本網頁內容可能與最新版本有所差異。詳細情況請與我們聯繫。
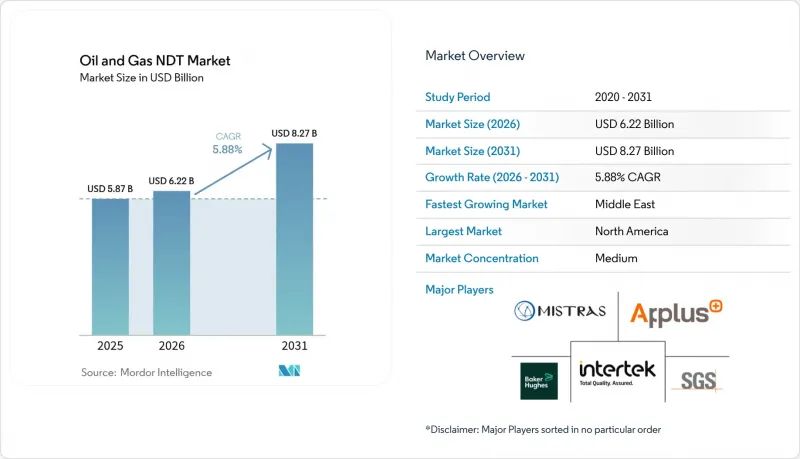
根據 Mordor Intelligence 預測,石油和天然氣行業的無損檢測 (NDT) 市場規模將從 2025 年的 58.7 億美元成長到 2026 年的 62.2 億美元,然後在 2031 年達到 82.7 億美元,2026 年至 2031 年的複合年成長率為 5.8%。
本報告按組件(設備、軟體等)、檢測方法(超音波檢測、射線檢測、磁粉檢測等)、技術(傳統方法、人工智慧方法)和地區(北美、南美、歐洲、亞太、中東和非洲)進行分類。市場預測以美元計價。
全球油氣產業無損檢測 (NDT) 市場趨勢與洞察
上游資產健康管理的數位化正在加速無損檢測 (NDT) 的轉型。
將人工智慧 (AI) 引擎整合到超音波和視覺檢測工作流程中,可將評估週期縮短高達 90%。採用雲端連線分析工具的企業可以利用即時缺陷分類和自動報告功能,從而減輕合規負擔。早期應用案例,例如 AI 驅動的焊接分類,準確率高達 94%,已在解決技術純熟勞工短缺問題方面取得了顯著成效。這些演算法還支援預測性維護程序,將檢測計劃從基於日曆的安排轉變為基於風險的觸發機制,從而提高資產運作並降低整體檢測成本。設備供應商正擴大將邊緣運算模組與相位陣列探頭捆綁在一起,將硬體轉變為資料節點,並將資料饋送到數位孿生模型中。隨著資料湖的擴展,服務合約擴大採用基於績效的定價方式,而不是按小時計費,以此獎勵那些能夠提供可衡量的可靠性改進的供應商。
深海探勘計畫推動了對先進無損檢測 (NDT) 的需求。
在水深超過3000公尺的海域安裝浮體式生產系統,推動了對能夠偵測±0.5毫米壁厚減薄的海底相容型相位陣列掃描儀的需求。部署在遙控潛水器(ROV)上的探勘設備消除了潛水員暴露於危險環境的風險,同時將船舶停留時間縮短了高達70%。一種新型感測器組件將渦流陣列與聲發射模組結合,用於研究承受極端動態載荷的懸索立管中的疲勞熱點。創新的磁性儲存診斷技術與深度學習模型相結合,在立管內部的點蝕、溝槽狀壁厚減薄和磨損分類方面,檢驗準確率達到了95.4%。隨著油桶成本的上漲,營運商越來越願意為能夠在一次部署中提供完整數位資料集的檢測船支付高額的日租金。這些高價值項目正在為深海無損檢測解決方案供應商帶來多年服務契約,並確保可預測的現金流。
原油價格波動抑制了服務業需求。
2025年初,布蘭特原油價格跌至每桶66.65美元,跌幅達兩位數。當時有預測稱,若原油價格跌破每桶60美元,美國陸上石油活動將減少20%。歷史上,原油價格每下跌5美元,頁岩油相關支出就會減少約5%,進而導致需要檢驗的焊接、立管和輸油管數量減少。雖然海外業務對價格波動較不敏感,但國內服務公司正面臨鑽機數量減少、運轉率下降以及每日租金壓力。同時,高達2,000億美元的併購活動將購買力集中在少數幾家超級巨頭手中,使這些公司能夠談判更優惠的價格和更長的付款期限。高規格的深海專案受到的影響較小,但週期短的陸上石油活動對價格波動的抵抗力正在增強。
細分市場分析
隨著營運商從設備所有權轉向承包檢測結果採購,服務業的預算撥款增加。在人工智慧分析、機器人技術和健康數據託管等技術的推動下,服務市場規模預計將以6.62%的複合年成長率成長。這使得專業供應商相對於內部團隊更具優勢。全球服務鏈透過整合多學科團隊和雲端儀錶板,降低了內部管理成本,並能立即向監管機構提供報告。
設備部門維持47.25%的顯著營收佔有率,這得益於對相位陣列、高速射線照相和緊湊型CT掃描儀的資本投資。供應商正透過開放API實現硬體差異化,這些API可將偵測資料直接傳輸到企業的資產管理平台,並透過預測性維護軟體和校準合約拓展生命週期收入。
區域分析
北美擁有260萬英里的管道網路,加上美國石油天然氣安全管理局(PHMSA)嚴格的監管規定(要求更頻繁的檢查),預計到2025年,北美將佔全球管道支出的38.35%。近期訂定的洩漏檢測和硬點評估法規預計將增加競標數量,而公共資金支持的管道更換項目預計將擴大管道覆蓋範圍。領先的服務供應商正透過收購來擴大規模,整合實驗室、現場工作人員和數位平台,從而為墨西哥灣頁岩盆地和深海油田提供一站式解決方案。
中東地區正處於最快成長軌道,複合年成長率達6.78%,這主要得益於各國國家石油公司為響應「2030願景」的多元化目標而加強其完整性管理專案。與沙烏地阿美和阿布達比國家石油公司(ADNOC)的長期夥伴關係,促使各公司優先在以往無法進行管道清管器檢測的管道中使用機器人爬行器和線上檢測工具。在地採購政策也推動了新培訓中心的建立,以認證當地技術人員。在炎熱的沙漠環境中,遠端和自主偵測技術正被推廣,加速部署配備全景攝影機和相位陣列探頭的無人機和爬行機器人。
在歐洲,受成熟資產改造和嚴格的環境目標推動,預計將穩定成長。營運商正利用先進的腐蝕測繪和焊接堆焊技術維修北海基礎設施。同時,歐盟的甲烷排放法規推動了對高靈敏度洩漏檢測的需求,該技術結合了傳統超音波和衛星資料饋送。在亞太地區,澳洲和日本致力於延長老舊天然氣資產的使用壽命,而印度和東南亞正在建設新的中游能力,這為建設階段的射線照相檢測和運營階段的超音波測繪創造了雙重機遇。在拉丁美洲和非洲,由於巴西和莫三比克的海上作業,檢測需求不斷成長,但資金籌措週期仍然容易受到價格波動和政治局勢變化的影響。
其他好處:
- Excel格式的市場預測(ME)表
- 3個月的分析師支持
目錄
第1章:引言
- 研究假設和市場定義
- 調查範圍
第2章:調查方法
第3章執行摘要
第4章 市場狀況
- 市場概覽
- 市場促進因素
- 上游資產穩健性管理的數位化
- 深海和超深海探勘計畫的數量正在增加。
- 成熟油田老化的管道基礎設施
- 監管機構縮短了強制性定期檢查的間隔時間。
- 相位陣列超音波和先進電腦斷層掃描技術的引入
- 無人機和機器人結合用於危險區域巡檢
- 市場限制因素
- 原油價格波動抑制了資本投資週期。
- 能夠操作先進無損檢測 (NDT) 技術的熟練人員短缺。
- 基於雲端的無損檢測 (NDT) 分析中的資料安全問題
- 先進設備的初始成本很高。
- 產業價值鏈分析
- 宏觀經濟因素的影響
- 監理情勢
- 技術展望
- 波特五力分析
第5章 市場規模與成長預測
- 按組件
- 裝置
- 軟體
- 服務
- 消耗品
- 透過測試方法
- 超音波檢查
- 放射檢查
- 磁粉檢測
- 液體滲透探傷
- 目視檢查
- 電渦流檢測
- 聲發射測試
- 熱成像/紅外線檢測
- 電腦斷層掃描(CT)
- 透過方法
- 傳統型/傳統方法
- 基於人工智慧
- 按地區
- 北美洲
- 美國
- 加拿大
- 墨西哥
- 南美洲
- 巴西
- 阿根廷
- 其他南美國家
- 歐洲
- 德國
- 英國
- 法國
- 義大利
- 西班牙
- 其他歐洲國家
- 亞太地區
- 中國
- 日本
- 印度
- 韓國
- 東南亞
- 其他亞太國家
- 中東
- 沙烏地阿拉伯
- 阿拉伯聯合大公國
- 土耳其
- 其他中東國家
- 非洲
- 南非
- 奈及利亞
- 其他非洲國家
- 北美洲
第6章 競爭情勢
- 市場集中度
- 策略趨勢
- 市佔率分析
- 公司簡介
- Baker Hughes Company
- Mistras Group Inc
- SGS SA
- Intertek Group plc
- Applus Services SA
- Bureau Veritas SA
- TUV Rheinland AG
- ROSEN Group
- Oceaneering International Inc
- Eddyfi Technologies Inc
- TSC Subsea Ltd
- DNV AS
- Evident Corporation(Olympus)
- Zetec Inc
- Waygate Technologies
- YXLON International
- Magnaflux(Illinois Tool Works Inc)
- Sonatest Ltd
- FORCE Technology
- Innospection Ltd
- NDT Global GmbH and Co KG
- Acuren Inspection Inc
- Element Materials Technology Group
- TEAM Inc
- TUV SUD AG
第7章 市場機會與未來展望
According to Mordor Intelligence, the oil and Gas NDT market size is expected to grow from USD 5.87 billion in 2025 to USD 6.22 billion in 2026 and is forecast to reach USD 8.27 billion by 2031 at 5.88% CAGR over 2026-2031.
This report is Segmented by Component (Equipment, Software, and More), Testing Method (Ultrasonic Testing, Radiographic Testing, Magnetic Particle Testing, and More), Technique (Traditional/Conventional and AI-Enabled), and Geography (North America, South America, Europe, Asia Pacific, Middle East, and Africa). The Market Forecasts are Provided in Terms of Value (USD).
Global Oil And Gas NDT Market Trends and Insights
Digitization of Upstream Asset Integrity Management Accelerates NDT Transformation
Artificial-intelligence engines embedded in ultrasonic and visual inspection workflows now cut interpretation cycle times by as much as 90%. Operators adopting cloud-connected analytics gain real-time defect classification and automated report generation that eases regulatory compliance. Early deployments, including AI-driven weld classification achieving 94% accuracy, demonstrate consistent outcomes that tackle skilled-labor shortages. The same algorithms underpin predictive maintenance routines that shift inspections from calendar-based schedules to risk-based triggers, elevating asset uptime and reducing total inspection spend. Equipment vendors are increasingly bundling edge computing modules with phased-array probes, transforming hardware into data nodes that feed digital twins. As data lakes grow, service contracts increasingly specify performance-based fees rather than hourly rates, rewarding vendors that deliver measurable reliability improvements.
Deepwater Exploration Projects Drive Advanced NDT Requirements
The installation of floating production systems at depths exceeding 3,000 m stimulates demand for subsea-rated phased-array scanners capable of detecting +-0.5 mm wall loss. ROV-deployed instruments eliminate diver exposure while trimming vessel time by up to 70%. New sensor packages combine eddy-current arrays with acoustic emission modules to survey fatigue hotspots in catenary risers that are subjected to extreme dynamic loads. Novel magnetic-memory diagnostics, paired with deep-learning models, have achieved 95.4% validation accuracy in classifying pitting, groove loss, and wear on riser interiors. Given higher barrel costs, operators accept premium day rates for inspection vessels that deliver full digital data sets during a single mobilization. These high-value projects secure multi-year service agreements, ensuring predictable cash flows for suppliers of deepwater NDT solutions.
Oil Price Volatility Constrains Service Demand
A double-digit slide in Brent prices to USD 66.65/bbl early 2025 prompted forecasts of a 20% dip in U.S. onshore activity if crude falls below USD 60. A decline of USD 5 historically reduces shale spending by about 5%, resulting in fewer welds, risers, and flowlines that require inspection. Although international work shows lower sensitivity, domestic service companies face rig-count retrenchments that compress utilization and squeeze day rates. Simultaneously, an M&A wave valued at USD 200 billion has concentrated purchasing power among fewer super-majors, enabling them to negotiate sharper pricing and longer payment terms. While high-spec deepwater projects remain insulated, short-cycle land activity displays amplified elasticity to price swings.
Other drivers and restraints analyzed in the detailed report include:
- Aging Pipeline Infrastructure Creates Sustained Inspection Demand
- Regulatory Compliance Tightens Inspection Requirements
- Workforce Limitations Challenge Technology Adoption
For complete list of drivers and restraints, kindly check the Table Of Contents.
Segment Analysis
Services captured growing budget allocations as operators pivoted from owning equipment to procuring turnkey inspection outcomes. The Oil and Gas NDT market size tied to services is on track for a 6.62% CAGR, driven by the adoption of AI analytics, robotics, and integrity data hosting, which favors specialized vendors over in-house crews. Global service chains bundle multidisciplinary teams with cloud dashboards that reduce internal administrative costs and provide instant regulatory reports.
Equipment retains a substantial 47.25% revenue share, underpinned by capital spending on phased-array arrays, high-speed radiography, and compact CT scanners. Vendors differentiate hardware through open APIs that stream inspection data directly into enterprise asset-management platforms, extending lifecycle revenues via predictive-maintenance software and calibration contracts.
Complete Report Scope:
- By Component
- Equipment
- Software
- Services
- Consumables
- By Testing Method
- Ultrasonic Testing
- Radiographic Testing
- Magnetic Particle Testing
- Liquid Penetrant Testing
- Visual Inspection Testing
- Eddy-Current Testing
- Acoustic Emission Testing
- Thermography / Infrared Testing
- Computed Tomography Testing
- By Technique
- Traditional / Conventional
- AI-enabled
- By Geography
- North America
- United States
- Canada
- Mexico
- South America
- Brazil
- Argentina
- Rest of South America
- Europe
- Germany
- United Kingdom
- France
- Italy
- Spain
- Rest of Europe
- Asia Pacific
- China
- Japan
- India
- South Korea
- South-East Asia
- Rest of Asia Pacific
- Middle East
- Saudi Arabia
- United Arab Emirates
- Turkey
- Rest of Middle East
- Africa
- South Africa
- Nigeria
- Rest of Africa
- North America
Geography Analysis
North America accounted for 38.35% of global 2025 spending, driven by a 2.6-million-mile pipeline grid and stringent PHMSA mandates that mandate tighter inspection frequencies. Recent rules on leak detection and hard-spot evaluation are expected to guarantee rising bid volumes, while public-funded replacement projects are expected to enlarge the addressable footage. Major service providers deepen scale through acquisitions that integrate labs, field crews, and digital platforms, enabling one-stop solutions across shale basins and Gulf of Mexico deepwater fields.
The Middle East is recording the fastest trajectory, with a 6.78% CAGR, as national oil companies upgrade their integrity programs in alignment with Vision 2030 diversification targets. Extended partnerships with Aramco and ADNOC prioritize the use of robotic crawlers and inline-inspection tools for previously unpiggable lines, while local content policies drive the establishment of new training centers to certify indigenous technicians. High-temperature desert settings encourage remote and autonomous inspections, accelerating the adoption of drones and crawler robots equipped with panoramic cameras and phased-array probes.
Europe posts steady gains tied to the rejuvenation of mature assets and stringent environmental objectives. Operators refurbish North Sea infrastructure with advanced corrosion-mapping and weld-overlay technologies. Simultaneously, EU methane regulations drive demand for high-sensitivity leak detection, blending conventional ultrasound with satellite data feeds. In the Asia-Pacific region, Australia and Japan focus on extending the life of end-of-life gas assets, whereas India and Southeast Asia build new midstream capacity, opening up dual opportunities for construction-phase radiography and operations-phase ultrasonic mapping. Across Latin America and Africa, demand for inspections tracks offshore campaigns in Brazil and Mozambique, although funding cycles remain more sensitive to price volatility and political shifts.
- Baker Hughes Company
- Mistras Group Inc
- SGS S.A.
- Intertek Group plc
- Applus Services SA
- Bureau Veritas SA
- TUV Rheinland AG
- ROSEN Group
- Oceaneering International Inc
- Eddyfi Technologies Inc
- TSC Subsea Ltd
- DNV AS
- Evident Corporation (Olympus)
- Zetec Inc
- Waygate Technologies
- YXLON International
- Magnaflux (Illinois Tool Works Inc)
- Sonatest Ltd
- FORCE Technology
- Innospection Ltd
- NDT Global GmbH and Co KG
- Acuren Inspection Inc
- Element Materials Technology Group
- TEAM Inc
- TUV SUD AG
Additional Benefits:
- The market estimate (ME) sheet in Excel format
- 3 months of analyst support
TABLE OF CONTENTS
1 INTRODUCTION
- 1.1 Study Assumptions and Market Definition
- 1.2 Scope of the Study
2 RESEARCH METHODOLOGY
3 EXECUTIVE SUMMARY
4 MARKET LANDSCAPE
- 4.1 Market Overview
- 4.2 Market Drivers
- 4.2.1 Digitization of upstream asset integrity management
- 4.2.2 Increasing deepwater and ultra-deepwater exploration projects
- 4.2.3 Aging pipeline infrastructure in mature fields
- 4.2.4 Mandated periodic inspection intervals tightened by regulators
- 4.2.5 Adoption of phased array ultrasonic and advanced computed tomography
- 4.2.6 Integration of drones and robotics for hazardous area inspection
- 4.3 Market Restraints
- 4.3.1 Volatile crude oil prices curbing CAPEX cycles
- 4.3.2 Limited skilled workforce for advanced NDT methods
- 4.3.3 Data security concerns with cloud-based NDT analytics
- 4.3.4 High initial cost of advanced equipment
- 4.4 Industry Value Chain Analysis
- 4.5 Impact of Macroeconomic Factors
- 4.6 Regulatory Landscape
- 4.7 Technological Outlook
- 4.8 Porter's Five Forces Analysis
- 4.8.1 Threat of New Entrants
- 4.8.2 Bargaining Power of Suppliers
- 4.8.3 Bargaining Power of Buyers
- 4.8.4 Threat of Substitutes
- 4.8.5 Intensity of Competitive Rivalry
5 MARKET SIZE AND GROWTH FORECASTS (VALUE)
- 5.1 By Component
- 5.1.1 Equipment
- 5.1.2 Software
- 5.1.3 Services
- 5.1.4 Consumables
- 5.2 By Testing Method
- 5.2.1 Ultrasonic Testing
- 5.2.2 Radiographic Testing
- 5.2.3 Magnetic Particle Testing
- 5.2.4 Liquid Penetrant Testing
- 5.2.5 Visual Inspection Testing
- 5.2.6 Eddy-Current Testing
- 5.2.7 Acoustic Emission Testing
- 5.2.8 Thermography / Infrared Testing
- 5.2.9 Computed Tomography Testing
- 5.3 By Technique
- 5.3.1 Traditional / Conventional
- 5.3.2 AI-enabled
- 5.4 By Geography
- 5.4.1 North America
- 5.4.1.1 United States
- 5.4.1.2 Canada
- 5.4.1.3 Mexico
- 5.4.2 South America
- 5.4.2.1 Brazil
- 5.4.2.2 Argentina
- 5.4.2.3 Rest of South America
- 5.4.3 Europe
- 5.4.3.1 Germany
- 5.4.3.2 United Kingdom
- 5.4.3.3 France
- 5.4.3.4 Italy
- 5.4.3.5 Spain
- 5.4.3.6 Rest of Europe
- 5.4.4 Asia Pacific
- 5.4.4.1 China
- 5.4.4.2 Japan
- 5.4.4.3 India
- 5.4.4.4 South Korea
- 5.4.4.5 South-East Asia
- 5.4.4.6 Rest of Asia Pacific
- 5.4.5 Middle East
- 5.4.5.1 Saudi Arabia
- 5.4.5.2 United Arab Emirates
- 5.4.5.3 Turkey
- 5.4.5.4 Rest of Middle East
- 5.4.6 Africa
- 5.4.6.1 South Africa
- 5.4.6.2 Nigeria
- 5.4.6.3 Rest of Africa
- 5.4.1 North America
6 COMPETITIVE LANDSCAPE
- 6.1 Market Concentration
- 6.2 Strategic Moves
- 6.3 Market Share Analysis
- 6.4 Company Profiles (includes Global level Overview, Market level overview, Core Segments, Financials as available, Strategic Information, Market Rank/Share for key companies, Products and Services, and Recent Developments)
- 6.4.1 Baker Hughes Company
- 6.4.2 Mistras Group Inc
- 6.4.3 SGS S.A.
- 6.4.4 Intertek Group plc
- 6.4.5 Applus Services SA
- 6.4.6 Bureau Veritas SA
- 6.4.7 TUV Rheinland AG
- 6.4.8 ROSEN Group
- 6.4.9 Oceaneering International Inc
- 6.4.10 Eddyfi Technologies Inc
- 6.4.11 TSC Subsea Ltd
- 6.4.12 DNV AS
- 6.4.13 Evident Corporation (Olympus)
- 6.4.14 Zetec Inc
- 6.4.15 Waygate Technologies
- 6.4.16 YXLON International
- 6.4.17 Magnaflux (Illinois Tool Works Inc)
- 6.4.18 Sonatest Ltd
- 6.4.19 FORCE Technology
- 6.4.20 Innospection Ltd
- 6.4.21 NDT Global GmbH and Co KG
- 6.4.22 Acuren Inspection Inc
- 6.4.23 Element Materials Technology Group
- 6.4.24 TEAM Inc
- 6.4.25 TUV SUD AG
7 MARKET OPPORTUNITIES AND FUTURE OUTLOOK
- 7.1 White-space and unmet-need assessment

 歐洲無損檢測:市場佔有率分析、產業趨勢與統計及成長預測(2026-2031 年)歐洲無損檢測設備:市場佔有率分析、產業趨勢與統計及成長預測(2026-2031 年)航太無損檢測:市場佔有率分析、產業趨勢與統計、成長預測(2026-2031)
 無損檢測 (NDT) 設備市場:按檢測方法、設備類型、技術、產業、國家和地區分類-全球產業分析、市場規模、市場佔有率及 2026 年至 2033 年預測
 2026年全球非破壞性檢驗設備市場報告英國無損檢測 (NDT):市場佔有率分析、產業趨勢與統計、成長預測(2025-2030 年)
 非破壞性檢測設備系統市場機會、成長要素、產業趨勢分析及2026-2035年預測
 非破壞性檢驗與檢驗市場:依技術、方法、服務、自動化程度、材料類型及產業分類-2026-2032年全球市場預測
 X光非破壞性檢測設備市場規模、佔有率和趨勢分析報告:按光源類型、設備類型、技術、檢測器類型、應用、最終用戶、地區和細分市場預測(2026-2033年)
 2026年無損檢測(NDT)產業十大成長機會