


 |
市場調查報告書
商品編碼
2120298
航太無損檢測:市場佔有率分析、產業趨勢與統計、成長預測(2026-2031)Aerospace NDT - Market Share Analysis, Industry Trends & Statistics, Growth Forecasts (2026 - 2031) |
||||||

※ 本網頁內容可能與最新版本有所差異。詳細情況請與我們聯繫。
據 Mordor Intelligence 稱,航太無損檢測 (NDT) 市場預計到 2026 年價值 13 億美元,高於 2025 年的 12 億美元,預計到 2031 年將達到 19.1 億美元。
預計 2026 年至 2031 年的複合年成長率為 8.05%。
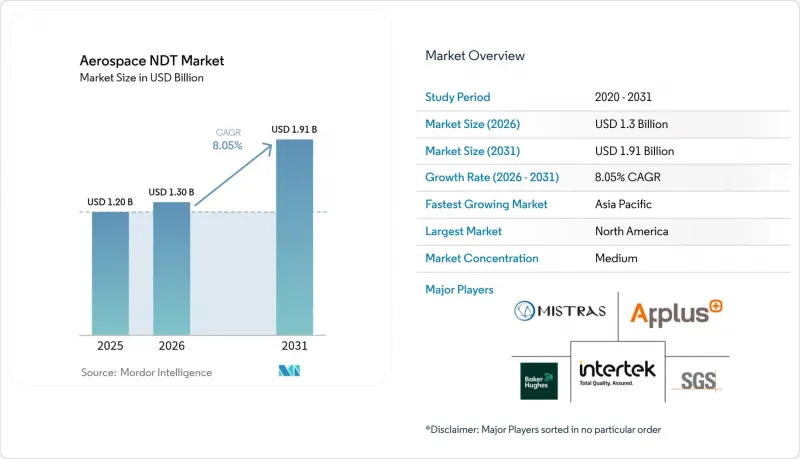
本報告按組件(設備、軟體等)、檢測方法(超音波檢測、射線檢測、磁粉檢測等)、技術(傳統技術/常規技術和人工智慧技術)以及地區(北美、南美、歐洲、亞太、中東和非洲)進行細分。市場預測以美元計價。
全球航太無損檢測 (NDT) 市場趨勢及洞察
客機產量增加
波音和空中巴士預計2024年合計交付飛機超過1,200架,是疫情以來最低水準的兩倍。這迫使生產線部署高通量檢測系統,以便在不縮短生產週期的情況下檢驗引擎吊架、機翼翼樑和機身面板。自動化相位陣列機器人目前正部署在組裝工位,用於採集可重複的掃描資料並將其輸入集中式缺陷庫。基於AS9100標準的文件要求製造商將所有超音波測量結果與特定的零件序號關聯起來,導致對數位化追溯軟體的需求逐漸增加。提供結合線上機器人和分析儀錶板解決方案的設備供應商訂單強勁,而傳統的手動工作流程已無法跟上當前的生產速度。
對維護、修理和大修 (MRO) 服務的需求不斷成長
到2025年,商用飛機的平均營運壽命將達到12.8年,這壽命週期增加了結構疲勞的風險,也加大了繁重的檢查工作量。航空公司正在延長其資產的使用壽命,以抵消窄體飛機高昂的更換週期,這導致需要定期進行電渦流檢測和輻射檢測的老舊飛機數量不斷增加。從廣州到海得拉巴,亞太地區的維修設施機庫容量已增加了兩倍,從而催生了對設備租賃、檢查員培訓和耗材供應鏈的區域性需求。預測分析平台目前正在整合飛行載入資料和無損檢測歷史數據,使工程團隊能夠根據實際應力循環來延遲或加快檢查。在這個蓬勃發展的MRO市場中,提供感測器、分析和現場服務培訓的供應商正在獲得多年框架合約。
先進無損檢測 (NDT) 設備的高購買成本
部署承包相位陣列和CT(電腦斷層掃描)系統的成本通常超過50萬美元,這給區域性MRO營運商和eVTOL製造商的推出預算造成了巨大壓力。在貸款機構缺乏技術評估架構的經濟體中,資金籌措門檻更高,升級週期也更長。儘管供應商目前正在試點租賃池和基於使用量的訂閱模式,將投資從資本支出(CapEx)轉移到營運支出(OpEx),但在Tier 1中心以外的地區,硬體升級仍然進展緩慢。
細分市場分析
到2025年,精密掃描儀、相位陣列探頭和高能量CT系統將佔航太無損檢測(NDT)市場規模的46.10%,凸顯了以往以硬體為中心的採購模式在檢測預算中佔據主導地位。每個平台的平均價格在30萬至50萬美元之間,這清楚地表明了該領域的高進入門檻以及長期折舊免稅額機制對現有公司收入的穩定作用。同時,軟體市場正以9.15%的複合年成長率快速成長,預示未來將轉向利用雲端儀錶板分析歷史掃描資料以提取預測特徵。到2030年,隨著SaaS使用費逐年遞增,分析服務的訂閱可能會對硬體的收入佔有率造成壓力。
軟體供應商正利用低部署成本,將軟體部署擴展到多家原始設備製造商 (OEM) 的整個機隊,並透過按掃描次數或按飛機數量收取許可費來實現盈利。這種低資產負擔模式對難以負擔頂級硬體的區域維修企業 (MRO) 極具吸引力。由於航空公司將日常維護外包,服務合約依然強勁,而耗材則提供與檢查頻率直接掛鉤的持續現金流,從而在硬體市場低迷時期彌補收入損失。高額的初始資本投資與適度但不斷累積的軟體使用費之間的相互作用,正在重塑整個航太無損檢測 (NDT) 市場的生命週期價值計算方式。
區域分析
預計到2025年,北美將維持其在航太無損檢測市場38.45%的佔有率,這主要得益於波音公司的生產設施以及從西雅圖延伸至邁阿密的密集型維修、修理和大修(MRO)走廊。美國聯邦航空管理局(FAA)的指令要求對老舊機隊進行徹底的檢查,迫使航空公司升級設備並擴展數位化記錄系統。該地區也正在率先將預測分析技術應用於維護計劃引擎,從而推動了軟體支出的逐步成長。
亞太地區正以9.1%的複合年成長率呈現最快成長勢頭,這主要得益於中國窄體飛機製造業的擴張以及印度政府的MRO(維護、維修和大修)支援措施。廣州、海得拉巴和新加坡正在崛起為檢測中心,人工智慧平台正顯著彌補傳統基礎設施的不足。然而,熟練人員短缺問題依然嚴峻,相關人員正轉向採用遠端檢驗服務,透過加密通訊線路將現場技術人員與海外三級專家連接起來。
在歐洲,由於空中巴士在圖盧茲和漢堡的組裝以及服務民用和國防項目的成熟供應鏈,航空業的成長仍保持在個位數中段水準。歐盟航空安全局 (EASA) 實施了嚴格的資料保存要求,加速了軟體即服務 (SaaS) 的普及,以實現合規報告的自動化。中東航空公司正利用石油美元資金在杜拜和杜哈建設機庫綜合體,競相爭奪長途航線的轉運點,但檢查人員短缺和設備成本高昂限制了短期內的擴張。南美和非洲仍處於發展階段,儘管與政府主導的安全措施相關的設備升級正在進行中。
其他好處:
- Excel格式的市場預測(ME)表
- 3個月的分析師支持
目錄
第1章:引言
- 研究假設和市場定義
- 調查範圍
第2章:調查方法
第3章執行摘要
第4章 市場狀況
- 市場概覽
- 市場促進因素
- 客機產量增加
- 對維護、修理和大修 (MRO) 的需求正在成長。
- 複合材料飛機的廣泛應用
- 加強有關安全和品質保證的法規
- 將預測分析整合到無損檢測 (NDT) 工作流程中
- 城市空中交通工具原型擴展
- 市場限制因素
- 先進無損檢測 (NDT) 設備的高昂資本投資成本
- 三級認證檢驗員短缺
- 雲端連線的無損檢測 (NDT) 工具的資料安全問題
- 目前針對積層製造的新型零件,測試標準有限。
- 產業價值鏈分析
- 宏觀經濟因素的影響
- 監理情勢
- 技術展望
- 波特五力分析
第5章 市場規模與成長預測
- 按組件
- 裝置
- 軟體
- 服務
- 消耗品
- 透過測試方法
- 超音波檢查
- 放射檢查
- 磁粉檢測
- 液體滲透探傷
- 目視檢查
- 電渦流檢測
- 聲發射測試
- 熱成像/紅外線檢測
- 電腦斷層掃描(CT)
- 透過方法
- 傳統型/傳統方法
- 基於人工智慧
- 按地區
- 北美洲
- 美國
- 加拿大
- 墨西哥
- 南美洲
- 巴西
- 阿根廷
- 其他南美國家
- 歐洲
- 德國
- 英國
- 法國
- 義大利
- 西班牙
- 其他歐洲國家
- 亞太地區
- 中國
- 日本
- 印度
- 韓國
- 東南亞
- 其他亞太國家
- 中東
- 沙烏地阿拉伯
- 阿拉伯聯合大公國
- 土耳其
- 其他中東國家
- 非洲
- 南非
- 奈及利亞
- 其他非洲國家
- 北美洲
第6章 競爭情勢
- 市場集中度
- 策略趨勢
- 市佔率分析
- 公司簡介
- Baker Hughes Company
- Mistras Group Inc.
- SGS SA
- Intertek Group plc
- Applus Services SA
- General Electric Company(GE Aviation NDT Solutions)
- Olympus Corporation
- Nikon Corporation
- Eddyfi Technologies Inc.
- Teledyne Technologies Incorporated
- Zetec Inc.
- Sonatest Ltd.
- TWI Ltd.
- Ashtead Technology Ltd.
- Vermont Ultrasonics Inc.
- YXLON International GmbH
- Hologic Inc.(SureScan)
- Waygate Technologies GmbH
- Magnaflux Corporation
- Fischer Technology Inc.
- Element Materials Technology Group Ltd.
- Collins Aerospace(UTAS NDT Lab)
- Lufthansa Technik AG(NDT Services)
- Airbus SAS(AIRTAC NDT)
- Spirit AeroSystems Holdings Inc.(NDT Centers)
- Bombardier Inc.(In-house NDT)
第7章 市場機會與未來展望
According to Mordor Intelligence, aerospace NDT market size in 2026 is estimated at USD 1.3 billion, growing from 2025 value of USD 1.20 billion with 2031 projections showing USD 1.91 billion, growing at 8.05% CAGR over 2026-2031.
This report is Segmented by Component (Equipment, Software, and More), Testing Method (Ultrasonic Testing, Radiographic Testing, Magnetic Particle Testing, and More), Technique (Traditional/Conventional and AI-Enabled), and Geography (North America, South America, Europe, Asia Pacific, Middle East, and Africa). The Market Forecasts are Provided in Terms of Value (USD).
Global Aerospace NDT Market Trends and Insights
Increasing Passenger Aircraft Production
Boeing and Airbus together shipped more than 1,200 airframes in 2024, doubling post-pandemic lows and forcing production lines to embed high-throughput inspection systems that verify engine pylons, wing spars, and fuselage panels without slowing takt times. Automated phased-array robots now populate final-assembly stations, capturing repeatable scans that feed centralized defect libraries. Documentation burdens under AS9100 require manufacturers to associate every ultrasonic reading with specific part serial numbers, thereby driving incremental software demand for digital traceability. Equipment vendors offering inline robotics paired with analytics dashboards have seen order pipelines tighten, while legacy manual workflows struggle to scale at current build rates.
Growing Maintenance, Repair and Overhaul (MRO) Demand
Commercial fleets averaged 12.8 years of service in 2025, a life cycle that magnifies structural fatigue risk and inflates heavy-check workloads. Airlines prolong the lives of their assets to counterbalance the capital-intensive replacement cycles of narrow-body aircraft, thereby enlarging the installed base of aging airframes that require periodic eddy-current and radiographic evaluations. Asia-Pacific facilities, from Guangzhou to Hyderabad, are tripling their hangar capacity, creating a neighborhood demand for equipment rentals, inspector training, and supply chains for consumables. Predictive analytics platforms now fuse flight-load data with non-destructive test histories, enabling engineering teams to defer or accelerate checks based on real-world stress cycles. Providers that bundle sensors, analytics, and field-service training secure multi-year framework contracts amid this MRO up-cycle.
High Capital Cost of Advanced NDT Equipment
Turnkey phased-array and CT installations frequently exceed USD 500,000, straining the budgets of regional MROs and launch-phase eVTOL manufacturers. Financing hurdles intensify in economies where lenders lack technical valuation frameworks, postponing upgrade cycles. Vendors are now piloting rental pools and usage-based subscription models that shift investments from CapEx to OpEx; however, hardware refresh rates remain slower outside tier-one hubs.
Other drivers and restraints analyzed in the detailed report include:
- Rising Adoption of Composite Airframes
- Stricter Safety-Quality Assurance Regulations
- Shortage of Level III Certified Inspectors
For complete list of drivers and restraints, kindly check the Table Of Contents.
Segment Analysis
In 2025, precision scanners, phased-array probes, and high-energy CT machines accounted for 46.10% of the Aerospace NDT market size, underscoring the hardware-centric purchasing approach that has historically defined inspection budgets. Average ticket prices of USD 300,000-500,000 per platform underscore high barriers to entry and long depreciation schedules that stabilize incumbent revenues. Software, however, is scaling faster; its 9.15% CAGR signals a pivot toward cloud dashboards that mine historical scans for predictive signatures. By 2030, analytics subscriptions could dilute hardware's revenue share as SaaS fees compound annually.
Software vendors leverage low entry costs to seed installations across mixed OEM fleets, monetizing via per-scan or per-aircraft licenses. This asset-light model appeals to regional MROs that are locked out of top-tier hardware purchases. Service contracts hold steady as airlines outsource periodic inspections, while consumables supply recurring cash flow linked directly to test frequency, cushioning revenue during hardware down-cycles. The interplay of high upfront equipment outlays and modest but compounding software fees is reshaping lifetime-value calculations across the Aerospace NDT market.
Complete Report Scope:
- By Component
- Equipment
- Software
- Services
- Consumables
- By Testing Method
- Ultrasonic Testing
- Radiographic Testing
- Magnetic Particle Testing
- Liquid Penetrant Testing
- Visual Inspection Testing
- Eddy-Current Testing
- Acoustic Emission Testing
- Thermography / Infrared Testing
- Computed Tomography Testing
- By Technique
- Traditional / Conventional
- AI-enabled
- By Geography
- North America
- United States
- Canada
- Mexico
- South America
- Brazil
- Argentina
- Rest of South America
- Europe
- Germany
- United Kingdom
- France
- Italy
- Spain
- Rest of Europe
- Asia Pacific
- China
- Japan
- India
- South Korea
- South-East Asia
- Rest of Asia Pacific
- Middle East
- Saudi Arabia
- United Arab Emirates
- Turkey
- Rest of Middle East
- Africa
- South Africa
- Nigeria
- Rest of Africa
- North America
Geography Analysis
North America retained 38.45% of the Aerospace NDT market share in 2025, buoyed by Boeing's production hubs and dense MRO corridors stretching from Seattle to Miami. Federal Aviation Administration directives prescribe exhaustive inspection routines for aging fleets, prompting airlines to refresh equipment arsenals and expand digital record systems. The region also pioneers predictive analytics integrations that feed maintenance-scheduling engines, driving incremental software spend.
Asia-Pacific posts the fastest trajectory at 9.1% CAGR, energized by China's narrow-body manufacturing ramp and India's government-backed MRO incentives. Guangzhou, Hyderabad, and Singapore have emerged as inspection hubs where AI-enabled platforms leapfrog legacy infrastructure gaps. Talent shortages remain acute, however, nudging stakeholders to adopt remote-verification services that connect on-site technicians with off-shore Level III experts via encrypted links.
Europe sustains mid-single-digit growth, anchored by Airbus assembly lines in Toulouse and Hamburg, alongside mature supply chains that serve both civil and defense programs. The European Union Aviation Safety Agency enforces stringent data-retention mandates, accelerating SaaS adoption that automates compliance reporting. Middle Eastern carriers channel petro-dollar capital into hangar complexes in Dubai and Doha, vying to capture long-haul layover maintenance; yet, inspector shortages and high equipment costs cap immediate expansion. South America and Africa remain nascent, with sporadic upgrades tied to government-funded safety drives.
- Baker Hughes Company
- Mistras Group Inc.
- SGS SA
- Intertek Group plc
- Applus Services SA
- General Electric Company (GE Aviation NDT Solutions)
- Olympus Corporation
- Nikon Corporation
- Eddyfi Technologies Inc.
- Teledyne Technologies Incorporated
- Zetec Inc.
- Sonatest Ltd.
- TWI Ltd.
- Ashtead Technology Ltd.
- Vermont Ultrasonics Inc.
- YXLON International GmbH
- Hologic Inc. (SureScan)
- Waygate Technologies GmbH
- Magnaflux Corporation
- Fischer Technology Inc.
- Element Materials Technology Group Ltd.
- Collins Aerospace (UTAS NDT Lab)
- Lufthansa Technik AG (NDT Services)
- Airbus S.A.S (AIRTAC NDT)
- Spirit AeroSystems Holdings Inc. (NDT Centers)
- Bombardier Inc. (In-house NDT)
Additional Benefits:
- The market estimate (ME) sheet in Excel format
- 3 months of analyst support
TABLE OF CONTENTS
1 INTRODUCTION
- 1.1 Study Assumptions and Market Definition
- 1.2 Scope of the Study
2 RESEARCH METHODOLOGY
3 EXECUTIVE SUMMARY
4 MARKET LANDSCAPE
- 4.1 Market Overview
- 4.2 Market Drivers
- 4.2.1 Increasing passenger aircraft production
- 4.2.2 Growing maintenance, repair and overhaul (MRO) demand
- 4.2.3 Rising adoption of composite airframes
- 4.2.4 Stricter safety - quality assurance regulations
- 4.2.5 Integration of predictive analytics in NDT workflows
- 4.2.6 Expansion of urban air mobility prototypes
- 4.3 Market Restraints
- 4.3.1 High capital cost of advanced NDT equipment
- 4.3.2 Shortage of level-III certified inspectors
- 4.3.3 Data-security concerns in cloud-connected NDT tools
- 4.3.4 Limited test standards for novel additive-manufactured parts
- 4.4 Industry Value Chain Analysis
- 4.5 Impact of Macroeconomic Factors
- 4.6 Regulatory Landscape
- 4.7 Technological Outlook
- 4.8 Porter's Five Forces Analysis
- 4.8.1 Threat of New Entrants
- 4.8.2 Bargaining Power of Suppliers
- 4.8.3 Bargaining Power of Buyers
- 4.8.4 Threat of Substitutes
- 4.8.5 Competitive Rivalry
5 MARKET SIZE AND GROWTH FORECASTS (VALUE)
- 5.1 By Component
- 5.1.1 Equipment
- 5.1.2 Software
- 5.1.3 Services
- 5.1.4 Consumables
- 5.2 By Testing Method
- 5.2.1 Ultrasonic Testing
- 5.2.2 Radiographic Testing
- 5.2.3 Magnetic Particle Testing
- 5.2.4 Liquid Penetrant Testing
- 5.2.5 Visual Inspection Testing
- 5.2.6 Eddy-Current Testing
- 5.2.7 Acoustic Emission Testing
- 5.2.8 Thermography / Infrared Testing
- 5.2.9 Computed Tomography Testing
- 5.3 By Technique
- 5.3.1 Traditional / Conventional
- 5.3.2 AI-enabled
- 5.4 By Geography
- 5.4.1 North America
- 5.4.1.1 United States
- 5.4.1.2 Canada
- 5.4.1.3 Mexico
- 5.4.2 South America
- 5.4.2.1 Brazil
- 5.4.2.2 Argentina
- 5.4.2.3 Rest of South America
- 5.4.3 Europe
- 5.4.3.1 Germany
- 5.4.3.2 United Kingdom
- 5.4.3.3 France
- 5.4.3.4 Italy
- 5.4.3.5 Spain
- 5.4.3.6 Rest of Europe
- 5.4.4 Asia Pacific
- 5.4.4.1 China
- 5.4.4.2 Japan
- 5.4.4.3 India
- 5.4.4.4 South Korea
- 5.4.4.5 South-East Asia
- 5.4.4.6 Rest of Asia Pacific
- 5.4.5 Middle East
- 5.4.5.1 Saudi Arabia
- 5.4.5.2 United Arab Emirates
- 5.4.5.3 Turkey
- 5.4.5.4 Rest of Middle East
- 5.4.6 Africa
- 5.4.6.1 South Africa
- 5.4.6.2 Nigeria
- 5.4.6.3 Rest of Africa
- 5.4.1 North America
6 COMPETITIVE LANDSCAPE
- 6.1 Market Concentration
- 6.2 Strategic Moves
- 6.3 Market Share Analysis
- 6.4 Company Profiles (includes Global level Overview, Market level overview, Core Segments, Financials as available, Strategic Information, Market Rank/Share for key companies, Products and Services, and Recent Developments)
- 6.4.1 Baker Hughes Company
- 6.4.2 Mistras Group Inc.
- 6.4.3 SGS SA
- 6.4.4 Intertek Group plc
- 6.4.5 Applus Services SA
- 6.4.6 General Electric Company (GE Aviation NDT Solutions)
- 6.4.7 Olympus Corporation
- 6.4.8 Nikon Corporation
- 6.4.9 Eddyfi Technologies Inc.
- 6.4.10 Teledyne Technologies Incorporated
- 6.4.11 Zetec Inc.
- 6.4.12 Sonatest Ltd.
- 6.4.13 TWI Ltd.
- 6.4.14 Ashtead Technology Ltd.
- 6.4.15 Vermont Ultrasonics Inc.
- 6.4.16 YXLON International GmbH
- 6.4.17 Hologic Inc. (SureScan)
- 6.4.18 Waygate Technologies GmbH
- 6.4.19 Magnaflux Corporation
- 6.4.20 Fischer Technology Inc.
- 6.4.21 Element Materials Technology Group Ltd.
- 6.4.22 Collins Aerospace (UTAS NDT Lab)
- 6.4.23 Lufthansa Technik AG (NDT Services)
- 6.4.24 Airbus S.A.S (AIRTAC NDT)
- 6.4.25 Spirit AeroSystems Holdings Inc. (NDT Centers)
- 6.4.26 Bombardier Inc. (In-house NDT)
7 MARKET OPPORTUNITIES AND FUTURE OUTLOOK
- 7.1 White-space and Unmet-Need Assessment

 歐洲無損檢測:市場佔有率分析、產業趨勢與統計及成長預測(2026-2031 年)石油和天然氣行業的無損檢測 (NDT):市場佔有率分析、行業趨勢和統計數據以及成長預測 (2026-2031)歐洲無損檢測設備:市場佔有率分析、產業趨勢與統計及成長預測(2026-2031 年)
 無損檢測 (NDT) 設備市場:按檢測方法、設備類型、技術、產業、國家和地區分類-全球產業分析、市場規模、市場佔有率及 2026 年至 2033 年預測
 2026年全球非破壞性檢驗設備市場報告英國無損檢測 (NDT):市場佔有率分析、產業趨勢與統計、成長預測(2025-2030 年)
 非破壞性檢測設備系統市場機會、成長要素、產業趨勢分析及2026-2035年預測
 非破壞性檢驗與檢驗市場:依技術、方法、服務、自動化程度、材料類型及產業分類-2026-2032年全球市場預測
 X光非破壞性檢測設備市場規模、佔有率和趨勢分析報告:按光源類型、設備類型、技術、檢測器類型、應用、最終用戶、地區和細分市場預測(2026-2033年)
 2026年無損檢測(NDT)產業十大成長機會