


 |
市場調查報告書
商品編碼
2124515
資料貨幣化:市場佔有率分析、產業趨勢與統計、成長預測(2026-2031)Data Monetization - Market Share Analysis, Industry Trends & Statistics, Growth Forecasts (2026 - 2031) |
||||||

※ 本網頁內容可能與最新版本有所差異。詳細情況請與我們聯繫。
預計到 2026 年,數據貨幣化市場將達到 56.7 億美元,到 2031 年將達到 126.6 億美元,複合年成長率為 17.41%。
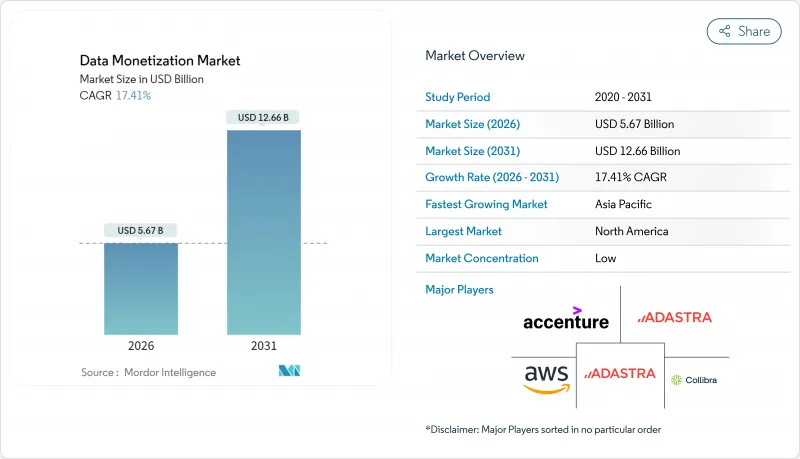
本報告按組件(工具/平台、服務)、部署模式(本地部署、雲端部署)、組織規模(大型企業、中小企業)、最終用戶行業(銀行、金融服務和保險 (BFSI)、電信和 IT、製造業、醫療保健和生命科學、零售和電子商務等)以及地區進行細分。市場預測以價值(美元)表示。
全球數據貨幣化市場趨勢及洞察
先進分析和視覺化技術的迅速普及。
自助式商業智慧平台顯著縮短了從原始資料收集到可獲利洞察的時間,使產品經理和銷售團隊能夠將分析功能打包成獨立服務,而無需依賴集中式 IT 部門。 SAP Analytics Cloud 和 Microsoft Power BI 現在支援嵌入式分析,讓軟體供應商能夠在自己的應用程式中白牌板,並將遙測資料轉化為永續的收入來源。 MicroStrategy 的 HyperIntelligence 透過在企業工作流程之上疊加上下文指標,減少了在營運系統和分析主機之間切換所帶來的摩擦。
企業資料量和多樣性的不斷成長
物聯網感測器、邊緣運算陣列和API生態系統的部署正在產生Petabyte級資料集,遠遠超出企業內部分析團隊的處理能力,迫使企業透過市場或直接授權的方式向外部提供過剩資料。製造工廠現在正在組裝上部署視覺系統和振動感測器,以產生即時品質指標。設備供應商正透過向其他公司的工廠提供預測性維護訂閱服務來實現盈利。電信業者正在收集基地間切換的匿名行動模式,並將匯總的資料流出售給城市規劃者和零售店位置負責人。
傳統架構中的互通性障礙
企業通常經營平均 14 個不同的資料儲存庫,包括關聯資料庫、資料湖、SaaS 應用孤島和本地資料倉儲,每個儲存庫都有自己的模式和存取協議,這阻礙了整合。將這些資料來源整合到統一的貨幣化層需要 ETL 管道、API 閘道器和語義協調。對於財富 500 強企業而言,此類投資可能超過 500 萬美元,並且需要長達 18 個月才能投入營運。一個策略風險是,當整合完成時,資料集可能已經失去市場相關性或監管批准可能已經過期。
細分市場分析
儘管工具在2025年佔總收入的64.58%,但預計從2026年到2031年,服務收入將超過工具收入,年成長率達19.02%。這一轉變表明,企業正在購買專業知識,以將原始資料集轉化為可銷售的產品。專業的整合商設計管治架構並協商市場准入,從而縮短產品推出時間。在工具套件中,能夠整合異質模式的資料整合平台佔據主導地位,但隨著無程式碼介面降低了准入門檻,分析前端的採用也在加速成長。
對於沒有內部資料工程師的中型企業而言,託管服務極具吸引力,因為它使它們無需資本投入即可提供基於訂閱的資料產品。隨著保密運算的普及,人們對資料儲存的擔憂有所減少,預計服務在資料貨幣化市場規模中的貢獻將持續擴大。與雲端供應商和全球系統整合商的合作正在進一步拓展服務目錄。微軟預測,到 2025 年,Azure Synapse 40% 的營收將來自託管服務管道。
到2025年,本地部署解決方案仍將佔據59.76%的市場佔有率,主要集中在金融和醫療保健產業。目前,機密運算區域正在對使用中的資料進行加密,滿足審計要求並支援向雲端遷移。預計雲端採用率將以19.66%的複合年成長率成長,從而縮小現有差距。混合架構將本地資料倉儲和雲湖整合在一起,形成單一的邏輯層,使供應商能夠在不移動資料的情況下公開表。
歐盟資料法要求服務提供者支援資料可攜性,以緩解供應商鎖定問題並促進跨境交易。雖然使用 BigQuery Omni 和 Snowflake 進行跨雲端複製可以免除同一區域內的資料傳輸費用,但複製成本仍然是需要考慮的因素。市場對能夠抽象化位置資訊並同時保持管治的供應商(例如資料網格平台)的需求日益成長。整體而言,部署配置正朝著支援大規模商業化的靈活架構轉變。
區域分析
預計到2025年,北美將佔全球收入的45.26%,反映出該地區擁有成熟的分析技術堆疊、密集的買家生態系統以及企業數據市場的早期部署。各州層級的隱私法,例如《加州消費者隱私法案》(CCPA),雖然帶來了合規的複雜性,但也推動了對資料管治工具的投資,這些工具能夠簡化資料共用,最終提升資料變現能力。該地區的超大規模資料中心業者提供捆綁式市場基礎設施,為已在同一平台上儲存資料的賣家創造了有利的網路效應。城市規劃者、避險基金和廣告公司等機構的共同作用,支撐了強勁的需求,並提供了比其他地區更高的流動性。
亞太地區是成長最快的地區,預計到2031年將以18.24%的複合年成長率成長。這主要得益於印度的《數位個人資料保護法》和中國的《個人資料保護法》,這兩部法律都明確了商業資料使用的同意協議。監管的確定性降低了法律風險,並鼓勵跨國公司在新加坡和東京建立資料交換中心。來自日本和韓國智慧工廠的製造遙測數據正成為新的數據來源,而東南亞的電子商務和金融科技公司則推動了數據需求。該地區各國政府正在資助資料中心容量的擴建,這有助於降低延遲並維持國內資料儲存。
在歐洲,由於GDPR的持續嚴格執行,預計成長將更加穩定。但歐盟資料法要求連網設備製造商提供用戶級資料存取權限,拓展了B2B交易的可能性。工業IoT資料集,特別是來自汽車和機械的遙測數據,有望受益於強制性的互通性。然而,本地化法規可能會減緩跨境交易,迫使供應商採用聯邦學習技術,以便在資料原地處理。拉丁美洲、中東和非洲是新興市場,數位基礎設施正在發展,但買方生態系統仍在建構中。一旦法律體制穩定下來,智慧城市計畫和行動支付系統將成為未來的商機。整體而言,地域分散化有助於緩解單一經濟體的經濟波動。
其他好處:
- Excel格式的市場預測(ME)表
- 3個月的分析師支持
目錄
第1章:引言
- 研究假設和市場定義
- 調查範圍
第2章:調查方法
- 研究框架
- 第二次調查
- 初步調查
- 數據三角測量與洞察生成
第3章執行摘要
第4章 市場狀況
- 市場概覽
- 市場促進因素
- 先進分析和視覺化技術的快速普及。
- 企業資料量和種類增加
- 促進開放資料生態系統的監管義務
- 企業採用支援B2B數據交易的數據市場。
- 利用人工智慧生成技術創建注重隱私的合成資料。
- 利用區塊鏈技術將數據資產代幣化,創造新的收入來源
- 市場限制因素
- 傳統架構中的互通性障礙
- 數據品質不一致正在阻礙獲利潛力。
- 資料隱私法規碎片化且瞬息萬變。
- 不斷飆升的雲端出口成本正在削弱數據共用的投資報酬率。
- 產業價值鏈分析
- 監理情勢
- 技術展望
- 波特五力分析
- 宏觀經濟因素對市場的影響
第5章 市場規模與成長預測
- 按組件
- 工具/平台
- 資料整合和管理工具
- 分析和視覺化工具
- 服務
- 專業服務
- 託管服務
- 工具/平台
- 部署模式
- 現場
- 雲
- 混合
- 按組織規模
- 小型企業
- 大公司
- 按最終用戶行業分類
- 銀行、金融服務和保險(BFSI)
- 通訊/IT
- 製造業
- 醫療保健和生命科學
- 零售與電子商務
- 運輸/物流
- 能源公用事業
- 政府/公共部門
- 其他終端用戶產業
- 按地區
- 北美洲
- 美國
- 加拿大
- 墨西哥
- 南美洲
- 巴西
- 阿根廷
- 其他南美國家
- 歐洲
- 德國
- 英國
- 法國
- 義大利
- 西班牙
- 俄羅斯
- 其他歐洲國家
- 亞太地區
- 中國
- 日本
- 印度
- 韓國
- 澳洲和紐西蘭
- 東南亞
- 其他亞太國家
- 中東
- 沙烏地阿拉伯
- 阿拉伯聯合大公國
- 土耳其
- 其他中東國家
- 非洲
- 南非
- 奈及利亞
- 其他非洲國家
- 北美洲
第6章 競爭情勢
- 市場集中度
- 策略趨勢
- 市佔率分析
- 公司簡介
- Accenture plc
- Adastra Corporation
- Amazon Web Services Inc.
- Cisco Systems Inc.
- Collibra NV
- Dawex Systems SAS
- Emu Analytics Ltd.
- Equifax Inc.
- Experian plc
- Google LLC(Alphabet Inc.)
- IBM Corporation
- Infosys Limited
- Microsoft Corporation
- Oracle Corporation
- Reltio Inc.
- SAP SE
- SAS Institute Inc.
- Snowflake Inc.
第7章 市場機會與未來展望
According to Mordor Intelligence, the data monetization market size is USD 5.67 billion in 2026 and is projected to reach USD 12.66 billion in 2031, advancing at a 17.41% CAGR.
This report is Segmented by Component (Tools/Platforms, and Services), Deployment (On-Premises, and Cloud), Organization Size (Large Enterprises, and Small and Medium Enterprises), End User Industry (Banking, Financial Services, and Insurance (BFSI), Telecom and IT, Manufacturing, Healthcare and Life Sciences, Retail and E-Commerce, and More) and Geography. The Market Forecasts are Provided in Terms of Value (USD).
Global Data Monetization Market Trends and Insights
Rapid Adoption of Advanced Analytics and Visualization
Self-service business-intelligence platforms are collapsing the time from raw data ingestion to monetizable insight, enabling product managers and sales teams to package analytics as standalone offerings without relying on centralized IT. SAP Analytics Cloud and Microsoft Power BI now support embedded analytics that let software vendors white-label dashboards inside their applications, converting telemetry into recurring revenue streams. MicroStrategy's HyperIntelligence overlays contextual metrics on top of enterprise workflows, reducing the friction of switching between operational systems and analytics consoles.
Increasing Volume and Variety of Enterprise Data
IoT sensor deployments, edge-computing arrays, and application-programming-interface ecosystems are generating petabyte-scale datasets that exceed the absorptive capacity of internal analytics teams, pushing enterprises to externalize surplus data through marketplaces or direct licensing. Manufacturing plants now instrument assembly lines with vision systems and vibration sensors that produce real-time quality metrics, which equipment vendors monetize by offering predictive-maintenance subscriptions to peer factories. Telecom operators capture anonymized mobility patterns from cell-tower handoffs, selling aggregated flows to urban planners and retail-site selectors.
Interoperability Hurdles with Legacy Architectures
Enterprises operate a median of 14 distinct data repositories, including relational databases, data lakes, SaaS application silos, and on-premises warehouses, each with proprietary schemas and access protocols that resist federation. Integrating these sources into a unified monetization layer requires extract-transform-load pipelines, API gateways, and semantic harmonization, investments that can exceed USD 5 million for a Fortune 500 firm and take 18 months to operationalize. The strategic risk is that by the time integration completes, the datasets may have lost market relevance or regulatory permissions may have expired.
Other drivers and restraints analyzed in the detailed report include:
- Regulatory Mandates Driving Open-Data Ecosystems
- Enterprise Adoption of Data Marketplaces Enabling B2B Data Trading
- Data Quality Inconsistencies Hindering Monetization Potential
For complete list of drivers and restraints, kindly check the Table Of Contents.
Segment Analysis
Services are forecast to outpace tools, climbing at 19.02% from 2026 to 2031 even though tools commanded 64.58% of 2025 revenue. This variation shows that enterprises buy expertise to translate raw datasets into saleable products. Professional integrators design governance frameworks and negotiate marketplace onboarding, which compresses launch timelines. Within the tooling stack, data-integration platforms dominate because they harmonize disparate schemas, yet analytics front-ends are accelerating as no-code interfaces lower adoption barriers.
Managed services appeal to mid-sized firms that lack in-house data engineers, allowing them to offer subscription-based data products without capital expenditure. The data monetization market size contribution from services is set to rise as confidential computing reduces residency concerns. Partnerships between cloud providers and global systems integrators further expand service catalogs. Microsoft reported that 40% of Azure Synapse revenue flowed through managed-service channels in 2025.
On-premises still held 59.76% share in 2025, largely within finance and healthcare. Confidential-computing enclaves now encrypt data in use, which satisfies auditors and unlocks cloud migration. Cloud installations are projected to advance at 19.66% CAGR, narrowing the historical gap. Hybrid fabrics combine on-premises warehouses with cloud lakes, creating a single logical layer from which sellers expose tables without relocation.
The EU Data Act obliges providers to support data portability, which eases fears of lock-in and boosts cross-border trading. BigQuery Omni and Snowflake cross-cloud replication neutralize egress fees inside the same region, yet replication costs remain a consideration. Vendors that abstract location while preserving governance, such as data-mesh platforms, enjoy rising demand. Overall, the deployment mix is shifting toward flexible fabrics that support monetization at scale.
Complete Report Scope:
- By Component
- Tools / Platforms
- Data Integration and Management Tools
- Analytics and Visualization Tools
- Services
- Professional Services
- Managed Services
- Tools / Platforms
- By Deployment Mode
- On-Premises
- Cloud
- Hybrid
- By Organization Size
- Small and Medium-Sized Enterprises
- Large Enterprises
- By End-User Industry
- Banking, Financial Services, and Insurance (BFSI)
- Telecom and IT
- Manufacturing
- Healthcare and Life Sciences
- Retail and E-Commerce
- Transportation and Logistics
- Energy and Utilities
- Government and Public Sector
- Other End-User Industries
- By Geography
- North America
- United States
- Canada
- Mexico
- South America
- Brazil
- Argentina
- Rest of South America
- Europe
- Germany
- United Kingdom
- France
- Italy
- Spain
- Russia
- Rest of Europe
- Asia Pacific
- China
- Japan
- India
- South Korea
- Australia and New Zealand
- Southeast Asia
- Rest of Asia Pacific
- Middle East
- Saudi Arabia
- United Arab Emirates
- Turkey
- Rest of Middle East
- Africa
- South Africa
- Nigeria
- Rest of Africa
- North America
Geography Analysis
North America delivered 45.26% of 2025 revenue, reflecting mature analytics stacks, dense buyer ecosystems, and the early rollout of enterprise data marketplaces. State-level privacy statutes such as the California Consumer Privacy Act introduce compliance complexity, yet they also encourage investment in governance tools that streamline sharing and thus stimulate monetization. The region's hyperscalers provide bundled marketplace rails, driving favorable network effects for sellers that already store data on the same platforms. Urban planners, hedge funds, and advertising agencies collectively underpin robust demand, making liquidity high relative to other regions.
Asia Pacific is the fastest-growing territory with an 18.24% CAGR through 2031, supported by India's Digital Personal Data Protection Act and China's Personal Information Protection Law, both of which clarify consent protocols for commercial data use. Regulatory certainty has lowered legal risk and encouraged multinationals to base data-exchange hubs in Singapore and Tokyo. Manufacturing telemetry from smart factories in Japan and South Korea comprises a fresh supply pool, while Southeast Asian e-commerce and fintech players create rising demand. Governments across the region are funding data-center capacity, which reduces latency and keeps residency in-country.
Europe exhibits steadier growth because GDPR remains stringent, yet the EU Data Act now obliges connected-device manufacturers to provide user-level data access, expanding B2B trading potential. Industrial IoT datasets, especially automotive and machinery telemetry, stand to benefit from mandated interoperability. However, localization rules can delay cross-border deals, urging vendors to adopt federated learning that leaves data in place. Latin America, the Middle East, and Africa represent nascent markets where digital infrastructure is improving but buyer ecosystems are still forming. Smart-city projects and mobile-money systems present future opportunities once legal frameworks stabilize. Collectively, geographic diversification helps to smooth cyclical variances in individual economies.
- Accenture plc
- Adastra Corporation
- Amazon Web Services Inc.
- Cisco Systems Inc.
- Collibra NV
- Dawex Systems SAS
- Emu Analytics Ltd.
- Equifax Inc.
- Experian plc
- Google LLC (Alphabet Inc.)
- IBM Corporation
- Infosys Limited
- Microsoft Corporation
- Oracle Corporation
- Reltio Inc.
- SAP SE
- SAS Institute Inc.
- Snowflake Inc.
Additional Benefits:
- The market estimate (ME) sheet in Excel format
- 3 months of analyst support
TABLE OF CONTENTS
1 INTRODUCTION
- 1.1 Study Assumptions and Market Definition
- 1.2 Scope of the Study
2 RESEARCH METHODOLOGY
- 2.1 Research Framework
- 2.2 Secondary Research
- 2.3 Primary Research
- 2.4 Data Triangulation and Insight Generation
3 EXECUTIVE SUMMARY
4 MARKET LANDSCAPE
- 4.1 Market Overview
- 4.2 Market Drivers
- 4.2.1 Rapid Adoption of Advanced Analytics and Visualization
- 4.2.2 Increasing Volume and Variety of Enterprise Data
- 4.2.3 Regulatory Mandates Driving Open-Data Ecosystems
- 4.2.4 Enterprise Adoption of Data Marketplaces Enabling B2B Data Trading
- 4.2.5 Generative AI-Enabled Creation of Privacy-Safe Synthetic Data
- 4.2.6 Tokenization of Data Assets Via Blockchain for New Revenue Streams
- 4.3 Market Restraints
- 4.3.1 Interoperability Hurdles with Legacy Architectures
- 4.3.2 Data Quality Inconsistencies Hindering Monetization Potential
- 4.3.3 Fragmented and Evolving Data-Privacy Regulations
- 4.3.4 Escalating Cloud-Egress Fees Undermining Data-Sharing ROI
- 4.4 Industry Value Chain Analysis
- 4.5 Regulatory Landscape
- 4.6 Technological Outlook
- 4.7 Porter's Five Forces Analysis
- 4.7.1 Bargaining Power of Suppliers
- 4.7.2 Bargaining Power of Buyers
- 4.7.3 Threat of New Entrants
- 4.7.4 Threat of Substitutes
- 4.7.5 Intensity of Competitive Rivalry
- 4.8 Impact of Macroeconomic Factors on the Market
5 MARKET SIZE AND GROWTH FORECASTS (VALUE)
- 5.1 By Component
- 5.1.1 Tools / Platforms
- 5.1.1.1 Data Integration and Management Tools
- 5.1.1.2 Analytics and Visualization Tools
- 5.1.2 Services
- 5.1.2.1 Professional Services
- 5.1.2.2 Managed Services
- 5.1.1 Tools / Platforms
- 5.2 By Deployment Mode
- 5.2.1 On-Premises
- 5.2.2 Cloud
- 5.2.3 Hybrid
- 5.3 By Organization Size
- 5.3.1 Small and Medium-Sized Enterprises
- 5.3.2 Large Enterprises
- 5.4 By End-User Industry
- 5.4.1 Banking, Financial Services, and Insurance (BFSI)
- 5.4.2 Telecom and IT
- 5.4.3 Manufacturing
- 5.4.4 Healthcare and Life Sciences
- 5.4.5 Retail and E-Commerce
- 5.4.6 Transportation and Logistics
- 5.4.7 Energy and Utilities
- 5.4.8 Government and Public Sector
- 5.4.9 Other End-User Industries
- 5.5 By Geography
- 5.5.1 North America
- 5.5.1.1 United States
- 5.5.1.2 Canada
- 5.5.1.3 Mexico
- 5.5.2 South America
- 5.5.2.1 Brazil
- 5.5.2.2 Argentina
- 5.5.2.3 Rest of South America
- 5.5.3 Europe
- 5.5.3.1 Germany
- 5.5.3.2 United Kingdom
- 5.5.3.3 France
- 5.5.3.4 Italy
- 5.5.3.5 Spain
- 5.5.3.6 Russia
- 5.5.3.7 Rest of Europe
- 5.5.4 Asia Pacific
- 5.5.4.1 China
- 5.5.4.2 Japan
- 5.5.4.3 India
- 5.5.4.4 South Korea
- 5.5.4.5 Australia and New Zealand
- 5.5.4.6 Southeast Asia
- 5.5.4.7 Rest of Asia Pacific
- 5.5.5 Middle East
- 5.5.5.1 Saudi Arabia
- 5.5.5.2 United Arab Emirates
- 5.5.5.3 Turkey
- 5.5.5.4 Rest of Middle East
- 5.5.6 Africa
- 5.5.6.1 South Africa
- 5.5.6.2 Nigeria
- 5.5.6.3 Rest of Africa
- 5.5.1 North America
6 COMPETITIVE LANDSCAPE
- 6.1 Market Concentration
- 6.2 Strategic Moves
- 6.3 Market Share Analysis
- 6.4 Company Profiles (includes Global Level Overview, Market Level Overview, Core Segments, Financials as Available, Strategic Information, Market Rank/Share for Key Companies, Products and Services, and Recent Developments)
- 6.4.1 Accenture plc
- 6.4.2 Adastra Corporation
- 6.4.3 Amazon Web Services Inc.
- 6.4.4 Cisco Systems Inc.
- 6.4.5 Collibra NV
- 6.4.6 Dawex Systems SAS
- 6.4.7 Emu Analytics Ltd.
- 6.4.8 Equifax Inc.
- 6.4.9 Experian plc
- 6.4.10 Google LLC (Alphabet Inc.)
- 6.4.11 IBM Corporation
- 6.4.12 Infosys Limited
- 6.4.13 Microsoft Corporation
- 6.4.14 Oracle Corporation
- 6.4.15 Reltio Inc.
- 6.4.16 SAP SE
- 6.4.17 SAS Institute Inc.
- 6.4.18 Snowflake Inc.
7 MARKET OPPORTUNITIES AND FUTURE OUTLOOK
- 7.1 White-Space and Unmet-Need Assessment

 第一方資料貨幣化服務:市場佔有率分析、產業趨勢與統計、成長預測(2026-2031 年)
 數據貨幣化市場-2026-2032年全球市場預測通訊業者資料貨幣化市場:按服務類型、定價模式、部署模式、客戶類型和產業分類-2026-2032年全球市場預測
 全球電信市場追蹤(2025 年第四季):資本支出減少將有助於提高收益,使利潤率達到近 10 年來的最高水準。通訊業人才追蹤報告(2025 年第四季):預計通訊業就業人數將繼續以每年約 2% 的速度下降——但現在就將其歸咎於人工智慧還為時過早。電信資料貨幣化:市場佔有率分析、產業趨勢與統計、成長預測(2026-2031)
 資料貨幣化市場規模、佔有率、趨勢和預測:按方法論、組織規模、最終用途和地區分類,2026-2034 年
 數據貨幣化市場:按組件、部署方式、組織規模、產業和地區分類
 數據貨幣化市場規模、佔有率和趨勢分析報告:按公司規模、方法論、行業、地區和細分市場預測(2026-2033 年)
 全球數據貨幣化市場規模、佔有率、趨勢和成長分析報告(2026-2034)