

 |
市場調查報告書
商品編碼
2124438
中東和非洲電池能源儲存系統(BESS):市場佔有率分析、行業趨勢和統計數據以及成長預測(2026-2031 年)Middle East And Africa Battery Energy Storage System (BESS) - Market Share Analysis, Industry Trends & Statistics, Growth Forecasts (2026 - 2031) |
||||||

※ 本網頁內容可能與最新版本有所差異。詳細情況請與我們聯繫。
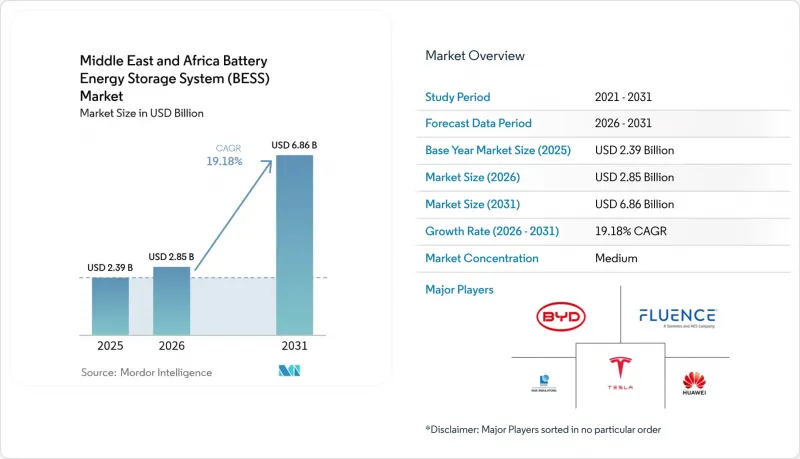
據 Mordor Intelligence 稱,中東和非洲地區的電池能源儲存系統(BESS) 市場預計到 2026 年價值 28.5 億美元,從 2025 年的 23.9 億美元成長到 2031 年的 68.6 億美元。
預計 2026 年至 2031 年的複合年成長率為 19.18%。
本報告按電池類型(鋰離子電池、液流電池等)、連接類型(併網、離網)、組件(電池組、支架、能源管理軟體等)、能源容量範圍(10-100 MWh、100-500 MWh 等)、最終用戶應用(電力公司等)和地區(沙烏地阿拉伯、阿拉伯聯合大公國、卡達等)進行分類。
中東和非洲電池能源儲存系統(BESS)市場趨勢與洞察
電力公司規模的太陽能和風能發電快速擴張
在沙烏地阿拉伯、阿拉伯聯合大公國、埃及和南非,儲能電池已成為準入的強制性要求,所有新的太陽能發電競標都包含4小時的儲能容量,所有風力發電競標都包含2小時的儲能容量。 ACWA Power和Masdar等開發商已為2027年之前計劃的項目預訂了超過12吉瓦時的磷酸鋰鐵鋰電池。埃及一個1吉瓦的太陽能發電計畫包含200兆瓦時的儲能容量,以避免蘇伊士運河經濟特區的發電限制。在南非最新的獨立發電商(IPP)競標中,1.2吉瓦的電池容量分配價格低於Escoum燃煤發電廠,這表明競爭環境是公平的。現在,電網調查將發電和儲能作為一個整體進行評估,平均專案前置作業時間縮短了近兩年,從而加快了獲利速度。
國家在電網穩定性方面的義務
沙烏地阿拉伯和阿拉伯聯合大公國的監管機構目前已將儲能視為關鍵基礎設施,並發布指令強制電網營運商採購一定數量的儲能設備,對不合規者處以罰款。沙烏地阿拉伯已強制要求到2027年實現26吉瓦時的儲能容量,而阿拉伯聯合大公國則同意實施19吉瓦時的框架協議,該協議規定無論發電量如何調整,容量費均需支付。多年期合約降低了交易成本,並為貸款方提供了可預測的現金流,從而使其利率較SOFR利率降低200-250個基點。卡達在沿岸地區啟動了首個獨立的400兆瓦時競標,顯示該地區正向以輔助服務創造收入的商業儲能模式轉變。 IEC 62933標準的嚴格合規要求設置了准入壁壘,將沒有認證硬體的小規模供應商排除在外,並將市場佔有率集中在一級整合商手中。
電力分配網路的數位化進程滯後。
奈及利亞僅有38%的配電線路和坦尚尼亞僅有12%的變電站配備了監控與數據採集(SCADA)系統,這阻礙了電池供電的頻率和電壓服務的提供。肯亞電力公司依賴人工輸出指令,導致延遲,並迫使儲能業者為了確保獲利,將系統容量超額設計高達30%。南非國家電力公司(Eskom)於2024年啟動了一項12億美元的電網現代化項目,但法律糾紛導致400萬個智慧電錶的部署被推遲。由於缺乏即時數據,電力業者無法充分評估應對快速輸出波動的能力,導致輔助服務市場發展落後。這種數位落差正在疏遠投資者,因為在發電不確定性較低的情況下,他們會降低對預期現金流的估值。
細分市場分析
鋰離子電池憑藉著快速下降的成本和成熟的供應鏈,預計將繼續保持其主導地位,到2025年將佔據中東和非洲電池能源儲存系統市場79.82%的佔有率。然而,液流電池正以28.25%的複合年成長率快速成長,直至2031年。電力公司需要8至12小時的放電持續時間,以滿足日常套利和季節性電力轉移的需求。 Eskom公司簽訂的200兆瓦時釩液流電池合約凸顯了其2萬次循環壽命的優勢,有助於降低平準化儲能成本。
成本差距正在縮小。在沙烏地阿拉伯的競標中,磷酸鐵鋰電池的價格定為89美元/千瓦時,僅比液流電池的競標價格低30%,這促使開發商重新考慮其化學成分的多樣化。鉛酸電池在通訊備用電源領域仍然佔據一定地位,但摩洛哥和埃及的鈉離子電池試點計畫表明,它們未來可能成為一種低成本的替代方案。對熱失控的擔憂持續降低鎳含量高的化學電池的市場佔有率,而混合型超級電容正在接受測試,以實現微電網亞秒的反應時間。
預計到2025年,併網系統將佔總裝置容量的73.65%,主要得益於沙烏地阿拉伯和阿拉伯聯合大公國簽訂的大規模頻率調節和容量管理合約。同時,離網系統預計將以26.1%的年複合成長率(CAGR),這主要受非洲礦業公司以太陽能和儲能結合的混合系統取代柴油發電廠的推動。這些混合系統的平準化電力成本(LCOE)低於0.10美元/kWh。
Sibanye 靜水公司部署的50兆瓦時儲能系統每年可節省1,800萬公升柴油,展現出顯著的營運效益。贊比亞的Kansansi銅礦計畫將100兆瓦太陽能發電與40兆瓦時儲能系統結合,目標是在2026年實現完全能源自給自足。肯亞農村地區的微電網和南非工商業混合系統正在增強易受頻繁停電影響地區的電力韌性。
其他好處:
- Excel格式的市場預測(ME)表
- 3個月的分析師支持
目錄
第1章:引言
- 研究假設和市場定義
- 調查範圍
第2章:調查方法
第3章執行摘要
第4章 市場狀況
- 市場概覽
- 市場促進因素
- 大規模太陽能和風能發電的快速擴張
- 各國(例如阿拉伯聯合大公國、沙烏地阿拉伯)關於系統穩定性的法規
- 磷酸鐵鋰電池價格將跌破100美元/kWh(2025年)
- 石油出口國脫碳基金
- 非洲礦場混合發電的經濟性
- 資料中心的電能品質要求
- 市場限制因素
- 配電網路數位化進程的延遲
- 一些非洲國家的政策不確定性
- 當地提煉電池原料的能力有限。
- 主權風險越高,資金籌措成本越高。
- 供應鏈分析
- 監理情勢
- 技術展望
- 波特五力模型
- 投資分析
第5章 市場規模與成長預測
- 依電池類型
- 鋰離子(磷酸鋰鐵(LFP)、鎳錳鈷鋰(NMC)、鈦酸鋰(LTO))
- 鉛酸
- 液流電池(釩液流電池、鋅溴液流電池)
- 鈉離子
- 其他電池技術(鎳鎘電池、混合型超級電容)
- 按連線類型
- 併網型(與電力公司連接)
- 離網(微電網、混合電網)
- 按組件
- 電池組支架
- 電源轉換系統(PCS)
- 能源管理軟體(EMS)
- 工廠相關設施和服務
- 能量容量範圍
- 小於10兆瓦時
- 10~100 MWh
- 100~500 MWh
- 500兆瓦時或以上
- 透過最終用戶應用程式
- 公用事業
- 商業和工業用途
- 住宅
- 按地區
- 沙烏地阿拉伯
- 阿拉伯聯合大公國
- 卡達
- 南非
- 埃及
- 肯亞
- 其他中東和非洲國家
第6章 競爭情勢
- 市場集中度
- 策略趨勢(併購、聯盟、購電協議)
- 市場佔有率分析(主要公司的市場排名和佔有率)
- 公司簡介
- Tesla Inc.
- Huawei Digital Power
- Fluence Energy Inc.
- NGK Insulators Ltd.
- BYD Co. Ltd.
- Eaton Corporation plc
- Schneider Electric SE
- Siemens Energy AG
- Sungrow Power Supply Co.
- ABB Ltd.
- Wartsila Oyj
- Saft Groupe SA
- Aggreko Ltd.
- Eskom Holdings SOC Ltd.
- Philadelphia Solar Ltd.
- VanadiumCorp Resource Inc.
- Sumitomo Corporation
- Contemporary Amperex Technology(CATL)
- AlphaESS Co. Ltd.
- Desert Technologies(SA)
第7章 市場機會與未來展望
According to Mordor Intelligence, the Middle East and Africa battery energy storage system market size in 2026 is estimated at USD 2.85 billion, growing from 2025 value of USD 2.39 billion with 2031 projections showing USD 6.86 billion, growing at 19.18% CAGR over 2026-2031.
This report is Segmented by Battery Type (Lithium-Ion, Flow Batter, and More), Connection Type (On-Grid and Off-Grid), Component (Battery Pack and Racks, Energy Management Software, and More), Energy Capacity Range (10 To 100 MWh, 100 To 500 MWh, and More), End-User Application (Utility, and More), and Geography (Saudi Arabia, United Arab Emirates, Qatar, and More).
Middle East And Africa Battery Energy Storage System (BESS) Market Trends and Insights
Rapid Utility-Scale Solar and Wind Build-Outs
Saudi Arabia, the United Arab Emirates, Egypt, and South Africa are embedding four-hour storage into every new solar tender and two-hour storage into all wind solicitations, making batteries a mandatory cost of entry. Developers such as ACWA Power and Masdar have pre-ordered more than 12 GWh of lithium-iron-phosphate cells for projects scheduled before 2027. Egypt's 1 GW solar pipeline pairs 200 MWh of storage to avoid curtailment in the Suez Canal Economic Zone. South Africa's latest IPP round allocated 1.2 GW of battery capacity at tariffs that undercut Eskom's coal fleet, demonstrating competitive parity. Because grid studies now evaluate generation and storage together, average project lead times have fallen by nearly two years, accelerating revenue realization.
National Grid-Stability Mandates
Regulators in Saudi Arabia and the UAE now treat storage as essential infrastructure, issuing directives that require the grid operator to procure fixed volumes or face financial penalties. Saudi Arabia mandated 26 GWh by 2027, while the UAE agreed to a 19 GWh framework that earns capacity payments independent of energy dispatch. Multi-year contracts reduce transaction costs and provide lenders with predictable cash flows, resulting in spreads of 200-250 basis points over the SOFR rate. Qatar has launched the Gulf's first standalone 400 MWh tender, signaling a shift toward merchant storage models that monetize ancillary services. Strict IEC 62933 compliance rules filter out smaller suppliers that lack certified hardware, raising entry barriers and consolidating market share among tier-one integrators.
Lagging Distribution-Network Digitalization
Only 38% of Nigeria's distribution feeders and 12% of Tanzanian substations have supervisory control and data acquisition links, preventing batteries from delivering frequency and voltage services. Kenya Power relies on manual dispatch instructions, creating latency that forces storage operators to oversize systems by up to 30% to capture revenue. Eskom initiated a USD 1.2 billion grid modernization project in 2024, but legal disputes have slowed the rollout of four million smart meters. Without real-time data, utilities cannot fully value fast-ramping capacity, resulting in shallow ancillary-service markets. The digital gap deters investors who discount projected cash flows when dispatch certainty is low.
Other drivers and restraints analyzed in the detailed report include:
- Falling LFP Battery Prices Below USD 100/kWh
- Oil-Exporting Nations' Decarbonization Funds
- Policy Uncertainty in Several African States
For complete list of drivers and restraints, kindly check the Table Of Contents.
Segment Analysis
Lithium-ion chemistries remained dominant with an 79.82% share of the Middle East and Africa battery energy storage system market in 2025, thanks to rapid cost decline and mature supply chains. Flow batteries, however, are racing ahead at 28.25% CAGR through 2031 as utilities seek 8- to 12-hour discharge durations for daily arbitrage and seasonal shifting. Eskom's 200 MWh vanadium redox contract highlights the appeal of 20,000-cycle lifetimes, which reduce levelized storage costs.
Cost spreads are narrowing: Saudi tenders priced LFP at USD 89/kWh, only 30% below flow bids, prompting developers to reconsider chemistry diversification. Lead-acid retains a foothold in telecom backup, while sodium-ion pilots in Morocco and Egypt signal a future low-cost alternative. Thermal-runaway concerns continue to erode nickel-rich chemistries, and hybrid supercapacitors are being trialed for sub-second response in microgrids.
On-grid installations accounted for 73.65% of 2025 deployments, primarily driven by large contracts in Saudi Arabia and the UAE, which supply frequency regulation and capacity firming. Yet, off-grid systems are forecast to expand at a 26.1% CAGR, driven by African mining firms replacing diesel with solar-plus-storage hybrids that achieve a levelized cost of less than USD 0.10/kWh.
Sibanye-Stillwater's 50 MWh roll-out saves 18 million liters of diesel annually, illustrating the operational upside. Zambia's Kansanshi copper project will pair 100 MW of solar power with 40 MWh of storage to achieve full energy autonomy by 2026. Rural microgrids in Kenya and hybrid commercial and industrial (C&I) systems in South Africa enhance resilience in areas where grid outages are prevalent.
Complete Report Scope:
- By Battery Type
- Lithium-ion (Lithium Iron Phosphate (LFP), Nickel-Manganese-Cobalt (NMC), Lithium Titanate (LTO))
- Lead-acid
- Flow Battery (Vanadium Redox, Zinc-Bromine)
- Sodium-ion
- Other Battery Technologies (NiCd, Hybrid Super-capacitors)
- By Connection Type
- On-Grid (Utility Interconnected)
- Off-Grid (Micro-Grid, Hybrid)
- By Component
- Battery Pack and Racks
- Power Conversion System (PCS)
- Energy Management Software (EMS)
- Balance-of-Plant and Services
- By Energy Capacity Range
- Below 10 MWh
- 10 to 100 MWh
- 100 to 500 MWh
- Above 500 MWh
- By End-user Application
- Utility
- Commercial and Industrial
- Residential
- By Geography
- Saudi Arabia
- United Arab Emirates
- Qatar
- South Africa
- Egypt
- Kenya
- Rest of Middle East and Africa
List of Companies Covered in this Report:
- Tesla Inc.
- Huawei Digital Power
- Fluence Energy Inc.
- NGK Insulators Ltd.
- BYD Co. Ltd.
- Eaton Corporation plc
- Schneider Electric SE
- Siemens Energy AG
- Sungrow Power Supply Co.
- ABB Ltd.
- Wartsila Oyj
- Saft Groupe SA
- Aggreko Ltd.
- Eskom Holdings SOC Ltd.
- Philadelphia Solar Ltd.
- VanadiumCorp Resource Inc.
- Sumitomo Corporation
- Contemporary Amperex Technology (CATL)
- AlphaESS Co. Ltd.
- Desert Technologies (SA)
Additional Benefits:
- The market estimate (ME) sheet in Excel format
- 3 months of analyst support
TABLE OF CONTENTS
1 Introduction
- 1.1 Study Assumptions & Market Definition
- 1.2 Scope of the Study
2 Research Methodology
3 Executive Summary
4 Market Landscape
- 4.1 Market Overview
- 4.2 Market Drivers
- 4.2.1 Rapid utility-scale solar & wind build-outs
- 4.2.2 National grid-stability mandates (e.g., UAE, KSA)
- 4.2.3 Falling LFP battery prices below USD 100/kWh (2025)
- 4.2.4 Oil-exporting nations' decarbonization funds
- 4.2.5 Mining-site hybrid-power economics in Africa
- 4.2.6 Data-center power-quality requirements
- 4.3 Market Restraints
- 4.3.1 Lagging distribution-network digitalization
- 4.3.2 Policy uncertainty in several African states
- 4.3.3 Limited local battery-grade raw-material refining
- 4.3.4 High sovereign-risk financing costs
- 4.4 Supply-Chain Analysis
- 4.5 Regulatory Landscape
- 4.6 Technological Outlook
- 4.7 Porter's Five Forces
- 4.7.1 Threat of New Entrants
- 4.7.2 Bargaining Power of Suppliers
- 4.7.3 Bargaining Power of Buyers
- 4.7.4 Threat of Substitutes
- 4.7.5 Competitive Rivalry
- 4.8 Investment Analysis
5 Market Size & Growth Forecasts
- 5.1 By Battery Type
- 5.1.1 Lithium-ion (Lithium Iron Phosphate (LFP), Nickel-Manganese-Cobalt (NMC), Lithium Titanate (LTO))
- 5.1.2 Lead-acid
- 5.1.3 Flow Battery (Vanadium Redox, Zinc-Bromine)
- 5.1.4 Sodium-ion
- 5.1.5 Other Battery Technologies (NiCd, Hybrid Super-capacitors)
- 5.2 By Connection Type
- 5.2.1 On-Grid (Utility Interconnected)
- 5.2.2 Off-Grid (Micro-Grid, Hybrid)
- 5.3 By Component
- 5.3.1 Battery Pack and Racks
- 5.3.2 Power Conversion System (PCS)
- 5.3.3 Energy Management Software (EMS)
- 5.3.4 Balance-of-Plant and Services
- 5.4 By Energy Capacity Range
- 5.4.1 Below 10 MWh
- 5.4.2 10 to 100 MWh
- 5.4.3 100 to 500 MWh
- 5.4.4 Above 500 MWh
- 5.5 By End-user Application
- 5.5.1 Utility
- 5.5.2 Commercial and Industrial
- 5.5.3 Residential
- 5.6 By Geography
- 5.6.1 Saudi Arabia
- 5.6.2 United Arab Emirates
- 5.6.3 Qatar
- 5.6.4 South Africa
- 5.6.5 Egypt
- 5.6.6 Kenya
- 5.6.7 Rest of Middle East and Africa
6 Competitive Landscape
- 6.1 Market Concentration
- 6.2 Strategic Moves (M&A, Partnerships, PPAs)
- 6.3 Market Share Analysis (Market Rank/Share for key companies)
- 6.4 Company Profiles (includes Global level Overview, Market level overview, Core Segments, Financials as available, Strategic Information, Products & Services, and Recent Developments)
- 6.4.1 Tesla Inc.
- 6.4.2 Huawei Digital Power
- 6.4.3 Fluence Energy Inc.
- 6.4.4 NGK Insulators Ltd.
- 6.4.5 BYD Co. Ltd.
- 6.4.6 Eaton Corporation plc
- 6.4.7 Schneider Electric SE
- 6.4.8 Siemens Energy AG
- 6.4.9 Sungrow Power Supply Co.
- 6.4.10 ABB Ltd.
- 6.4.11 Wartsila Oyj
- 6.4.12 Saft Groupe SA
- 6.4.13 Aggreko Ltd.
- 6.4.14 Eskom Holdings SOC Ltd.
- 6.4.15 Philadelphia Solar Ltd.
- 6.4.16 VanadiumCorp Resource Inc.
- 6.4.17 Sumitomo Corporation
- 6.4.18 Contemporary Amperex Technology (CATL)
- 6.4.19 AlphaESS Co. Ltd.
- 6.4.20 Desert Technologies (SA)
7 Market Opportunities & Future Outlook
- 7.1 White-Space & Unmet-Need Assessment

 南美洲電池能源儲存系統(BESS):市場佔有率分析、行業趨勢和統計數據以及成長預測(2026-2031 年)歐洲電池能源儲存系統(BESS):市場佔有率分析、產業趨勢與統計及成長預測(2026-2031)
 對 2035 年前的太陽能電池儲能系統市場進行分析和預測:按類型、產品、技術、組件、應用、最終用戶、功能、安裝類型、解決方案和模式。
 電池能源儲存系統市場預測至2034年—按電池類型、系統組件、安裝配置、額定功率、最終用戶和地區分類的全球分析
 電池能源儲存系統市場:2026-2032年全球市場預測(按組件、電池類型、能源容量、連接類型、電網位置、應用和銷售管道)
 全球電池能源儲存系統(BESS)TIC市場:按服務類型、電池類型、交付方式、採購類型、最終用戶和地區分類-預測至2032年電池能源儲存系統市場預測至2034年—按電池技術、輸出容量、應用、最終用戶和地區分類的全球分析電池能源儲存系統(BESS):市場佔有率分析、產業趨勢與統計及成長預測(2026-2031)印度電池能源儲存系統(BESS):市場佔有率分析、產業趨勢與統計及成長預測(2026-2031)
 2026年全球電錶前電池市場報告