


 |
市場調查報告書
商品編碼
2124394
多點觸控觸控歸因:市場佔有率分析、產業趨勢與統計、成長預測(2026-2031 年)Multi-Touch Attribution - Market Share Analysis, Industry Trends & Statistics, Growth Forecasts (2026 - 2031) |
||||||

※ 本網頁內容可能與最新版本有所差異。詳細情況請與我們聯繫。
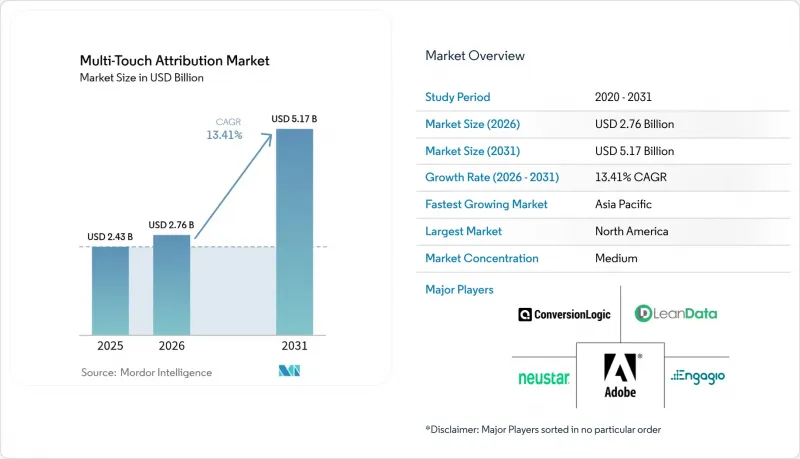
根據 Mordor Intelligence 估計,多點觸控歸因市場在 2026 年的價值為 27.6 億美元,從 2025 年的 24.3 億美元成長到 2031 年的 51.7 億美元。
預計從 2026 年到 2031 年,其複合年成長率將達到 13.41%。
本報告按歸因模型(演算法/數據驅動、線性、時間衰減等)、組件(解決方案、服務)、部署模式(雲端、本地部署)、組織規模(中小企業、大型企業)、最終用戶行業(零售/電子商務、銀行、金融服務和保險、IT/電信等)以及地區進行細分。市場預測以美元計價。
全球多點觸控歸因市場趨勢與洞察
無 cookie 瀏覽器的興起正在加速第一方資料策略的發展。
第三方 Cookie 的逐步淘汰迫使企業建立基於客戶資料平台的、以使用者許可為基礎的資料基礎架構。整合身分解析、差分隱私和安全運算的品牌報告稱,其客戶終身價值有所提升,獲客成本降低。隨著資料流從機率性轉向確定性,能夠接收哈希處理的電子郵件地址、會員 ID 和潔淨室輸出數據,同時又符合當地隱私法律的歸因引擎的需求日益成長。具備原生用戶許可管理功能和強大管治的供應商正在贏得大規模契約,尤其是在監管嚴格的行業。
亞洲全通路零售的普及正在推動複雜的客戶體驗歷程。
目前,亞太地區的零售商正透過將應用程式內、直播和店內接點整合到超級應用和整合錢包中,建構複雜的轉換路徑。 Z世代消費者期望獲得無縫體驗,這迫使零售商實施歸因分析,將社交媒體發現、QR碼激活和店內購買等行為映射到同一圖表中。早期採用者報告稱,透過從「最後點擊」模型轉向演算法模型(該模型更重視漏斗早期階段的互動),行銷效率實現了兩位數的提升。
隱私法規導致的訊號遺失阻礙了資料收集。
GDPR 和 CPRA 等法規限制了 cookie、跨站追蹤和使用者畫像的使用。行銷人員面臨著資料集縮減、對轉換模型的依賴性增強以及更為嚴格的使用者許可流程等挑戰。儘管許多公司正透過投資無塵室和噪音技術來應對這些挑戰,但隨著用戶選擇退出率的上升,歸因準確度仍然下降。合規成本正在擠壓創新預算,而政策的不斷變化也為規劃帶來了不確定性。
細分市場分析
到2025年,演算法和數據驅動框架將佔據34.25%的市場佔有率,到2031年將以14.05%的複合年成長率成長,這標誌著行銷方式正從基於規則的方法向機器學習方法發生顯著轉變。這些模型分析數十億個觸點,動態分配轉換貢獻,無需不斷微調規則,並提高了預測準確性。線性、時間衰減和U型方法仍然用於過渡性需求和單通路宣傳活動,但隨著行銷人員意識到機率和人工智慧驅動的計算可以提高廣告支出回報率(ROAS),這些方法正在逐漸被淘汰。 Meridian、Mix Modeler和類似的解決方案都包含因果推斷功能,可以對真實情況進行基準測試,其自助式介面允許不具備技術專長的團隊無需編寫程式碼即可開始測試。
隨著品牌對更快速的洞察和更深入的跨裝置分析的需求日益成長,對演算法引擎的持續投入將推動多點觸控歸因市場的發展。將先進的調查方法與多層隱私技術結合,能夠幫助企業平衡合規性和績效,從而進一步加速演算法的普及應用。早期試點計畫表明,品牌用演算法模型取代末次點擊歸因方法,可以顯著降低兩位數的浪費性支出,並將預算重新分配到先前被低估的管道。
預計到2025年,解決方案仍將佔總營收的69.10%,其核心資料擷取、建模和視覺化技術堆疊定義了多點觸控歸因市場。然而,隨著企業意識到自身對策略諮詢、數據映射和模型管治的需求,服務板塊正以15.85%的複合年成長率快速成長。知名品牌正利用整合合作夥伴來整合POS資料、CRM事件、串流日誌和使用者授權訊息,這也解釋了為何業務收益的成長速度超過了授權收入。
對於面臨技能短缺的企業而言,託管服務正成為更具吸引力的選擇。外包分析師負責最佳化演算法權重、進行增量分析並解讀儀錶板,從而為經營團隊決策提供支援。這種實踐性支援不僅提高了平台供應商的合約續約率,而且隨著實施後最佳化工作逐漸演變為多年期契約,也為企業帶來了額外的市場收入。
區域分析
到2025年,北美將佔全球整體收入的39.20%。這主要得益於程序化廣告領域的大量投資、聯網電視以及隱私增強技術的早期滲透。美國是行銷效果評估領域人工智慧實驗的中心,加拿大正在推動全通路零售分析的發展,而墨西哥正在崛起為電子商務歸因領域的高成長前沿陣地。
歐洲排名第二,「隱私權設計」已成為不可妥協的採購標準,這主要受到《一般資料保護規則》(GDPR) 的影響。德國在其製造業出口鏈中強調B2B歸因分析,英國專注於金融和零售業,而法國正隨著超級市場收入來源多元化而拓展零售媒體衡量。北歐國家憑藉其先進的行動優先歸因分析脫穎而出,這得益於廣泛的5G普及和高應用採用率。
亞太地區是成長最快的地區,預計到2031年複合年成長率將達到14.85%,這反映了以行動裝置為中心的消費行為、超級應用生態系統以及直播電商的發展。在中國,整合直播互動、社群媒體推薦和店內QR碼掃描的互動試點計畫正在進行中,這表明市場對能夠分析複雜交織觸點的模型有著迫切的需求。日本正在推動聯網電視和遊戲領域的跨裝置歸因分析,而在印度,數位支付基礎設施的擴張正在推動零售和金融科技領域對歸因分析的需求。在東南亞市場,從新加坡到印度尼西亞,隨著多點觸控歸因分析市場在所有主要地區獲得不斷成長的預算。
其他好處:
- Excel格式的市場預測(ME)表
- 3個月的分析師支持
目錄
第1章:引言
- 研究假設和市場定義
- 調查範圍
第2章:調查方法
第3章執行摘要
第4章 市場狀況
- 市場概覽
- 市場促進因素
- 不支援 Cookie 的瀏覽器的興起,正在拓展第一方資料策略。
- 亞洲全通路零售的蓬勃發展正在帶來複雜的客戶體驗。
- 零售媒體網路的興起增加了對線上線下歸因的需求。
- 北美程式化連網電視廣告的普及現狀
- 一套基於人工智慧的行銷自動化套件,內建歸因功能。
- 市場限制因素
- 隱私法規(GDPR、CPRA)導致訊號遺失,阻礙了資料收集。
- 市場營運人員短缺,無法有效實施高階分析。
- 歐洲傳統行銷技術堆疊整合成本高昂
- ID圖標準的差異限制了設備間通訊的準確性。
- 產業生態系分析
- 技術展望
- 波特五力分析
第5章 市場規模與成長預測
- 按歸因模型
- 演算法/數據驅動
- 線性
- 時間衰減
- U形/特定位置
- 其他(自訂、首次/最後一次觸摸)
- 按組件
- 解決方案
- 服務
- 諮詢
- 整合與部署
- 支援與維護
- 部署模式
- 雲
- 現場
- 按組織規模
- 中小企業
- 大公司
- 按最終用戶行業分類
- 零售與電子商務
- BFSI
- IT/通訊
- 家用電子電器與耐用消費品
- 觀光觀光
- 醫療保健和生命科學
- 媒體與娛樂
- 按地區
- 北美洲
- 美國
- 加拿大
- 墨西哥
- 歐洲
- 德國
- 英國
- 法國
- 北歐的
- 其他歐洲國家
- 南美洲
- 巴西
- 其他南美國家
- 亞太地區
- 中國
- 日本
- 印度
- 東南亞
- 其他亞太國家
- 中東和非洲
- 中東
- 波灣合作理事會(GCC)成員國
- 土耳其
- 其他中東國家
- 非洲
- 南非
- 其他非洲國家
- 中東
- 北美洲
第6章 競爭情勢
- 市場集中度
- 策略趨勢
- 市佔率分析
- 公司簡介
- Adobe Inc.
- Alphabet Inc.(Google Analytics 360)
- AppsFlyer Ltd.
- Adjust GmbH
- Branch Metrics Inc.
- C3 Metrics Inc.
- CaliberMind Inc.
- Conversion Logic Inc.
- Engagio Inc.(Demandbase)
- HubSpot Inc.
- Improvado Inc.
- Impact.com Inc.
- LeanData Inc.
- LeadsRx Inc.(Acquire.io)
- Merkle Inc.
- Model N Inc.
- Neustar Inc.
- NielsenIQ(VisualIQ)
- Oracle Corp.(Eloqua)
- Rockerbox Inc.
- SAP SE
- SegmentStream Ltd.
- Singular Labs Inc.
- The Trade Desk Inc.
第7章 市場機會與未來展望
According to Mordor Intelligence, multi-touch attribution market size in 2026 is estimated at USD 2.76 billion, growing from 2025 value of USD 2.43 billion with 2031 projections showing USD 5.17 billion, growing at 13.41% CAGR over 2026-2031.
This report is Segmented by Attribution Model (Algorithmic/Data-Driven, Linear, Time-Decay, and More), Component (Solutions, and Services), Deployment Mode (Cloud, and On-Premise), Organization Size (Small and Medium Enterprises, and Large Enterprises), End-User Industry (Retail and E-Commerce, BFSI, IT and Telecom, and More), and Geography. The Market Forecasts are Provided in Terms of Value (USD).
Global Multi-Touch Attribution Market Trends and Insights
Increasing First-Party Data Strategies Spurred by Cookie-Less Browsers
Third-party cookie deprecation has pushed companies to build consent-based data foundations anchored in customer data platforms. Brands integrating identity resolution, differential privacy, and secure computation are reporting higher lifetime value and lower acquisition costs. As data flows shift from probabilistic to deterministic, demand rises for attribution engines able to ingest hashed emails, loyalty IDs, and clean-room outputs while honoring regional privacy laws. Vendors that embed native consent orchestration and robust governance are winning large contracts, particularly in regulated industries.
Proliferation of Omnichannel Retail in Asia Fueling Complex Journeys
Asia-Pacific retailers now blend in-app, live-stream, and in-store touchpoints inside super-apps and unified wallets, generating intricate conversion paths. Gen Z shoppers expect seamless experiences, forcing merchants to deploy attribution that maps social discovery, QR-code activations, and store purchases in one graph. Early adopters confirm double-digit improvements in marketing efficiency after shifting from last-click to algorithmic models able to weight upper-funnel engagements.
Signal Loss from Privacy Regulations Hindering Data Collection
Rules such as GDPR and CPRA restrict cookies, cross-site tracking, and user profiling. Marketers face thinner datasets, heavier reliance on modeled conversions, and tougher consent workflows. Many respond by investing in clean rooms and additive noise techniques, yet attribution precision still drops when opt-out rates climb. Compliance expenses divert budgets from innovation, and perpetual policy changes create planning uncertainty.
Other drivers and restraints analyzed in the detailed report include:
- Rise of Retail Media Networks Elevating Offline-to-Online Attribution Needs
- Programmatic CTV Advertising Adoption in North America
- Marketing-Ops Talent Shortage for Advanced Analytics Deployment
For complete list of drivers and restraints, kindly check the Table Of Contents.
Segment Analysis
Algorithmic and data-driven frameworks controlled 34.25% share in 2025 and will expand at 14.05% CAGR to 2031, marking the clear shift from rule-based to machine-learning approaches. These models parse billions of touchpoints to assign conversion credit dynamically, eliminating constant rule tweaking and boosting predictive accuracy. Linear, time-decay, and U-shape approaches persist for transitional mandates or single-channel campaigns but are ceding ground as marketers witness higher return on ad spend under probabilistic, AI-powered calculations. Meridian, Mix Modeler, and similar offerings embed causal inference that benchmarks true lift, while self-serve interfaces let non-technical teams launch tests without coding.
Continued investment in algorithmic engines will lift the multi-touch attribution market as brands demand faster insights and cross-device granularity. When advanced methodologies are paired with privacy-tech layers, enterprises balance compliance and performance, reinforcing adoption momentum. Early pilots reveal that brands replacing last-click with algorithmic models have trimmed wasted spend by double digits, steering budget to channels previously undervalued.
Solutions still provided 69.10% of 2025 revenue by delivering the core data ingestion, modeling, and visualization stack that defines the multi-touch attribution market. Yet services are accelerating at a 15.85% CAGR as enterprises realize the need for strategy consulting, data mapping, and model governance. Large brands tap integration partners to link point-of-sale data, CRM events, streaming logs, and consent strings, underscoring why services revenue rises faster than licenses.
Managed services further appeal to organizations confronting skill shortages. Outsourced analysts fine-tune algorithm weights, run incrementality studies, and interpret dashboards for C-suite decisions. This hands-on support not only raises renewal rates for platform vendors but also drives incremental market revenue as post-implementation optimization becomes a multi-year engagement.
Complete Report Scope:
- By Attribution Model
- Algorithmic/Data-Driven
- Linear
- Time-Decay
- U-Shape/Position-Based
- Others (Custom, First/Last Touch)
- By Component
- Solutions
- Services
- Consulting
- Integration and Deployment
- Support and Maintenance
- By Deployment Mode
- Cloud
- On-Premise
- By Organization Size
- Small and Medium Enterprises (SMEs)
- Large Enterprises
- By End-User Industry
- Retail and E-commerce
- BFSI
- IT and Telecom
- Consumer Electronics and Durables
- Travel and Tourism
- Healthcare and Life Sciences
- Media and Entertainment
- By Geography
- North America
- United States
- Canada
- Mexico
- Europe
- Germany
- United Kingdom
- France
- Nordics
- Rest of Europe
- South America
- Brazil
- Rest of South America
- Asia Pacific
- China
- Japan
- India
- South East Asia
- Rest of Asia Pacific
- Middle East and Africa
- Middle East
- Gulf Cooperation Council Countries
- Turkey
- Rest of Middle East
- Africa
- South Africa
- Rest of Africa
- Middle East
- North America
Geography Analysis
North America generated 39.20% of global revenue in 2025, driven by deep programmatic spend, connected-TV scale, and early traction for privacy-enhancing technologies. The United States is the epicenter for AI experimentation in marketing measurement, while Canada advances omnichannel retail analytics and Mexico emerges as a high-growth frontier for e-commerce attribution.
Europe ranks second, shaped by the General Data Protection Regulation, which positions privacy-by-design as a non-negotiable buying criterion. Germany favors B2B attribution for manufacturing export chains, the United Kingdom emphasizes finance and retail, and France is scaling retail-media measurement as supermarkets diversify revenue streams. Nordic countries stand out for mobile-first attribution sophistication, aided by broad 5G coverage and high app penetration.
Asia-Pacific is the fastest-growing region at 14.85% CAGR to 2031, reflecting mobile-centric consumer behavior, super-app ecosystems, and live-stream commerce. China pilots attribution that stitches live-stream interactions, social referrals, and in-store QR code scans, illustrating demand for models that parse intertwined touchpoints. Japan pushes cross-device attribution for connected-TV and gaming, while India's expanding digital payments infrastructure fuels attribution needs in retail and fintech. Southeast Asian markets, from Singapore to Indonesia, prioritize omnichannel analytics as brick-and-mortar chains launch digital storefronts. Collectively, these dynamics ensure the multi-touch attribution market captures expanding budgets across all major geographies.
- Adobe Inc.
- Alphabet Inc. (Google Analytics 360)
- AppsFlyer Ltd.
- Adjust GmbH
- Branch Metrics Inc.
- C3 Metrics Inc.
- CaliberMind Inc.
- Conversion Logic Inc.
- Engagio Inc. (Demandbase)
- HubSpot Inc.
- Improvado Inc.
- Impact.com Inc.
- LeanData Inc.
- LeadsRx Inc. (Acquire.io)
- Merkle Inc.
- Model N Inc.
- Neustar Inc.
- NielsenIQ (VisualIQ)
- Oracle Corp. (Eloqua)
- Rockerbox Inc.
- SAP SE
- SegmentStream Ltd.
- Singular Labs Inc.
- The Trade Desk Inc.
Additional Benefits:
- The market estimate (ME) sheet in Excel format
- 3 months of analyst support
TABLE OF CONTENTS
1 INTRODUCTION
- 1.1 Study Assumptions and Market Definition
- 1.2 Scope of the Study
2 RESEARCH METHODOLOGY
3 EXECUTIVE SUMMARY
4 MARKET LANDSCAPE
- 4.1 Market Overview
- 4.2 Market Drivers
- 4.2.1 Increasing First-Party Data Strategies Spurred by Cookie-less Browsers
- 4.2.2 Proliferation of Omnichannel Retail in Asia Fueling Complex Journeys
- 4.2.3 Rise of Retail Media Networks Elevating Offline-to-Online Attribution Needs
- 4.2.4 Programmatic CTV Advertising Adoption in North America
- 4.2.5 AI-Powered Marketing Automation Suites Bundling Attribution Natively
- 4.3 Market Restraints
- 4.3.1 Signal Loss from Privacy Regulations (GDPR, CPRA) Hindering Data Collection
- 4.3.2 Marketing-Ops Talent Shortage for Advanced Analytics Deployment
- 4.3.3 High Integration Costs with Legacy MarTech Stacks in Europe
- 4.3.4 Disparate ID Graph Standards Limiting Cross-Device Stitching Accuracy
- 4.4 Industry Ecosystem Analysis
- 4.5 Technological Outlook
- 4.6 Porter's Five Forces Analysis
- 4.6.1 Bargaining Power of Suppliers
- 4.6.2 Bargaining Power of Buyers
- 4.6.3 Threat of New Entrants
- 4.6.4 Threat of Substitutes
- 4.6.5 Competitive Rivalry
5 MARKET SIZE AND GROWTH FORECASTS (VALUES)
- 5.1 By Attribution Model
- 5.1.1 Algorithmic/Data-Driven
- 5.1.2 Linear
- 5.1.3 Time-Decay
- 5.1.4 U-Shape/Position-Based
- 5.1.5 Others (Custom, First/Last Touch)
- 5.2 By Component
- 5.2.1 Solutions
- 5.2.2 Services
- 5.2.2.1 Consulting
- 5.2.2.2 Integration and Deployment
- 5.2.2.3 Support and Maintenance
- 5.3 By Deployment Mode
- 5.3.1 Cloud
- 5.3.2 On-Premise
- 5.4 By Organization Size
- 5.4.1 Small and Medium Enterprises (SMEs)
- 5.4.2 Large Enterprises
- 5.5 By End-User Industry
- 5.5.1 Retail and E-commerce
- 5.5.2 BFSI
- 5.5.3 IT and Telecom
- 5.5.4 Consumer Electronics and Durables
- 5.5.5 Travel and Tourism
- 5.5.6 Healthcare and Life Sciences
- 5.5.7 Media and Entertainment
- 5.6 By Geography
- 5.6.1 North America
- 5.6.1.1 United States
- 5.6.1.2 Canada
- 5.6.1.3 Mexico
- 5.6.2 Europe
- 5.6.2.1 Germany
- 5.6.2.2 United Kingdom
- 5.6.2.3 France
- 5.6.2.4 Nordics
- 5.6.2.5 Rest of Europe
- 5.6.3 South America
- 5.6.3.1 Brazil
- 5.6.3.2 Rest of South America
- 5.6.4 Asia Pacific
- 5.6.4.1 China
- 5.6.4.2 Japan
- 5.6.4.3 India
- 5.6.4.4 South East Asia
- 5.6.4.5 Rest of Asia Pacific
- 5.6.5 Middle East and Africa
- 5.6.5.1 Middle East
- 5.6.5.1.1 Gulf Cooperation Council Countries
- 5.6.5.1.2 Turkey
- 5.6.5.1.3 Rest of Middle East
- 5.6.5.2 Africa
- 5.6.5.2.1 South Africa
- 5.6.5.2.2 Rest of Africa
- 5.6.5.1 Middle East
- 5.6.1 North America
6 COMPETITIVE LANDSCAPE
- 6.1 Market Concentration
- 6.2 Strategic Moves
- 6.3 Market Share Analysis
- 6.4 Company Profiles (includes Global level Overview, Market level overview, Core Segments, Financials as available, Strategic Information, Market Rank/Share for key companies, Products and Services, and Recent Developments)
- 6.4.1 Adobe Inc.
- 6.4.2 Alphabet Inc. (Google Analytics 360)
- 6.4.3 AppsFlyer Ltd.
- 6.4.4 Adjust GmbH
- 6.4.5 Branch Metrics Inc.
- 6.4.6 C3 Metrics Inc.
- 6.4.7 CaliberMind Inc.
- 6.4.8 Conversion Logic Inc.
- 6.4.9 Engagio Inc. (Demandbase)
- 6.4.10 HubSpot Inc.
- 6.4.11 Improvado Inc.
- 6.4.12 Impact.com Inc.
- 6.4.13 LeanData Inc.
- 6.4.14 LeadsRx Inc. (Acquire.io)
- 6.4.15 Merkle Inc.
- 6.4.16 Model N Inc.
- 6.4.17 Neustar Inc.
- 6.4.18 NielsenIQ (VisualIQ)
- 6.4.19 Oracle Corp. (Eloqua)
- 6.4.20 Rockerbox Inc.
- 6.4.21 SAP SE
- 6.4.22 SegmentStream Ltd.
- 6.4.23 Singular Labs Inc.
- 6.4.24 The Trade Desk Inc.
7 MARKET OPPORTUNITIES AND FUTURE OUTLOOK
- 7.1 White-Space and Unmet-Need Assessment

 行銷歸因服務:市場佔有率分析、產業趨勢與統計資料、成長預測(2026-2031 年)
 行銷歸因軟體市場:按歸因模型、產業、部署類型和組織規模分類 - 2026-2032 年全球預測
 全球多點觸控觸控歸因市場
 多點觸控歸因市場規模、佔有率和成長分析(按模型類型、組件、部署方法、組織規模、最終用戶產業和地區):產業預測(2025-2032)
 行銷歸因軟體市場規模、佔有率、趨勢分析報告:按類型、部署、公司規模、最終用途、地區、細分預測,2025-2030 年
 行銷歸因軟體市場 - 全球產業規模、佔有率、趨勢、機會和預測,按組件、歸因類型、組織規模、部署類型、地區和競爭細分,2019-2029F