


 |
市場調查報告書
商品編碼
2123764
石油天然氣產業下游領域:市場佔有率分析、產業趨勢與統計資料、成長預測(2026-2031 年)Oil And Gas Downstream - Market Share Analysis, Industry Trends & Statistics, Growth Forecasts (2026 - 2031) |
||||||

※ 本網頁內容可能與最新版本有所差異。詳細情況請與我們聯繫。
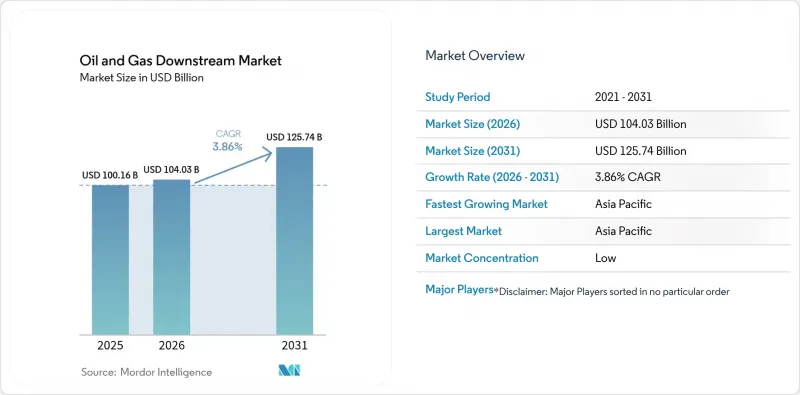
預計到 2026 年,石油和天然氣產業的下游市場規模將達到 1,040.3 億美元,高於 2025 年的 1,001.6 億美元,預計到 2031 年將達到 1,257.4 億美元。
預計從 2026 年到 2031 年,其複合年成長率將達到 3.86%。
本報告按類型(煉油廠和石化廠)、產品類型(成品油、石化產品、潤滑油)、分銷管道(直銷/批發、分銷商/商業通路、零售)和地區(北美、歐洲、亞太、南美、中東和非洲)進行細分。市場規模和預測均以美元計價。
全球下游油氣市場趨勢及洞察。
煉油產能的快速擴張正在加速區域經濟格局的再平衡。
2024年至2028年間,亞太地區和中東地區將總合490萬桶/日的石油項目在建,這將使全球經濟重心向這些地區轉移。這使得一體化營運商能夠充分利用規模經濟和原料接近性優勢,同時也對歐洲和北美地區的利潤率構成壓力。
石油化工產品需求的成長正在改變煉油廠的經濟效益。
石油化學產品目前已佔全球石油需求的14%,預計也將持續成長。這迫使煉油商調整其業務結構,轉向在綜合性設施中進行石腦油裂解和芳烴化合物提取,沙烏地阿美公司的Motiva項目和中國沿海的大型企劃便是例證。
電動車的普及給汽油需求的基本面帶來了壓力。
預計到2024年,全球電動車銷量將達到1,400萬輛,這將加速歐洲部分地區和中國汽油需求的下降。這促使煉油商將重心轉向柴油、噴射機燃料和石化產品。
細分市場分析
預計到2025年,煉油廠將佔油氣下游市場65.25%的佔有率,年複合成長率達4.52%,主要得益於資產利用率的提高和石化產業的擴張。該領域受益於靈活的配置,可以根據即時利潤訊號在運輸燃料和化學原料之間進行切換。沙烏地阿美的Motiva擴建計畫和信實工業的賈姆訥格爾煉油廠體現了規模協同效應,降低了每桶成本並提高了加氫裂解裝置的產率。一體化設施的建造模糊了煉油廠與石化廠之間的界限,提高了小規模獨立煉油廠的進入門檻。
儘管石化裝置僅佔34.75%的市場佔有率,但其增速仍高達4.72%,這主要得益於亞太地區石腦油裂解裝置和丙烷脫氫裝置的激增。營運商正在整合公用設施、物流和氫氣網路,並充分利用產品獨特的增值特性。然而,原物料價格的波動以及來自大型綜合設施的競爭正在限制獨立設施的經濟效益。整體而言,透過結合上述兩種發展路徑的產能策略,石油和天然氣下游市場的規模正變得更加穩健。
區域分析
預計到2025年,亞太地區將以32.85%的市佔率引領全球市場,年均成長率達4.92%,主要得益於人口結構變化、工業化進程以及政策支持等因素的共同推動,進而帶動中國、印度和東南亞產能的激增。在中國,石化產品需求的成長彌補了汽油消費成長放緩的局面;而印度煉油商則致力於向非洲和拉丁美洲出口溢價產品。印尼、馬來西亞和泰國則透過沿著主要海上航線建立樞紐輻射式物流網路,不斷最佳化產品組合。
在北美,儘管汽油需求下降,但各公司正利用富含乙烷的頁岩資源為石化裂解裝置和加氫處理設備供應原料,從而維持具有競爭力的現金成本。美國菲利普斯66等大型企業集團正在維修其設施,生產可再生柴油,以滿足加州的低碳燃料標準(LCFS)和聯邦政府的永續航空燃料(SAF)獎勵。加拿大重油平土機和墨西哥政府主導的新建設案正在實現原料組合多元化,但新建獨立產能仍面臨資金籌措挑戰。
在歐洲,根據「Fit-for-55」框架,一些設施正在轉型為生物中心,生產氫化植物油(HVO)和永續航空燃料(SAF),以滿足不斷下降的燃料需求,同時碳捕獲與封存(CCS)叢集也在整合,以減少二氧化碳殘留排放。在中東,諸如阿布達比國家石油公司(ADNOC)的盧瓦伊斯二期計畫等,正利用天然氣和液體流量以及公共產業補貼,向歐盟和亞洲的進口國供應燃料。在非洲,奈及利亞和安哥拉正在湧現新的綜合設施,但它們面臨資金短缺的問題。同時,巴西石油公司(Petrobras)在各個地區的下游油氣市場中主導地位,在滿足國內需求的同時,應對貨幣和政策週期的波動。
其他好處:
- Excel格式的市場預測(ME)表
- 3個月的分析師支持
目錄
第1章:引言
- 研究假設和市場定義
- 調查範圍
第2章:調查方法
第3章執行摘要
第4章 市場狀況
- 市場概覽
- 市場促進因素
- 煉油產能快速成長(亞太地區和中東)
- 石油化學產品需求快速成長
- IMO 2020 與含硫燃料的強化監管
- 航空燃油價格回升和強制性永續航空燃料
- 利用數位孿生/人工智慧最佳化營運成本
- 氫產品貨幣化
- 市場限制因素
- 電動車的普及正在削弱汽油需求。
- 淨零排放政策以遏制石化燃料的使用
- 氣候風險導致的營運中斷與保險問題
- 高利率阻礙了新建煉油廠的建設。
- 供應鏈分析
- 監理情勢
- 技術展望
- 煉油廠處理能力分析
- 主要項目資訊
- 波特五力模型
- PESTLE分析
第5章 市場規模與成長預測
- 按類型
- 煉油廠
- 石化廠
- 依產品類型
- 石油精煉產品
- 石油化學產品
- 潤滑劑
- 透過分銷管道
- 直銷/批發
- 銷售代理商/商業
- 零售
- 按地區
- 北美洲
- 美國
- 加拿大
- 墨西哥
- 歐洲
- 德國
- 英國
- 挪威
- 荷蘭
- 俄羅斯
- 其他歐洲國家
- 亞太地區
- 中國
- 印度
- 日本
- 韓國
- 東南亞國協
- 澳洲
- 其他亞太國家
- 南美洲
- 巴西
- 阿根廷
- 哥倫比亞
- 其他南美國家
- 中東和非洲
- 沙烏地阿拉伯
- 阿拉伯聯合大公國
- 卡達
- 南非
- 奈及利亞
- 其他中東和非洲國家
- 北美洲
第6章 競爭情勢
- 市場集中度
- 策略趨勢(併購、聯盟、購電協議)
- 市場佔有率分析(主要公司的市場排名和佔有率)
- 公司簡介
- China Petroleum & Chemical Corp(Sinopec)
- Exxon Mobil Corporation
- Royal Dutch Shell plc
- Saudi Arabian Oil Company(Saudi Aramco)
- BP plc
- TotalEnergies SE
- China National Petroleum Corporation(CNPC)
- Reliance Industries Limited
- Indian Oil Corporation Limited
- Chevron Corporation
- Phillips 66 Company
- Marathon Petroleum Corporation
- Valero Energy Corporation
- Petroleo Brasileiro SA(Petrobras)
- ENI SpA
- PTT Public Company Limited
- SK Innovation Co., Ltd.
- Kuwait Petroleum Corporation
- Lukoil PJSC
- OMV Group
第7章 市場機會與未來展望
According to Mordor Intelligence, oil and gas downstream market size market size in 2026 is estimated at USD 104.03 billion, growing from 2025 value of USD 100.16 billion with 2031 projections showing USD 125.74 billion, growing at 3.86% CAGR over 2026-2031.
This report is Segmented by Type (Refineries and Petrochemical Plants), Product Type (Refined Petroleum Products, Petrochemicals, and Lubricants), Distribution Channel (Direct Sales/Wholesale, Distributors/Commercial, and Retail), and Geography (North America, Europe, Asia-Pacific, South America, and Middle East and Africa). The Market Sizes and Forecasts are Provided in Terms of Value (USD).
Global Oil And Gas Downstream Market Trends and Insights
Surge in Refining Capacity Expansion Drives Regional Rebalancing
Asia-Pacific and Middle Eastern projects, totaling 4.9 million b/d between 2024 and 2028, are tilting global economics toward these hubs, giving integrated operators scale and feedstock proximity advantages while compressing European and North American margins.
Petrochemical Demand Growth Transforms Refinery Economics
Petrochemicals already account for 14% of global oil demand and are expected to rise further, prompting refiners to reconfigure their operations toward naphtha cracking and aromatics extraction in integrated complexes, as exemplified by Saudi Aramco's Motiva and China's coastal mega-projects.
Electric Vehicle Adoption Pressures Gasoline Demand Fundamentals
Global EV sales reached 14 million units in 2024, accelerating the decline in gasoline demand in Europe and certain segments of China, prompting refiners to shift their focus toward diesel, jet fuel, and petrochemicals.
Other drivers and restraints analyzed in the detailed report include:
- IMO Sulfur Regulations Drive Ongoing Compliance Investments
- Aviation-Fuel Recovery and SAF Mandates Create New Revenue Streams
- Net-Zero Climate Policies Constrain Long-Term Investment Horizons
For complete list of drivers and restraints, kindly check the Table Of Contents.
Segment Analysis
Refineries accounted for 65.25% of the Oil & Gas Downstream market in 2025 and should advance at a 4.52% CAGR, a pace underpinned by asset-utilization upgrades and petrochemical add-ons. This segment benefits from a flexible configuration that toggles between transport fuels and chemical feedstocks based on real-time margin signals. Saudi Aramco's Motiva expansion and Reliance's Jamnagar complex exemplify the scale synergies that lower per-barrel costs and enhance hydrocracker yields. Integrated builds blur the lines with petrochemical plants, raising barriers for smaller standalone facilities.
Petrochemical plants, although holding a smaller 34.75% share, post a 4.72% trajectory as naphtha crackers and propane dehydrogenation units proliferate in the Asia-Pacific region. Operators bundle shared utilities, logistics, and hydrogen networks to exploit co-product valorization. Yet feedstock-price swings and competition from integrated mega-sites temper standalone economics. Overall, the Oil & Gas Downstream market size gains resilience from this dual-track capacity strategy.
Complete Report Scope:
- By Type
- Refineries
- Petrochemical Plants
- By Product Type
- Refined Petroleum Products
- Petrochemicals
- Lubricants
- By Distribution Channel
- Direct Sales/Wholesale
- Distributors/Commercial
- Retail
- By Geography
- North America
- United States
- Canada
- Mexico
- Europe
- Germany
- United Kingdom
- Norway
- Netherlands
- Russia
- Rest of Europe
- Asia-Pacific
- China
- India
- Japan
- South Korea
- ASEAN Countries
- Australia
- Rest of Asia Pacific
- South America
- Brazil
- Argentina
- Colombia
- Rest of South America
- Middle East and Africa
- Saudi Arabia
- United Arab Emirates
- Qatar
- South Africa
- Nigeria
- Rest of Middle East and Africa
- North America
Geography Analysis
The Asia-Pacific region leads with a 32.85% share in 2025 and is expected to grow at a rate of 4.92% annually due to capacity surges in China, India, and Southeast Asia, where demographic tailwinds, industrialization, and policy support converge. China's petrochemical pull counters peaking gasoline use, while Indian refiners chase export premiums to Africa and Latin America. Indonesia, Malaysia, and Thailand strengthen their product balance through hub-and-spoke logistics along vital sea lanes.
North America, despite a decline in gasoline demand, exploits ethane-rich shale to feed petrochemical crackers and hydrotreaters, thereby anchoring competitive cash costs. U.S. consolidators such as Phillips 66 retrofit units for renewable diesel to align with California's LCFS and federal SAF incentives. Canada's heavy-oil upgraders and Mexico's government-driven builds diversify feedstock slates, though financing hurdles persist for new standalone capacity.
Europe navigates declining fuel volumes under the Fit-for-55 umbrella by converting sites into bio-hubs producing HVO and SAF, while integrating CCS clusters to mitigate residual CO2. Middle Eastern projects, such as ADNOC's Ruwais Phase II, leverage gas-liquids streams and subsidized utilities to serve EU and Asian importers. Africa is witnessing emerging complexes in Nigeria and Angola, but it is contending with capital scarcity. Meanwhile, Brazil's Petrobras balances domestic demand coverage with volatility in currency and policy cycles, collectively steering the regional mosaic of the oil and gas downstream market.
- China Petroleum & Chemical Corp (Sinopec)
- Exxon Mobil Corporation
- Royal Dutch Shell plc
- Saudi Arabian Oil Company (Saudi Aramco)
- BP plc
- TotalEnergies SE
- China National Petroleum Corporation (CNPC)
- Reliance Industries Limited
- Indian Oil Corporation Limited
- Chevron Corporation
- Phillips 66 Company
- Marathon Petroleum Corporation
- Valero Energy Corporation
- Petroleo Brasileiro S.A. (Petrobras)
- ENI S.p.A.
- PTT Public Company Limited
- SK Innovation Co., Ltd.
- Kuwait Petroleum Corporation
- Lukoil PJSC
- OMV Group
Additional Benefits:
- The market estimate (ME) sheet in Excel format
- 3 months of analyst support
TABLE OF CONTENTS
1 Introduction
- 1.1 Study Assumptions & Market Definition
- 1.2 Scope of the Study
2 Research Methodology
3 Executive Summary
4 Market Landscape
- 4.1 Market Overview
- 4.2 Market Drivers
- 4.2.1 Surge in refining capacity (APAC & Middle East)
- 4.2.2 Booming petrochemical demand
- 4.2.3 Stricter IMO 2020 & sulfur fuel rules
- 4.2.4 Aviation-fuel rebound & SAF mandates
- 4.2.5 Digital-twin/AI OPEX optimization
- 4.2.6 Hydrogen co-product monetization
- 4.3 Market Restraints
- 4.3.1 EV penetration eroding gasoline demand
- 4.3.2 Net-zero policies curbing fossil fuels
- 4.3.3 Climate-risk-driven downtime & insurance
- 4.3.4 High interest rates limit new refineries
- 4.4 Supply-Chain Analysis
- 4.5 Regulatory Landscape
- 4.6 Technological Outlook
- 4.7 Refinery Throughput Capacity Analysis
- 4.8 Key Projects Information
- 4.9 Porter's Five Forces
- 4.9.1 Bargaining Power of Suppliers
- 4.9.2 Bargaining Power of Buyers
- 4.9.3 Threat of New Entrants
- 4.9.4 Threat of Substitutes
- 4.9.5 Intensity of Competitive Rivalry
- 4.10 PESTLE Analysis
5 Market Size & Growth Forecasts
- 5.1 By Type
- 5.1.1 Refineries
- 5.1.2 Petrochemical Plants
- 5.2 By Product Type
- 5.2.1 Refined Petroleum Products
- 5.2.2 Petrochemicals
- 5.2.3 Lubricants
- 5.3 By Distribution Channel
- 5.3.1 Direct Sales/Wholesale
- 5.3.2 Distributors/Commercial
- 5.3.3 Retail
- 5.4 By Geography
- 5.4.1 North America
- 5.4.1.1 United States
- 5.4.1.2 Canada
- 5.4.1.3 Mexico
- 5.4.2 Europe
- 5.4.2.1 Germany
- 5.4.2.2 United Kingdom
- 5.4.2.3 Norway
- 5.4.2.4 Netherlands
- 5.4.2.5 Russia
- 5.4.2.6 Rest of Europe
- 5.4.3 Asia-Pacific
- 5.4.3.1 China
- 5.4.3.2 India
- 5.4.3.3 Japan
- 5.4.3.4 South Korea
- 5.4.3.5 ASEAN Countries
- 5.4.3.6 Australia
- 5.4.3.7 Rest of Asia Pacific
- 5.4.4 South America
- 5.4.4.1 Brazil
- 5.4.4.2 Argentina
- 5.4.4.3 Colombia
- 5.4.4.4 Rest of South America
- 5.4.5 Middle East and Africa
- 5.4.5.1 Saudi Arabia
- 5.4.5.2 United Arab Emirates
- 5.4.5.3 Qatar
- 5.4.5.4 South Africa
- 5.4.5.5 Nigeria
- 5.4.5.6 Rest of Middle East and Africa
- 5.4.1 North America
6 Competitive Landscape
- 6.1 Market Concentration
- 6.2 Strategic Moves (M&A, Partnerships, PPAs)
- 6.3 Market Share Analysis (Market Rank/Share for key companies)
- 6.4 Company Profiles (includes Global level Overview, Market level overview, Core Segments, Financials as available, Strategic Information, Products & Services, and Recent Developments)
- 6.4.1 China Petroleum & Chemical Corp (Sinopec)
- 6.4.2 Exxon Mobil Corporation
- 6.4.3 Royal Dutch Shell plc
- 6.4.4 Saudi Arabian Oil Company (Saudi Aramco)
- 6.4.5 BP plc
- 6.4.6 TotalEnergies SE
- 6.4.7 China National Petroleum Corporation (CNPC)
- 6.4.8 Reliance Industries Limited
- 6.4.9 Indian Oil Corporation Limited
- 6.4.10 Chevron Corporation
- 6.4.11 Phillips 66 Company
- 6.4.12 Marathon Petroleum Corporation
- 6.4.13 Valero Energy Corporation
- 6.4.14 Petroleo Brasileiro S.A. (Petrobras)
- 6.4.15 ENI S.p.A.
- 6.4.16 PTT Public Company Limited
- 6.4.17 SK Innovation Co., Ltd.
- 6.4.18 Kuwait Petroleum Corporation
- 6.4.19 Lukoil PJSC
- 6.4.20 OMV Group
7 Market Opportunities & Future Outlook
- 7.1 White-space & Unmet-need Assessment

 2026-2030年石油天然氣幕後市場
 東南亞下游油氣市場:市場佔有率分析、產業趨勢與統計及成長預測(2026-2031年)美國下游油氣加工製程:市場佔有率分析、產業趨勢與統計、成長預測(2026-2031)印度油氣下游產業:市場佔有率分析、產業趨勢與統計及成長預測(2026-2031年)泰國下游油氣市場:市場佔有率分析、產業趨勢與統計及成長預測(2026-2031年)印尼下游油氣市場:市場佔有率分析、產業趨勢與統計及成長預測(2026-2031年)
 2026年全球下游石油產品市場報告
 油氣下游市場-全球產業規模、佔有率、趨勢、機會和預測,按類型(煉油廠、石化廠)、地區和競爭格局分類,2020-2030年預測
 全球下游石油與天然氣市場南美石油天然氣下游:市場佔有率分析、產業趨勢、統計、成長趨勢預測(2025-2030)