


 |
市場調查報告書
商品編碼
2113380
印度油氣下游產業:市場佔有率分析、產業趨勢與統計及成長預測(2026-2031年)India Oil And Gas Downstream - Market Share Analysis, Industry Trends & Statistics, Growth Forecasts (2026 - 2031) |
||||||

※ 本網頁內容可能與最新版本有所差異。詳細情況請與我們聯繫。
根據 Mordor Intelligence 估計,印度石油和天然氣下游市場規模在 2025 年為 51.1 億美元,預計到 2031 年將從 2026 年的 53.6 億美元成長至 68.1 億美元,在預測期(2026-2031 年)內的複合年成長率為 4.89%。
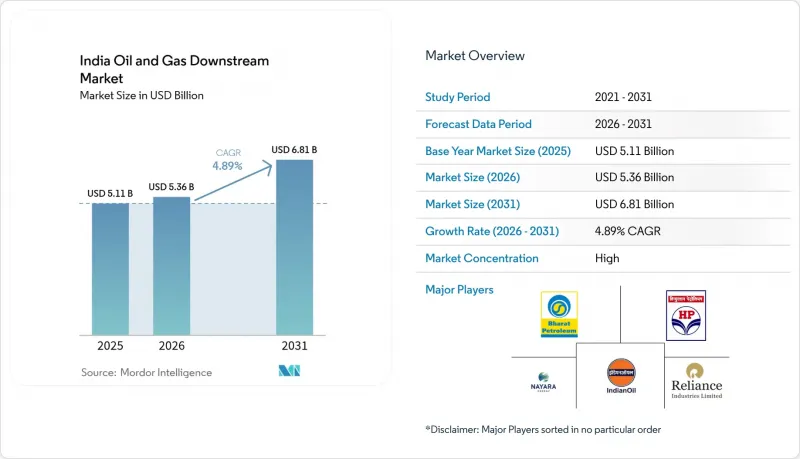
本報告按類型(煉油廠、石化廠)、產品類型(成品油、石化產品、潤滑油)和分銷管道(直銷/批發、分銷商/商業、零售)進行細分。市場規模和預測均以美元計價。
印度油氣下游市場的趨勢與洞察
中產階級對燃料的需求增加
二、三線城市的汽車保有量正以每年12%的速度成長,超過了成長已趨於平緩的大都會圈,從而在印度下游油氣市場形成了分散的需求基礎。印度石油公司計畫瞄準這些成長點,到2026年在農村地區新建5,000家零售據點。中產階級的購買力也正在推動高階潤滑油和特殊產品的消費,進而提升零售商的單位利潤率。航空渦輪燃料的需求也反映了這一趨勢,預計到2030年客運量將加倍,這將進一步支撐噴射機燃料的裂解利潤率。這些趨勢共同增強了煉油商和經銷商的獲利前景,並推動了對倉儲、物流和客戶服務技術的新投資。
為符合印度第六階段排放標準而進行的資本投資
整個產業已投入超過150億美元的資本用於升級加氫設備、催化重整裝置和調合系統,以符合BS-VI硫排放標準。光是印度斯坦石油公司位於維沙卡帕特南的煉油廠就投資了12億美元,率先完成升級改造,並獲得了資金以擴大其在印度下游油氣市場的產能。目前,領先企業正在國內銷售優質BS-VI燃料,並出口到硫排放標準嚴格的市場,從而提高了煉油利潤率。同時,規模較小的煉油企業面臨資金籌措緊張的局面,正在考慮透過合資和併購來分攤合規成本。因此,這項監管里程碑正在加速產業重組和技術應用。
資本投資過剩和延誤
新計畫和擴建計畫面臨許多問題,平均延誤18至24個月,成本超支高達40%,令印度油氣下游市場的資產負債表承壓,並阻礙了預期產能成長。環境許可核准、土地徵用糾紛以及技術純熟勞工短缺正成為主要瓶頸。例如,印度石油公司(Bharat Petroleum)的維納(Veena)擴建計畫已延長30個月,成本飆升至41億美元,並導致預期內部殖利率(IRR)下降。每次延期都會增加資金籌措成本,限制股利分配的柔軟性,並促使董事會採取更保守的投資策略,選擇資產規模較小的夥伴關係。
細分市場分析
到2025年,煉油廠將佔印度下游油氣市場的65.12%,體現了印度政府長期以來對透過進口替代煉油廠來保障能源安全的重視。光是賈姆訥格爾煉油廠的日加工量就超過130萬桶,鞏固了印度作為石油產品淨出口國的地位。該領域將受益於對住宅維修的額外投資,這將提高柴油和噴射機燃料的產量,並支持對歐洲和非洲的盈利出口。同時,儘管規模較小,但預計到2031年,石化工廠的複合年成長率將達到7.22%,成為印度下游油氣市場中成長最快的領域。
向一體化O2C(油化工)聯合裝置的轉型使營運商能夠根據利潤率趨勢靈活地在燃料和化學品生產之間切換原料分配。 ONGC Petro Additions Limited的達赫茲聯合裝置就是這種柔軟性的一個典型例子,它將煉油廠的石腦油重新分配到聚合物生產線,與簡單的餾分相比,聚合物生產線具有更高的利潤率。在石油和爆炸物安全組織(PESO)框架下進行的技術升級正在提高製程安全性,並進一步增強投資者對現有煉油廠附近新創工廠的信心。
其他好處:
- Excel格式的市場預測(ME)表
- 3個月的分析師支持
目錄
第1章:引言
- 研究假設和市場定義
- 調查範圍
第2章:調查方法
第3章執行摘要
第4章 市場狀況
- 市場概覽
- 市場促進因素
- 中產階級不斷成長的燃料需求
- 為支持印度第六階段交通運輸計畫而進行的資本投資
- 對石化產品的需求不斷成長
- 促進氫氣與生質燃料的混合
- 最佳化數位化煉油廠的營運成本
- 航空旅行需求的復甦
- 市場限制因素
- 資本投資過剩和延誤
- 保證金波動率與原油價格的關係
- ESG/淨零資本外逃
- 電動車的普及給汽油需求帶來了壓力。
- 供應鏈分析
- 監理情勢
- 技術展望
- 淨化能力分析
- 波特五力模型
- PESTLE分析
第5章 市場規模與成長預測
- 按類型
- 煉油廠
- 石化廠
- 依產品類型
- 石油精煉產品
- 石油化學產品
- 潤滑劑
- 透過分銷管道
- 直銷/批發
- 銷售代理商/商業
- 零售
第6章 競爭情勢
- 市場集中度
- 策略趨勢(併購、聯盟、購電協議)
- 市場佔有率分析(主要公司的市場排名和佔有率)
- 公司簡介
- Indian Oil Corporation Ltd
- Bharat Petroleum Corporation Ltd
- Hindustan Petroleum Corporation Ltd
- Reliance Industries Ltd
- Nayara Energy Ltd
- Mangalore Refinery & Petrochemicals Ltd
- Chennai Petroleum Corporation Ltd
- GAIL(India)Ltd
- Oil & Natural Gas Corporation
- Petronet LNG Ltd
- Indian Strategic Petroleum Reserves Ltd
- HPCL-Mittal Energy Ltd(HMEL)
- ONGC Petro additions Ltd(OPaL)
- Numaligarh Refinery Ltd
- Assam Petrochemicals Ltd
- Bharat Oman Refineries Ltd
- Adani Total Gas Ltd
- Ineos Styrolution India Ltd
- Haldia Petrochemicals Ltd
- Nayara Energy-Vadinar Refinery
第7章 市場機會與未來展望
According to Mordor Intelligence, the India oil and gas downstream market size was valued at USD 5.11 billion in 2025 and estimated to grow from USD 5.36 billion in 2026 to reach USD 6.81 billion by 2031, at a CAGR of 4.89% during the forecast period (2026-2031).
This report is Segmented by Type (Refineries and Petrochemical Plants), Product Type (Refined Petroleum Products, Petrochemicals, and Lubricants), and Distribution Channel (Direct Sales/Wholesale, Distributors/Commercial, and Retail). The Market Sizes and Forecasts are Provided in Terms of Value (USD).
India Oil And Gas Downstream Market Trends and Insights
Rising Middle-Class Fuel Demand
Vehicle ownership in Tier-2 and Tier-3 cities is increasing at a rate of 12% annually, outpacing the plateauing metros and creating dispersed demand nodes across the India oil and gas downstream market. Indian Oil Corporation plans to establish 5,000 new rural retail outlets by 2026, targeting these growth centers. Middle-class purchasing power is also driving the consumption of premium lubricants and specialty products, thereby boosting per-unit margins for retailers. Aviation turbine-fuel demand mirrors this trend as passenger numbers are set to double by 2030, further underpinning jet-fuel cracks. Together, these dynamics strengthen revenue visibility for refiners and marketers, supporting fresh investments in storage, logistics, and customer-facing technologies.
Bharat Stage-VI Compliance Capex
Sector-wide capex topping USD 15 billion has upgraded hydrotreaters, catalytic reformers, and blending systems to comply with BS-VI sulfur limits. Hindustan Petroleum's Vizag refinery alone invested USD 1.2 billion, completing upgrades ahead of peers and freeing funds for capacity growth in the India oil and gas downstream market. Early movers now sell premium BS-VI fuels domestically and export to sulfur-stringent markets, widening gross-refining margins. Smaller refiners face a capital-access squeeze and are considering joint ventures or mergers to dilute compliance costs. The regulatory milestone consequently accelerates industry consolidation and the diffusion of technology.
Capex Overruns & Delays
Project delays averaging 18-24 months and cost overruns up to 40% plague greenfield and expansion schemes, straining balance sheets and diluting forecast capacity additions in the India oil and gas downstream market. Environmental clearances, land acquisition disputes, and skilled labor shortages emerge as the primary bottlenecks. Bharat Petroleum's Bina expansion, for instance, slipped 30 months and ballooned to USD 4.1 billion, eroding IRR assumptions. Financing costs rise with each schedule slippage, curtailing dividend flexibility and nudging boards toward more conservative investment pacing or asset-light partnerships.
Other drivers and restraints analyzed in the detailed report include:
- Hydrogen & Bio-Fuels Blending Push
- Digital Refinery OPEX Optimization
- Margin Volatility vs. Crude Prices
For complete list of drivers and restraints, kindly check the Table Of Contents.
Segment Analysis
Refineries account for 65.12% of India's oil and gas downstream market share in 2025, reflecting the long-standing government emphasis on energy security through import-substitution refining. Jamnagar alone processes more than 1.3 million barrels per day, underpinning India's status as a net product exporter. This segment benefits from additional residential upgrading investments that increase diesel and jet-fuel yields and support lucrative exports to Europe and Africa. However, petrochemical plants-though smaller in base-are set to log a 7.22% CAGR to 2031, driving the fastest volumetric expansion across the India oil and gas downstream market.
The push toward integrated O2C complexes allows operators to toggle feedstocks between fuels and chemicals based on margin signals. ONGC Petro Additions Limited's Dahej complex exemplifies such flexibility, channeling refinery naphtha into polymer chains that command higher spreads compared to simple distillates. Technology upgrades under the Petroleum and Explosives Safety Organisation framework improve process safety, further strengthening investor confidence in new chemical units adjacent to legacy refineries.
Complete Report Scope:
- By Type
- Refineries
- Petrochemical Plants
- By Product Type
- Refined Petroleum Products
- Petrochemicals
- Lubricants
- By Distribution Channel
- Direct Sales/Wholesale
- Distributors/Commercial
- Retail
List of Companies Covered in this Report:
- Indian Oil Corporation Ltd
- Bharat Petroleum Corporation Ltd
- Hindustan Petroleum Corporation Ltd
- Reliance Industries Ltd
- Nayara Energy Ltd
- Mangalore Refinery & Petrochemicals Ltd
- Chennai Petroleum Corporation Ltd
- GAIL (India) Ltd
- Oil & Natural Gas Corporation
- Petronet LNG Ltd
- Indian Strategic Petroleum Reserves Ltd
- HPCL-Mittal Energy Ltd (HMEL)
- ONGC Petro additions Ltd (OPaL)
- Numaligarh Refinery Ltd
- Assam Petrochemicals Ltd
- Bharat Oman Refineries Ltd
- Adani Total Gas Ltd
- Ineos Styrolution India Ltd
- Haldia Petrochemicals Ltd
- Nayara Energy - Vadinar Refinery
Additional Benefits:
- The market estimate (ME) sheet in Excel format
- 3 months of analyst support
TABLE OF CONTENTS
1 Introduction
- 1.1 Study Assumptions & Market Definition
- 1.2 Scope of the Study
2 Research Methodology
3 Executive Summary
4 Market Landscape
- 4.1 Market Overview
- 4.2 Market Drivers
- 4.2.1 Rising middle-class fuel demand
- 4.2.2 Bharat Stage-VI compliance capex
- 4.2.3 Petrochemicals demand growth
- 4.2.4 Hydrogen & bio-fuels blending push
- 4.2.5 Digital refinery OPEX optimisation
- 4.2.6 Aviation traffic rebound
- 4.3 Market Restraints
- 4.3.1 Capex overruns & delays
- 4.3.2 Margin volatility vs crude prices
- 4.3.3 ESG / net-zero capital flight
- 4.3.4 EV adoption biting gasoline demand
- 4.4 Supply-Chain Analysis
- 4.5 Regulatory Landscape
- 4.6 Technological Outlook
- 4.7 Refining Capacity Analysis
- 4.8 Porter's Five Forces
- 4.8.1 Threat of New Entrants
- 4.8.2 Bargaining Power of Suppliers
- 4.8.3 Bargaining Power of Buyers
- 4.8.4 Threat of Substitutes
- 4.8.5 Competitive Rivalry
- 4.9 PESTLE Analysis
5 Market Size & Growth Forecasts
- 5.1 By Type
- 5.1.1 Refineries
- 5.1.2 Petrochemical Plants
- 5.2 By Product Type
- 5.2.1 Refined Petroleum Products
- 5.2.2 Petrochemicals
- 5.2.3 Lubricants
- 5.3 By Distribution Channel
- 5.3.1 Direct Sales/Wholesale
- 5.3.2 Distributors/Commercial
- 5.3.3 Retail
6 Competitive Landscape
- 6.1 Market Concentration
- 6.2 Strategic Moves (M&A, Partnerships, PPAs)
- 6.3 Market Share Analysis (Market Rank/Share for key companies)
- 6.4 Company Profiles (includes Global level Overview, Market level overview, Core Segments, Financials as available, Strategic Information, Products & Services, and Recent Developments)
- 6.4.1 Indian Oil Corporation Ltd
- 6.4.2 Bharat Petroleum Corporation Ltd
- 6.4.3 Hindustan Petroleum Corporation Ltd
- 6.4.4 Reliance Industries Ltd
- 6.4.5 Nayara Energy Ltd
- 6.4.6 Mangalore Refinery & Petrochemicals Ltd
- 6.4.7 Chennai Petroleum Corporation Ltd
- 6.4.8 GAIL (India) Ltd
- 6.4.9 Oil & Natural Gas Corporation
- 6.4.10 Petronet LNG Ltd
- 6.4.11 Indian Strategic Petroleum Reserves Ltd
- 6.4.12 HPCL-Mittal Energy Ltd (HMEL)
- 6.4.13 ONGC Petro additions Ltd (OPaL)
- 6.4.14 Numaligarh Refinery Ltd
- 6.4.15 Assam Petrochemicals Ltd
- 6.4.16 Bharat Oman Refineries Ltd
- 6.4.17 Adani Total Gas Ltd
- 6.4.18 Ineos Styrolution India Ltd
- 6.4.19 Haldia Petrochemicals Ltd
- 6.4.20 Nayara Energy - Vadinar Refinery
7 Market Opportunities & Future Outlook
- 7.1 White-space & Unmet-Need Assessment

 2026-2030年石油天然氣幕後市場
 石油天然氣產業下游領域:市場佔有率分析、產業趨勢與統計資料、成長預測(2026-2031 年)東南亞下游油氣市場:市場佔有率分析、產業趨勢與統計及成長預測(2026-2031年)美國下游油氣加工製程:市場佔有率分析、產業趨勢與統計、成長預測(2026-2031)泰國下游油氣市場:市場佔有率分析、產業趨勢與統計及成長預測(2026-2031年)印尼下游油氣市場:市場佔有率分析、產業趨勢與統計及成長預測(2026-2031年)
 2026年全球下游石油產品市場報告
 油氣下游市場-全球產業規模、佔有率、趨勢、機會和預測,按類型(煉油廠、石化廠)、地區和競爭格局分類,2020-2030年預測
 全球下游石油與天然氣市場南美石油天然氣下游:市場佔有率分析、產業趨勢、統計、成長趨勢預測(2025-2030)