


 |
市場調查報告書
商品編碼
2113705
東南亞下游油氣市場:市場佔有率分析、產業趨勢與統計及成長預測(2026-2031年)Southeast Asia Oil And Gas Downstream - Market Share Analysis, Industry Trends & Statistics, Growth Forecasts (2026 - 2031) |
||||||

※ 本網頁內容可能與最新版本有所差異。詳細情況請與我們聯繫。
根據 Mordor Intelligence 預測,東南亞下游油氣市場規模預計將從 2025 年的 61.5 億美元成長到 2026 年的 64.4 億美元,然後從 2026 年到 2031 年以 4.7% 的複合年成長率成長,到 2031 年達到 81 億美元。
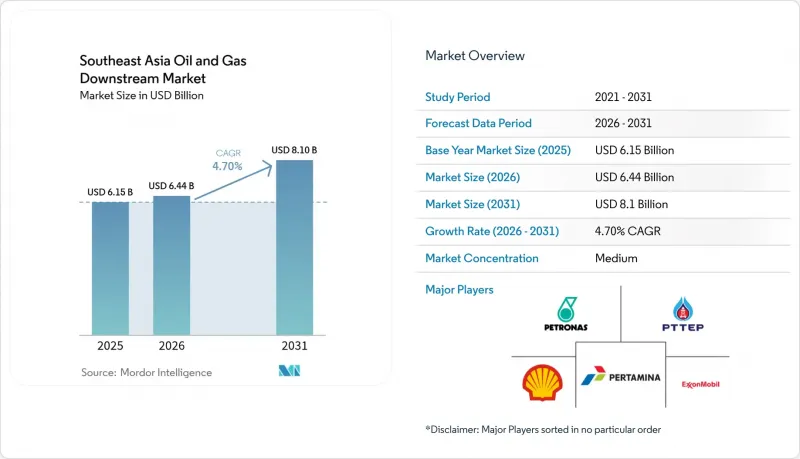
本報告按類型(煉油廠和石化廠)、產品類型(精煉石油產品、石化產品、潤滑油)、分銷管道(直銷/批發、分銷商/商業、零售)和地區(印尼、馬來西亞、泰國、越南、菲律賓、新加坡、緬甸和其他東南亞國家)進行分類。
東南亞下游油氣市場趨勢與洞察
新冠疫情蔓延後,區域噴射機燃料需求迅速復甦
東協地區的航空旅行需求已大幅復甦,預計到2024年,新加坡樟宜機場的噴射機燃料出貨量將達到820萬噸,比2019年的基準值增加15%。吉隆坡和素萬那普國際機場的需求也出現類似成長,促使煉油廠進行配置調整,以提高噴射機燃料的產量。亞洲航空和新加坡航空等航空公司在恢復飛機運轉率的同時,也拓展了區域航線。這需要多站點的燃油物流,對綜合供應合約產生了穩定的需求。配備先進加氫處理系統的煉油廠能夠確保獲得認證航空燃油的溢價,從而增強東南亞下游油氣市場的利潤率穩定性。明確的需求前景正在推動對餾分選擇性設備的投資,這些設備可以根據季節性裂解價差在噴射機燃料和柴油生產之間切換。此外,需求的可預測性有助於下游業者協商長期的非採購協議,並為新綜合項目的資產負債表規劃奠定基礎。
碳定價機制的區域整合正在推進。
新加坡計劃於2024年將碳排放稅提高至每噸25新元,並逐步提高至2030年的每噸80新元。泰國的試點交易計畫和印尼2025年的稅收架構都體現了這項舉措。二氧化碳成本的差異促使營運商採用廢氣捕集、熱整合維修和燃燒後捕集技術,從而降低單位排放量並創造可交易的碳權額度以抵消遵循成本。吉隆坡和新加坡的金融中心正在促進跨境碳權市場的發展,並幫助擁有跨國業務的營運商最佳化投資組合。結合碳捕集和氫能反應器的工廠正在為即將到來的全球客戶對範圍3排放的審查做好準備。一些先行者已經通過與要求檢驗減排量的跨國物流公司簽訂的高級契約,從低碳柴油和船用燃料油混合物中獲得收益。總體而言,碳定價的協調統一提供了「獎勵」和「懲罰」獎勵,加速了東南亞下游油氣市場的技術採用。
由於EPC供應鏈的收緊,資本投資成本正在飆升。
2022年至2024年間,鋼鐵和特殊合金價格飆升40%,大直徑反應器的交付週期延長至24個月,導致加氫裂解裝置和乙烯裂解裝置的支出增加。三星工程和現代工程報告稱,邊佳蘭和巴厘巴板專案的採購出現延誤,迫使專案進度調整,並降低了專案的淨現值。目前的資金籌措結構納入了更大的緊急資金和與通膨掛鉤的價格上漲條款,使信貸委員會的核准流程更加複雜。雖然擁有強大供應商合作關係和模組化建設計畫的營運商能夠部分抵消成本飆升的影響,但小規模的營運商面臨較高的進入門檻。持續存在的瓶頸可能會延緩產能擴張計劃,並減緩東南亞下游油氣市場的短期供應成長。
細分市場分析
儘管煉油廠在2025年佔東南亞下游油氣市場銷售額的65.74%,但預計到2031年,石化工廠將成為東南亞下游油氣市場成長最快的產業,複合年成長率(CAGR)將達到6.02%。煉油業利用規模經濟、沿海物流以及可隨時加工原油的配置,根據價差波動在「甜原油」和「酸原油」之間切換。光是新加坡的綜合叢集每天就能加工150萬桶原油,並透過管道向東協各地的出口管道供應原油。然而,汽油需求持續面臨風險,這促使營運商擴大蒸汽裂解裝置並提取芳烴化合物,從而實現石腦油的經濟效益。
透過將增加的石腦油產量轉化為乙烯衍生物產業鏈,石化產品的整合提高了每桶原油的總利潤率。馬來西亞的RAPID綜合體正是這種轉型的體現,它透過實施一體化廢氣回收和共用汽電共生降低了單位成本。泰國的瑪塔普(Map Ta Phut)擴建計畫則為汽車零件供應商生產特殊彈性體和特殊烯烴,從而增強了非燃料領域的價值創造。這種模式最大限度地降低了受汽車燃料市場波動的影響,並確保了資產基礎在東南亞下游油氣市場電氣化和脫碳化帶來的不利影響下的未來生存能力。
其他好處:
- Excel格式的市場預測(ME)表
- 3個月的分析師支持
目錄
第1章:引言
- 研究假設和市場定義
- 調查範圍
第2章:調查方法
第3章執行摘要
第4章 市場狀況
- 市場概覽
- 市場促進因素
- 新冠疫情後,區域噴射機燃料需求迅速復甦
- 碳定價體系區域一體化進展
- 依IMO 2020擴大燃油供應基地
- 主流燃油品質改善(歐盟V標準)
- 現有煉油廠的石化業務整合正在加速進行中。
- 透過人工智慧驅動的預測性維護降低營運成本。
- 市場限制因素
- 由於EPC供應鏈收緊,資本成本飆升。
- 電動車的日益普及抑制了汽油需求。
- 嚴格的綠色債券分類標準限制了對石化燃料的資金籌措。
- 複雜檢修工程中技術純熟勞工短缺
- 供應鏈分析
- 監理情勢
- 技術展望
- 淨化能力分析
- 波特五力模型
第5章 市場規模與成長預測
- 按行業
- 煉油廠
- 石化廠
- 依產品類型
- 石油精煉產品
- 石油化學產品
- 潤滑劑
- 透過分銷管道
- 直銷/批發
- 銷售代理商/商業
- 零售
- 按地區
- 印尼
- 馬來西亞
- 泰國
- 越南
- 菲律賓
- 新加坡
- 緬甸
- 其他東南亞國家
第6章 競爭情勢
- 市場集中度
- 策略趨勢(併購、聯盟、購電協議)
- 市場佔有率分析(主要公司的市場排名和佔有率)
- 公司簡介
- Shell plc
- PTT Public Company Ltd
- PT Pertamina
- Petroliam Nasional Berhad(PETRONAS)
- Exxon Mobil Corp
- Vietnam Oil & Gas Group(PetroVietnam)
- Perusahaan Gas Negara Tbk
- Chevron Corporation
- TotalEnergies SE
- SK Energy
- Hyundai Engineering Co.
- Bangchak Corp
- IRPC Public Co.
- Hengyi Industries Sdn Bhd
- Pilipinas Shell Petroleum Corp
- Thai Oil Public Co.
- PT Chandra Asri Petrochemical Tbk
- Petron Corp
- Brunei Shell Petroleum
- Idemitsu Kosan(Vietnam JV)
第7章 市場機會與未來展望
According to Mordor Intelligence, the southeast asia oil and gas downstream market size is expected to grow from USD 6.15 billion in 2025 to USD 6.44 billion in 2026 and is forecast to reach USD 8.1 billion by 2031 at 4.7% CAGR over 2026-2031.
This report is Segmented by Type (Refineries and Petrochemical Plants), Product Type (Refined Petroleum Products, Petrochemicals, and Lubricants), Distribution Channel (Direct Sales/Wholesale, Distributors/Commercial, and Retail), and Geography (Indonesia, Malaysia, Thailand, Vietnam, Philippines, Singapore, Myanmar, and Rest of Southeast Asia).
Southeast Asia Oil And Gas Downstream Market Trends and Insights
Rapid Recovery of Regional Jet-Fuel Demand Post-COVID
Aviation traffic across ASEAN rebounded sharply, pushing 2024 jet-fuel liftings at Singapore Changi to 8.2 million t, 15% above the 2019 baseline. Parallel upticks at Kuala Lumpur International and Suvarnabhumi airports were sufficient to justify refinery configuration shifts toward higher jet-fuel yields. Airlines such as AirAsia and Singapore Airlines restored fleet utilization while expanding secondary-city routes, which require multi-node fuel logistics and create stable pull-through for integrated supply contracts. Refineries equipped with advanced hydro-treaters capture premium spreads on certified aviation fuel, thereby reinforcing the margin resilience of the Southeast Asia oil and gas downstream market. Demand visibility encourages capital outlays for distillate-selective units that can toggle between jet fuel and diesel depending on seasonal crack spreads. Predictable volume signals also help downstream operators negotiate long-term offtake agreements that underpin balance-sheet planning across new integration projects.
Rising Regional Integration of Carbon-Pricing Schemes
Singapore lifted its carbon levy to SGD 25 t-CO2 in 2024 and will incrementally raise it to SGD 80 by 2030, a move mirrored by Thailand's pilot trading system and Indonesia's 2025 tax framework. Differentiated CO2 costs prompt operators to deploy flare-gas recovery, heat-integration retrofits, and post-combustion capture, thereby reducing unit emissions and creating tradable credits that offset compliance expenses. Financial centers in Kuala Lumpur and Singapore facilitate cross-border credit markets, enabling portfolio optimization for multi-country operators. Plants that couple carbon capture with hydrogen-ready furnaces position themselves for the looming scrutiny of global customers on Scope 3 emissions. Early adopters already monetize lower-carbon diesel and bunker blends through premium contracts with multinational logistics firms seeking verifiable emission reductions. Collectively, carbon-pricing harmonization supplies both carrot and stick incentives that accelerate technology uptake within the Southeast Asia oil and gas downstream market.
High Capital-Cost Escalations Amid EPC Supply-Chain Crunch
Steel and specialty-alloy prices surged 40% between 2022 and 2024, while delivery lead times for large-bore reactors stretched to 24 months, inflating outlays on hydrocrackers and ethylene crackers. Samsung Engineering and Hyundai Engineering reported procurement delays on Pengerang and Balikpapan units, forcing schedule re-baselines and eroding project net present values. Financing structures now incorporate larger contingency cushions and index-linked escalation clauses, adding complexity to credit-committee approvals. Operators with robust supplier alliances and modular construction plans partially offset cost blowouts, but smaller players confront prohibitive entry barriers. Persistent bottlenecks threaten to defer capacity-addition timelines, softening near-term supply growth in the Southeast Asia oil and gas downstream market.
Other drivers and restraints analyzed in the detailed report include:
- Expansion of IMO 2020-Compliant Bunkering Hubs
- Accelerated Petrochemical Integration at Existing Refineries
- Growing EV Penetration Suppressing Gasoline Demand
For complete list of drivers and restraints, kindly check the Table Of Contents.
Segment Analysis
Refineries commanded 65.74% of 2025 revenue, but petrochemical units are expected to deliver the Southeast Asia oil and gas downstream market's fastest 6.02% CAGR through 2031. The refinery cohort leverages economies of scale, coastal logistics, and crude-flex configurations that can shift from sweet to sour slates as price spreads fluctuate. Singapore's integrated cluster alone processes 1.5 million bpd and feeds export pipelines across ASEAN. Nevertheless, the sustained risk of gasoline demand propels operators toward steam-cracker add-ons and aromatics extraction, which monetizes competitive naphtha economics.
Petrochemical integration increases the overall margin per barrel by converting incremental naphtha into ethylene-based derivative chains. Malaysia's RAPID complex embodies this shift, deploying unified off-gas recovery and shared cogeneration to lower unit costs. Thailand's Map Ta Phut expansion packages niche elastomers and specialty olefins for automotive component suppliers, reinforcing non-fuel value capture. The approach minimises exposure to motor-fuel cycling, future-proofing asset bases against electrification and decarbonization headwinds across the Southeast Asia oil and gas downstream market.
Complete Report Scope:
- By Sector
- Refineries
- Petrochemical Plants
- By Product Type
- Refined Petroleum Products
- Petrochemicals
- Lubricants
- By Distribution Channel
- Direct Sales/Wholesale
- Distributors/Commercial
- Retail
- By Geography
- Indonesia
- Malaysia
- Thailand
- Vietnam
- Philippines
- Singapore
- Myanmar
- Rest of Southeast Asia
List of Companies Covered in this Report:
- Shell plc
- PTT Public Company Ltd
- PT Pertamina
- Petroliam Nasional Berhad (PETRONAS)
- Exxon Mobil Corp
- Vietnam Oil & Gas Group (PetroVietnam)
- Perusahaan Gas Negara Tbk
- Chevron Corporation
- TotalEnergies SE
- SK Energy
- Hyundai Engineering Co.
- Bangchak Corp
- IRPC Public Co.
- Hengyi Industries Sdn Bhd
- Pilipinas Shell Petroleum Corp
- Thai Oil Public Co.
- PT Chandra Asri Petrochemical Tbk
- Petron Corp
- Brunei Shell Petroleum
- Idemitsu Kosan (Vietnam JV)
Additional Benefits:
- The market estimate (ME) sheet in Excel format
- 3 months of analyst support
TABLE OF CONTENTS
1 Introduction
- 1.1 Study Assumptions & Market Definition
- 1.2 Scope of the Study
2 Research Methodology
3 Executive Summary
4 Market Landscape
- 4.1 Market Overview
- 4.2 Market Drivers
- 4.2.1 Rapid recovery of regional jet-fuel demand post-COVID
- 4.2.2 Rising regional integration of carbon-pricing schemes
- 4.2.3 Expansion of IMO 2020-compliant bunkering hubs
- 4.2.4 Mainstream fuel-quality upgrades (Euro-V standards)
- 4.2.5 Accelerated petrochemical integration at existing refineries
- 4.2.6 AI-driven predictive maintenance reducing OPEX
- 4.3 Market Restraints
- 4.3.1 High capital cost escalations amid EPC supply-chain crunch
- 4.3.2 Growing EV penetration suppressing gasoline demand
- 4.3.3 Stringent green-bond taxonomy limiting fossil-fuel financing
- 4.3.4 Skilled-labor shortages for complex turnaround projects
- 4.4 Supply-Chain Analysis
- 4.5 Regulatory Landscape
- 4.6 Technological Outlook
- 4.7 Refining Capacity Analysis
- 4.8 Porter's Five Forces
- 4.8.1 Bargaining Power of Suppliers
- 4.8.2 Bargaining Power of Buyers
- 4.8.3 Threat of New Entrants
- 4.8.4 Threat of Substitutes
- 4.8.5 Industry Rivalry
5 Market Size & Growth Forecasts
- 5.1 By Sector
- 5.1.1 Refineries
- 5.1.2 Petrochemical Plants
- 5.2 By Product Type
- 5.2.1 Refined Petroleum Products
- 5.2.2 Petrochemicals
- 5.2.3 Lubricants
- 5.3 By Distribution Channel
- 5.3.1 Direct Sales/Wholesale
- 5.3.2 Distributors/Commercial
- 5.3.3 Retail
- 5.4 By Geography
- 5.4.1 Indonesia
- 5.4.2 Malaysia
- 5.4.3 Thailand
- 5.4.4 Vietnam
- 5.4.5 Philippines
- 5.4.6 Singapore
- 5.4.7 Myanmar
- 5.4.8 Rest of Southeast Asia
6 Competitive Landscape
- 6.1 Market Concentration
- 6.2 Strategic Moves (M&A, Partnerships, PPAs)
- 6.3 Market Share Analysis (Market Rank/Share for key companies)
- 6.4 Company Profiles (includes Global level Overview, Market level overview, Core Segments, Financials as available, Strategic Information, Products & Services, and Recent Developments)
- 6.4.1 Shell plc
- 6.4.2 PTT Public Company Ltd
- 6.4.3 PT Pertamina
- 6.4.4 Petroliam Nasional Berhad (PETRONAS)
- 6.4.5 Exxon Mobil Corp
- 6.4.6 Vietnam Oil & Gas Group (PetroVietnam)
- 6.4.7 Perusahaan Gas Negara Tbk
- 6.4.8 Chevron Corporation
- 6.4.9 TotalEnergies SE
- 6.4.10 SK Energy
- 6.4.11 Hyundai Engineering Co.
- 6.4.12 Bangchak Corp
- 6.4.13 IRPC Public Co.
- 6.4.14 Hengyi Industries Sdn Bhd
- 6.4.15 Pilipinas Shell Petroleum Corp
- 6.4.16 Thai Oil Public Co.
- 6.4.17 PT Chandra Asri Petrochemical Tbk
- 6.4.18 Petron Corp
- 6.4.19 Brunei Shell Petroleum
- 6.4.20 Idemitsu Kosan (Vietnam JV)
7 Market Opportunities & Future Outlook
- 7.1 White-space & Unmet-Need Assessment

 2026-2030年石油天然氣幕後市場
 石油天然氣產業下游領域:市場佔有率分析、產業趨勢與統計資料、成長預測(2026-2031 年)美國下游油氣加工製程:市場佔有率分析、產業趨勢與統計、成長預測(2026-2031)印度油氣下游產業:市場佔有率分析、產業趨勢與統計及成長預測(2026-2031年)泰國下游油氣市場:市場佔有率分析、產業趨勢與統計及成長預測(2026-2031年)印尼下游油氣市場:市場佔有率分析、產業趨勢與統計及成長預測(2026-2031年)
 2026年全球下游石油產品市場報告
 油氣下游市場-全球產業規模、佔有率、趨勢、機會和預測,按類型(煉油廠、石化廠)、地區和競爭格局分類,2020-2030年預測
 全球下游石油與天然氣市場南美石油天然氣下游:市場佔有率分析、產業趨勢、統計、成長趨勢預測(2025-2030)