

 |
市場調查報告書
商品編碼
2113193
印尼下游油氣市場:市場佔有率分析、產業趨勢與統計及成長預測(2026-2031年)Indonesia Oil And Gas Downstream - Market Share Analysis, Industry Trends & Statistics, Growth Forecasts (2026 - 2031) |
||||||

※ 本網頁內容可能與最新版本有所差異。詳細情況請與我們聯繫。
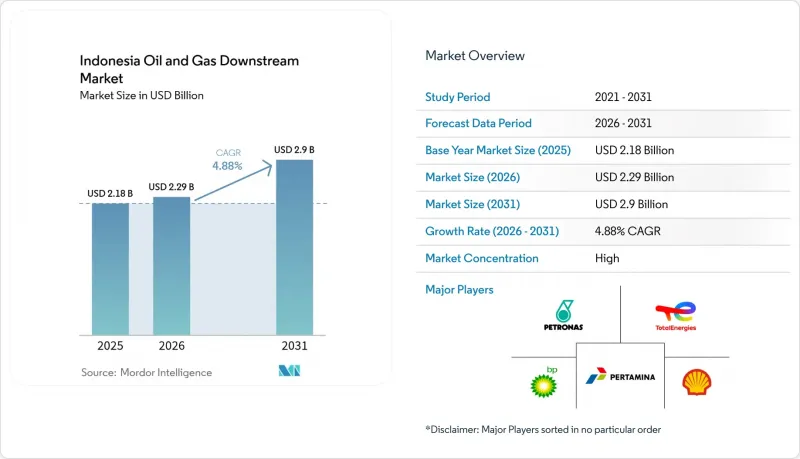
根據 Mordor Intelligence 估計,到 2026 年,印尼下游油氣市場規模將達到 22.9 億美元,高於 2025 年的 21.8 億美元,預計到 2031 年將達到 29 億美元。
預計從 2026 年到 2031 年,其複合年成長率將達到 4.88%。
本報告按類型(煉油廠和石化廠)、產品類型(成品油、石化產品、潤滑油)和分銷管道(直銷/批發、分銷商/商業、零售)進行細分。市場規模和預測以美元計價。
印尼油氣下游市場趨勢及洞察。
政府努力擴大國內煉油產能
印尼正計劃將16個地點的產能翻番,從每日50萬桶增至每日100萬桶,打造區域樞紐,從而降低物流成本並加強能源安全。目前已完成91%的巴厘巴板維修項目,清楚展現了為達到歐4排放標準所需的先進技術和巨額資本投入。這種分散式產能的開發也符合印尼旨在將增值點從原料出口轉向成品油的產業政策。成功的關鍵在於確保原油供應穩定,並培養能夠操作先進加氫設備的專業人員。透過該計劃,印尼將降低對進口的依賴,同時為未來石化產業的一體化做好準備。
交通運輸和工業部門國內燃料需求增加
GDP成長和都市化加速了車輛數量、航空運輸量和工廠產量的成長,這加劇了本地供給能力的緊張,並推高了進口成本。基礎設施建設,例如新收費公路和工業園區,進一步加劇了該地區的燃料需求。航線的擴張增加了對噴射機燃料的需求,這需要更先進的煉油設施來滿足。儘管原油價格波動,但持續的需求維持了投資者的信心,同時也增加了原油價格受外部衝擊的影響。
石化燃料資產面臨的環境與脫碳壓力
印尼「2060年淨零排放」的承諾將導致更嚴格的排放法規和潛在的碳定價機制,這將推高營運成本。全球金融機構正在應用環境、社會和治理(ESG)標準,並限制對傳統電廠的融資,除非這些電廠配備碳捕集模組。漫長的核准週期和來自民間社會的審查可能會阻礙新建設,隨著更清潔的替代能源的擴張,人們對擱淺資產的擔憂也日益加劇。業者必須謹慎權衡短期需求與長期氣候變遷責任。
細分市場分析
煉油廠仍是印尼下游油氣市場的核心組成部分,預計到2025年將佔據印尼下游油氣市場63.32%的佔有率。這得歸功於政府旨在將國內加工能力翻倍的計畫。隨著巴厘巴板和圖班煉油廠的投產,預計到2031年,印尼下游油氣市場中煉油廠所佔的佔有率將穩定成長。然而,由於環境合規成本上升和區域競爭加劇,利潤率面臨壓力。在全球規模綜合設施的支持下,石化工廠預計將實現6.55%的複合年成長率,反映出價值重心正向高利潤率的化學產品轉移。國際巨頭提供先進的工藝技術和資金,而本土企業則提供監管方面的專業知識和本地物流服務。
這種一體化趨勢模糊了煉油廠和化工生產之間的界限,並實現了原料的聯合最佳化和規模經濟。一體化工廠能夠確保裂解裝置所需的石腦油供應,並提高整體運轉率。然而,由於高技能工程師傾向於移居海外,人才引進仍然是一項挑戰,因此聯合培訓計畫正在開發中。雖然政府監管能夠確保安全和環境績效,但各州的監管執法力度有差異。
其他好處:
- Excel格式的市場預測(ME)表
- 3個月的分析師支持
目錄
第1章:引言
- 研究假設和市場定義
- 調查範圍
第2章:調查方法
第3章執行摘要
第4章 市場狀況
- 市場概覽
- 市場促進因素
- 政府努力擴大國內煉油產能
- 交通運輸和工業部門國內燃料需求增加
- 全球石化綜合體投資激增。
- 強制實施B35生物柴油摻混
- 強制性的歐4硫含量法規正在加速煉油設備的現代化。
- 機場網路的擴張正在促進噴射機燃料價值鏈相關項目的發展。
- 市場限制因素
- 石化燃料資產面臨的環境與脫碳壓力
- 大型企劃長期延誤及成本超支
- 下游高技能技術人員短缺
- 新加坡和馬來西亞樞紐之間的競爭給利潤率帶來了壓力。
- 供應鏈分析
- 監理情勢
- 技術展望
- 淨化能力分析
- 波特五力模型
- PESTLE分析
第5章 市場規模與成長預測
- 按類型
- 煉油廠
- 石化廠
- 依產品類型
- 石油精煉產品
- 石油化學產品
- 潤滑劑
- 透過分銷管道
- 直銷/批發
- 銷售代理商/商業
- 零售
第6章 競爭情勢
- 市場集中度
- 策略趨勢(併購、聯盟、購電協議)
- 市場佔有率分析(主要公司的市場排名和佔有率)
- 公司簡介
- PT Pertamina(Persero)
- PT Kilang Pertamina Internasional
- PT Perusahaan Gas Negara Tbk
- PT Chandra Asri Petrochemical Tbk
- TotalEnergies SE
- Shell plc
- Chevron Corporation
- Exxon Mobil Corporation
- BP plc
- Eni SpA
- PETRONAS
- Sinopec(China Petroleum & Chemical Corp.)
- China National Petroleum Corp.
- PT Trans-Pacific Petrochemical Indotama
- Lotte Chemical Titan
- PT Pupuk Kalimantan Timur
- ConocoPhillips
- PT Medco Energi Internasional Tbk
- Korea National Oil Corp.
- PT Badak NGL
第7章 市場機會與未來展望
According to Mordor Intelligence, Indonesia oil and gas downstream market size in 2026 is estimated at USD 2.29 billion, growing from 2025 value of USD 2.18 billion with 2031 projections showing USD 2.9 billion, growing at 4.88% CAGR over 2026-2031.
This report is Segmented by Type (Refineries and Petrochemical Plants), Product Type (Refined Petroleum Products, Petrochemicals, and Lubricants), and Distribution Channel (Direct Sales/Wholesale, Distributors/Commercial, and Retail). The Market Sizes and Forecasts are Provided in Terms of Value (USD).
Indonesia Oil And Gas Downstream Market Trends and Insights
Government Push to Expand Domestic Refining Capacity
Indonesia doubled its planned additions from 500,000 to 1 million barrels per day across 16 sites, creating regional hubs that cut logistics costs and lift energy security. Balikpapan's upgrade, now 91% complete, illustrates the technical depth and capital outlay required for Euro-4 fuel compliance. Distributed capacity also aligns with the industrial policy that shifts value from raw exports to processed fuels. Success hinges on securing crude supplies and training personnel capable of operating advanced hydrotreaters. The program positions Indonesia to reduce import dependence while supporting future petrochemical integration.
Rising Domestic Fuel Demand from Transport & Industry
GDP growth and urbanization accelerate vehicle ownership, aviation traffic, and factory output, stretching local supply and raising import bills. Infrastructure, such as new toll roads and industrial estates, deepens regional fuel demand. Aviation route expansion increases jet-fuel needs, which require higher-spec refiners. Sustained demand gives investors confidence despite crude price swings, yet it magnifies exposure to external oil-price shocks.
Environmental and Decarbonization Pressures on Fossil Assets
Indonesia's Net Zero 2060 pledge attracts stricter emission rules and potential carbon pricing that inflate operating costs. Global lenders deploy ESG filters, limiting finance for traditional plants unless carbon-capture modules are integrated. Extended permitting and civil-society scrutiny can hold back new builds, raising the specter of stranded assets as cleaner energy alternatives scale up. Operators must weigh near-term demand against long-run climate liabilities.
Other drivers and restraints analyzed in the detailed report include:
- Surge in Investments for World-Scale Petrochemical Complexes
- Implementation of B35-to-B40 Biodiesel Mandate
- Chronic Delays and Cost Overruns in Refinery Megaprojects
For complete list of drivers and restraints, kindly check the Table Of Contents.
Segment Analysis
Refineries remained the backbone, with a 63.32% share of Indonesia's oil and gas downstream market in 2025, underpinned by government programs aimed at doubling national throughput. The Indonesian oil and gas downstream market size attributed to refineries is forecast to expand steadily through 2031 as Balikpapan and Tuban come online. Margins, however, face pressure from higher environmental compliance costs and tighter regional competition. Petrochemical plants, aided by world-scale complexes, are projected to record a 6.55% CAGR, reflecting shifting value toward higher-margin chemicals. International majors supply advanced process technology and capital, while domestic firms provide regulatory insight and local logistics.
The integration trend blurs the boundaries between refinery and chemical operations, allowing for shared feedstock optimization and an economy of scope. Combined sites capture naphtha streams for cracker units, improving overall utilization. Workforce challenges persist, as high-skill engineers often migrate abroad, prompting the development of joint training programs. Government oversight ensures safety and environmental performance, though enforcement consistency varies across provinces.
Complete Report Scope:
- By Type
- Refineries
- Petrochemical Plants
- By Product Type
- Refined Petroleum Products
- Petrochemicals
- Lubricants
- By Distribution Channel
- Direct Sales/Wholesale
- Distributors/Commercial
- Retail
List of Companies Covered in this Report:
- PT Pertamina (Persero)
- PT Kilang Pertamina Internasional
- PT Perusahaan Gas Negara Tbk
- PT Chandra Asri Petrochemical Tbk
- TotalEnergies SE
- Shell plc
- Chevron Corporation
- Exxon Mobil Corporation
- BP plc
- Eni S.p.A.
- PETRONAS
- Sinopec (China Petroleum & Chemical Corp.)
- China National Petroleum Corp.
- PT Trans-Pacific Petrochemical Indotama
- Lotte Chemical Titan
- PT Pupuk Kalimantan Timur
- ConocoPhillips
- PT Medco Energi Internasional Tbk
- Korea National Oil Corp.
- PT Badak NGL
Additional Benefits:
- The market estimate (ME) sheet in Excel format
- 3 months of analyst support
TABLE OF CONTENTS
1 Introduction
- 1.1 Study Assumptions & Market Definition
- 1.2 Scope of the Study
2 Research Methodology
3 Executive Summary
4 Market Landscape
- 4.1 Market Overview
- 4.2 Market Drivers
- 4.2.1 Government push to expand domestic refining capacity
- 4.2.2 Rising domestic fuel demand from transport & industry
- 4.2.3 Surge in investments for world-scale petrochemical complexes
- 4.2.4 Implementation of B35 biodiesel blending mandate
- 4.2.5 Mandatory Euro-4 sulfur limits driving refinery upgrades
- 4.2.6 Airport network expansion spurring jet-fuel value-chain projects
- 4.3 Market Restraints
- 4.3.1 Environmental & decarbonization pressures on fossil assets
- 4.3.2 Chronic delays & cost overruns in refinery megaprojects
- 4.3.3 Shortage of advanced downstream technical workforce
- 4.3.4 Margin squeeze from Singapore/Malaysia hub competition
- 4.4 Supply-Chain Analysis
- 4.5 Regulatory Landscape
- 4.6 Technological Outlook
- 4.7 Refining Capacity Analysis
- 4.8 Porter's Five Forces
- 4.8.1 Threat of New Entrants
- 4.8.2 Bargaining Power of Suppliers
- 4.8.3 Bargaining Power of Buyers
- 4.8.4 Threat of Substitutes
- 4.8.5 Competitive Rivalry
- 4.9 PESTLE Analysis
5 Market Size & Growth Forecasts
- 5.1 By Type
- 5.1.1 Refineries
- 5.1.2 Petrochemical Plants
- 5.2 By Product Type
- 5.2.1 Refined Petroleum Products
- 5.2.2 Petrochemicals
- 5.2.3 Lubricants
- 5.3 By Distribution Channel
- 5.3.1 Direct Sales/Wholesale
- 5.3.2 Distributors/Commercial
- 5.3.3 Retail
6 Competitive Landscape
- 6.1 Market Concentration
- 6.2 Strategic Moves (M&A, Partnerships, PPAs)
- 6.3 Market Share Analysis (Market Rank/Share for key companies)
- 6.4 Company Profiles (includes Global level Overview, Market level overview, Core Segments, Financials as available, Strategic Information, Products & Services, and Recent Developments)
- 6.4.1 PT Pertamina (Persero)
- 6.4.2 PT Kilang Pertamina Internasional
- 6.4.3 PT Perusahaan Gas Negara Tbk
- 6.4.4 PT Chandra Asri Petrochemical Tbk
- 6.4.5 TotalEnergies SE
- 6.4.6 Shell plc
- 6.4.7 Chevron Corporation
- 6.4.8 Exxon Mobil Corporation
- 6.4.9 BP plc
- 6.4.10 Eni S.p.A.
- 6.4.11 PETRONAS
- 6.4.12 Sinopec (China Petroleum & Chemical Corp.)
- 6.4.13 China National Petroleum Corp.
- 6.4.14 PT Trans-Pacific Petrochemical Indotama
- 6.4.15 Lotte Chemical Titan
- 6.4.16 PT Pupuk Kalimantan Timur
- 6.4.17 ConocoPhillips
- 6.4.18 PT Medco Energi Internasional Tbk
- 6.4.19 Korea National Oil Corp.
- 6.4.20 PT Badak NGL
7 Market Opportunities & Future Outlook
- 7.1 White-space & Unmet-need Assessment

 2026-2030年石油天然氣幕後市場
 2026年全球下游石油產品市場報告
 油氣下游市場-全球產業規模、佔有率、趨勢、機會和預測,按類型(煉油廠、石化廠)、地區和競爭格局分類,2020-2030年預測
 全球下游石油與天然氣市場
 南美石油天然氣下游:市場佔有率分析、產業趨勢、統計、成長趨勢預測(2025-2030)泰國石油和天然氣下游市場 -市場佔有率分析、行業趨勢、成長預測(2025-2030)石油和天然氣下游 -市場佔有率分析、行業趨勢、統計、成長預測(2025-2030)美國石油和天然氣下游 -市場佔有率分析、行業趨勢、成長預測(2025-2030)