


 |
市場調查報告書
商品編碼
2123456
廣告服務:市場佔有率分析、產業趨勢與統計、成長預測(2026-2031)Advertising Services - Market Share Analysis, Industry Trends & Statistics, Growth Forecasts (2026 - 2031) |
||||||

※ 本網頁內容可能與最新版本有所差異。詳細情況請與我們聯繫。
根據 Mordor Intelligence 預測,廣告服務市場規模將從 2025 年的 1.03 兆美元成長到 2026 年的 1.23 兆美元,到 2031 年將達到 2.33 兆美元,2026 年至 2031 年的複合年成長率為 13.63%。
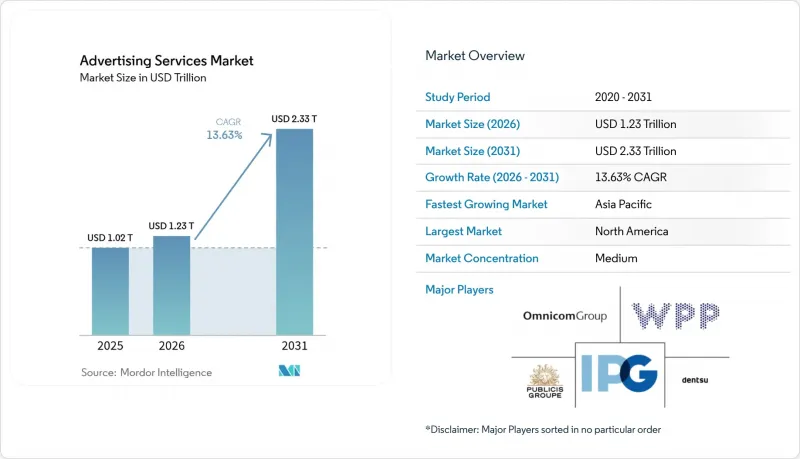
本報告按平台(線上和線下)、廣告管道(社交媒體廣告、搜尋引擎廣告、展示廣告和線上影片廣告等)、終端用戶行業(零售、電子商務和DTC品牌等)、代理商類型(全方位整合代理商、媒體採購和策劃代理商等)以及地區進行細分。市場預測以美元(USD)為單位。
全球廣告服務市場趨勢與洞察
行動優先的程式化影片廣告的興起
預計到2026年,程式化影片收入將超過2,000億美元,到2025年,超過90%的連網電視廣告曝光量將透過程式化方式進行交易。雖然行動裝置約佔程式化展示廣告支出的70%,但目前的成長主要集中在零售商店和公共交通的影片廣告位上。根據Place Exchange預測,到2024年下半年,可用螢幕數量將增加25%。同期,數位戶外廣告(DOOH)的平均每千次展示成本(CPM)從7.16美元上漲至7.62美元,顯示廣告主願意為與內容相關的影片廣告位付費。 2024年,美國數位影片廣告收入將達到621億美元,較去年同期成長19.2%,進一步鞏固了視訊格式的成長動能。隨著品牌尋求跨螢幕的可衡量覆蓋範圍,廣告服務市場正受益於平均媒體價格的上漲和更全面的歸因數據。 ISO/IEC 23009-1 等 MPEG-DASH 標準確保內容互通性,並進一步促進其在全球市場的大規模應用。
不斷擴展的社交電商和網紅生態系統
預計2025年,網紅行銷支出將年增14.2%,超過整體數位廣告的成長速度。 ShopMy在2024年12月融資7,750萬美元,估值達4.1億美元,新增550多位品牌用戶。 Whalar Group在2025年5月成功資金籌措4億美元,顯示企業對創作者電商基礎設施的濃厚興趣。在英國,社交電商銷售額預計到2026年將達到68億英鎊,約佔電商總額的3%。德勤建議品牌整合產品目錄和原生結帳功能,將社群媒體上的靈感轉化為實際交易。隨著廣告預算從以提升品牌知名度為主的管道轉向以電商為導向的廣告形式,這種購買流程的整合正在提升效果歸因的準確性,並擴大廣告服務市場。
數位廣告詐騙和無效流量問題日益嚴重
2023年,產業認證系統將詐欺性展示減少了92%,節省了108億美元,但廣告主仍因無效流量損失了9.79億美元。為了提高供應鏈透明度,買家正以2:1的比例將支出轉向私人市場而非公開交易平台。賣方審核機制可能導致收費系統不透明,因此廣告主需要仔細審核合作夥伴,避免過高的成本損害廣告支出回報率(ROAS)。 2024年,廣告科技產業的併購活動年增73%,風險更集中在少數平台。這些平台必須繼續投資於詐欺偵測模型。互動廣告局(IAB)和媒體評級委員會(MRC)的認證框架仍然是自願性的,這使得許多小規模發布商被排除在可信任生態系統之外。如果詐欺行為持續存在,廣告主將被迫提高每千次展示成本(CPM)以彌補潛在的浪費,這將導致預算浪費並減緩廣告服務市場的成長。
細分市場分析
到2025年,線上媒體將佔據廣告服務市場佔有率的61.73%,預計到2031年將以14.11%的複合年成長率成長,這主要得益於程序化自動化和零售媒體的蓬勃發展。線下管道對於品牌故事敘述仍然至關重要,但隨著廣告主轉向能夠將曝光量與轉換率掛鉤的可衡量廣告形式,其佔有率正在下降。連網電視和數位戶外(DOOH)廣告的影片庫存成長最快,因為買家現在可以利用以前僅限於網路的數據訊號。行動端仍佔程序化展示廣告支出的約70%,但當內容在客廳設備上播放時,更大的螢幕往往能提供更高的每千次展示成本(CPM)。庫存成本的上漲表明需求強勁,這支撐了廣告服務市場的整體收入成長動能。
線下媒體仍然支持著廣泛覆蓋的目標,尤其是在體育賽事直播和大規模文化活動期間,但年輕群體越來越傾向於串流媒體和社交媒體。紙媒和廣播在奢侈品和本地服務等高關注度細分市場中仍然佔有一席之地,但有限的衡量指標限制了它們獲得更廣泛的預算分配。廣告商現在正在整合QR碼和近距離通訊技術,以連接類比媒體和數位歸因,模糊管道之間的界線。數位廣告支出佔所有廣告支出的63%,預計到2027年將達到75%。這將彌合街頭曝光和線上轉換路徑之間的差距。 [2] 隨著全通路策略的成熟,廣告服務市場有望從跨螢幕頻次管理中受益,該技術可以減少浪費並提高廣告支出回報率(ROAS)。
到2025年,社群媒體廣告將佔據29.36%的市場佔有率,這反映了其規模、定向能力以及整合原生結帳流程的能力。同時,零售媒體預計將成為成長最快的領域,到2031年複合年成長率將達到13.73%,因為第一方消費者數據已被證明比第三方Cookie更具預測性。搜尋廣告仍是核心驅動力,2024年美國銷售額將達到1,029億美元,但由於生成式答案引擎的興起,預計未來點擊率(CTR)將會下降。展示廣告和線上影片廣告在2024年累計621億美元的銷售額,並在連網電視普及的背景下持續成長。隨著品牌尋求以更低的製作成本獲得真實同行的代言,網紅和創作者行銷正以14.2%的年成長率成長。
原生廣告、電視、廣播、平面媒體、戶外廣告和廣告信構成了廣告組合,它們通常起到催化劑的作用,在銷售漏斗的上游提升品牌知名度或推動高度本地化的轉換。程序化購買如今涵蓋了大部分展示廣告、影片和音訊廣告,使策劃人員能夠精細控制覆蓋範圍和頻次。零售媒體的閉合迴路報告功能正在吸引來自社群媒體、展示廣告和搜尋的預算,從而改變了傳統的管道層級結構。隨著電商網路的擴張,廣告主平均會將支出分散到五個或更多零售平台,加劇了廣告位的競爭。因此,由於支出增加以及與檢驗結果相關的成本上升,廣告服務市場正在擴張。
區域分析
到2025年,北美將佔全球收入的37.94%。這主要得益於美國網路廣告收入達到2,586億美元,以及零售媒體網路的強勁滲透(營收達537億美元)。加拿大的成長得益於連鎖超市和藥局推出廣告平台,而墨西哥則透過利用近岸外包吸引了跨國公司的廣告預算。亞太地區是成長最快的地區,複合年成長率達14.54%,這主要得益於印度20.2%的年成長率(141.7億美元)以及東南亞視訊電商佔比達到電子商務總額的25%。在中國,視訊電商規模已超過1,817億美元,數位普及率達86.1%,短影片和社群電商模式持續受到青睞。日本和澳洲的程序化廣告支出穩定成長,東南亞的零售媒體收入也接近30億美元,當地市場正利用支付數據來獲利。這些趨勢結合起來,正在推動新興經濟體和成熟經濟體的廣告服務市場擴張。
儘管監管摩擦不斷,歐洲仍佔相當大的佔有率。預計到2025年,英國零售媒體支出將超過66億英鎊,而創作者行銷收入預計到2030年將達到26億英鎊。德國、法國、義大利和西班牙仍然是主要的廣告買家,但語言多樣性和隱私法規正在推高營運成本。數位戶外廣告(DOOH)佔戶外廣告預算的63%,預計到2027年將達到75%,這表明市場對將線下場所與線上數據連接起來的螢幕廣告形式的需求持續存在。雖然地緣政治制裁導致廣告商撤出俄羅斯,但北歐和比荷盧經濟聯盟國家在寬頻普及率高的支持下呈現穩定成長。在南美洲,巴西龐大的社群媒體使用者群體正在吸引對平台的投資,而阿根廷的貨幣穩定則帶來了更穩定的媒體支出。中東和非洲地區的成長主要集中在沙烏地阿拉伯和阿拉伯聯合大公國的多元化發展計畫上,土耳其和南非也提供了進一步的推動力。
在每個地區,廣告支出都在轉向能夠保證可衡量回報的管道,儘管區域平台和監管存在差異,但媒體策略的全球融合正在加劇。亞太地區兩位數的成長動能抵消了歐洲成長放緩的影響,從而維持了整體廣告服務市場的平衡。跨國廣告商現在透過集中協商的框架分配預算,但創新會根據當地語言和文化差異進行調整。雖然外匯波動和隱私法規增加了實施的複雜性,但資料無塵室和使用者許可管理平台正在推動流程標準化。隨著零售媒體、程式化連網電視和生成式人工智慧在全球的普及,區域成長差距正在縮小,這為廣告服務市場中的市場佔有率擁有者提供了持續的收入成長支撐。
其他好處:
- Excel格式的市場預測(ME)表
- 3個月的分析師支持
目錄
第1章:引言
- 研究假設和市場定義
- 調查範圍
第2章:調查方法
第3章執行摘要
第4章 市場狀況
- 市場概覽
- 市場促進因素
- 行動優先的程式化影片廣告的興起
- 不斷擴展的社交電商和網紅生態系統
- 中小企業正在加快自助式數位平台轉型,以節省預算。
- 零售媒體網路利用其自身的購物者數據實現盈利
- 無 Cookie 識別解決方案正在加速第一方資料的使用。
- 透過使用人工智慧生成技術最佳化創新,可以縮短宣傳活動週期。
- 市場限制因素
- 數位廣告詐騙和無效流量問題日益嚴重
- 消費者擴大使用廣告攔截器以及廣告疲勞現像日益嚴重
- 加強全球隱私法規(GDPR、CPRA、PIPL)
- 全方位服務廣告公司資料分析師短缺
- 價值鏈分析
- 監理情勢
- 技術展望
- 波特五力分析
第5章 市場規模與成長預測
- 按平台
- 線上
- 離線
- 透過廣告管道
- 社群媒體傳播
- 搜尋引擎廣告
- 展示廣告和線上影片
- 影響者/創作者行銷
- 原生廣告
- 電視廣告
- 廣播廣告
- 印刷媒體
- 戶外廣告和交通廣告(OOH/DOOH)
- 廣告信
- 按最終用戶行業分類
- 零售(含食品雜貨)
- 電子商務與DTC品牌
- 觀光觀光
- 媒體與娛樂
- 金融服務
- 醫療和製藥
- 車
- 其他終端用戶產業
- 按機構類型分類
- 全方位整合廣告代理商
- 媒體採購與規劃機構
- 純數位表演機構
- 創新店
- 內部品牌工作室
- 按地區
- 北美洲
- 美國
- 加拿大
- 墨西哥
- 南美洲
- 巴西
- 阿根廷
- 其他南美國家
- 歐洲
- 德國
- 英國
- 法國
- 義大利
- 西班牙
- 俄羅斯
- 其他歐洲國家
- 亞太地區
- 中國
- 日本
- 印度
- 韓國
- 東南亞
- 其他亞太國家
- 中東和非洲
- 沙烏地阿拉伯
- 阿拉伯聯合大公國
- 土耳其
- 南非
- 其他中東和非洲國家
- 北美洲
第6章 競爭情勢
- 市場集中度
- 策略趨勢
- 市佔率分析
- 公司簡介
- WPP plc
- Omnicom Group Inc.
- The Interpublic Group of Companies Inc.
- Publicis Groupe SA
- Dentsu Group Inc.
- Havas SA
- Stagwell Inc.
- Accenture plc(Accenture Song)
- Hakuhodo DY Holdings Inc.
- Deloitte Touche Tohmatsu Ltd.(Deloitte Digital)
- PwC Advisory Services LLP(PwC Digital Services)
- Cognizant Technology Solutions Corp.(Cognizant Interactive)
- IBM Corp.(IBM iX)
- Salesforce Inc.(Marketing Cloud Services)
- Lamar Advertising Company
- JCDecaux SE
- Clear Channel Outdoor Holdings Inc.
- Fiverr International Ltd.
- S4 Capital plc(Media.Monks)
- Wieden+Kennedy Inc.
- Droga5 LLC
- Serviceplan Group SE and Co. KG
- MandC Saatchi plc
第7章 市場機會與未來展望
According to Mordor Intelligence, the advertising services market size is expected to grow from USD 1.03 trillion in 2025 to USD 1.23 trillion in 2026 and is forecast to reach USD 2.33 trillion by 2031 at a 13.63% CAGR over 2026-2031.
This report is Segmented by Platform (Online and Offline), Advertising Channel (Social-Media Publishing, Search-Engine Ads, Display and Online Video, and More), End-User Industry (Retail, Ecommerce and DTC Brands, and More), Agency Type (Full-Service Integrated Agency, Media-Buying and Planning Agency, and More), and Geography. The Market Forecasts are Provided in Terms of Value (USD).
Global Advertising Services Market Trends and Insights
Rise of Mobile-First Programmatic Video Advertising
Programmatic video revenue is projected to top USD 200 billion in 2026, and more than 90% of connected-television impressions already trade programmatically in 2025. Mobile devices account for about 70% of programmatic display spend, but growth now concentrates on video inventory inside retail and transit venues, where Place Exchange logged a 25% expansion in available screens during second-half 2024. Average digital-out-of-home CPMs climbed from USD 7.16 to USD 7.62 in the same period, signaling advertiser willingness to pay for contextually relevant video placements. United States digital-video revenue reached USD 62.1 billion in 2024, up 19.2% year-on-year, underscoring the momentum behind video formats. As brands pursue measurable reach across screens, the advertising services market benefits from higher average media prices and richer attribution data. Standards such as ISO/IEC 23009-1 for MPEG-DASH ensure content interoperability and further support scaled adoption across global market.
Expanding Social-Commerce and Influencer Ecosystems
Influencer marketing spend is growing 14.2% year-on-year in 2025, outpacing broader digital advertising categories. ShopMy raised USD 77.5 million in December 2024, boosting its valuation to USD 410 million and attracting more than 550 brand subscribers. Whalar Group secured funding at a USD 400 million valuation in May 2025, showing strong enterprise interest in creator-commerce infrastructure. In the United Kingdom, social commerce sales are forecast to reach GBP 6.8 billion by 2026, accounting for about 3% of total e-commerce. Deloitte advises brands to integrate product catalogs and native checkout to convert social inspiration into completed transactions. This buyer journey convergence strengthens performance attribution, elevating the advertising services market as budgets shift from awareness channels to commerce-linked formats.
Escalating Digital Ad-Fraud and Invalid Traffic
Industry certification reduced fraudulent impressions by 92% in 2023, saving USD 10.8 billion, yet advertisers still lost USD 979 million to invalid traffic. Buyers are shifting spend to private marketplaces at a two-to-one ratio versus open exchanges to secure greater supply-chain transparency. Sell-side curation can obscure fee structures, so advertisers must audit partners carefully to avoid inflated costs that erode return on ad spend. AdTech merger activity rose 73% year-on-year in 2024, concentrating risk on fewer platforms that require ongoing investment in fraud-detection models. Certification frameworks from the Interactive Advertising Bureau and the Media Rating Council remain voluntary, leaving many small publishers outside the trusted ecosystem. Continued fraud drains budgets and slows the advertising services market because advertisers pad CPMs to offset potential waste.
Other drivers and restraints analyzed in the detailed report include:
- Retail-Media Networks Monetising First-Party Shopper Data
- Generative-AI Creative Optimisation Cutting Campaign Cycle Times
- Stricter Global Privacy Regulations (GDPR, CPRA, PIPL)
For complete list of drivers and restraints, kindly check the Table Of Contents.
Segment Analysis
Online outlets held 61.73% of the advertising services market share in 2025 and are on track to expand at 14.11% CAGR through 2031, buoyed by programmatic automation and retail-media uptake. Offline channels remain relevant for brand storytelling, yet their proportional weight declines as advertisers pivot toward measurable formats that link impressions to conversions. Video inventory on connected television and digital out-of-home grows fastest because buyers can apply data signals historically limited to the web. Mobile continues to capture roughly 70% of programmatic display spend, although larger screens attract premium CPMs when content is streamed on living-room devices. Rising inventory costs signal stronger demand, which sustains revenue momentum for the overall advertising services market.
Offline media still supports mass-reach objectives, especially during live sports and cultural tent-pole events, but younger audiences gravitate toward streaming and social feeds. Print and radio defend high-intent niches such as luxury goods and local services, yet limited measurement hinders wider budget allocations. Advertisers now integrate QR codes and near-field technologies to bridge analog placements with digital attribution, blurring the channel divide. Digital out-of-home reaches 63% of all out-of-home spend and is projected to reach 75% by 2027, closing the gap between street-level exposure and online conversion paths.[2] As omni-channel strategies mature, the advertising services market size benefits from cross-screen frequency management that reduces waste and lifts return on ad spend.
Social-media publishing commanded 29.36% share in 2025, reflecting its ability to blend scale, targeting and native checkout flows. Retail media, however, posts the fastest growth at 13.73% CAGR to 2031 as first-party shopper data proves more predictive than third-party cookies. Search remains a cornerstone at USD 102.9 billion in United States revenue in 2024, yet generative answer engines are expected to dilute click-through rates over time. Display and online video earned USD 62.1 billion in 2024 and continue to advance on the back of connected-television adoption. Influencer and creator marketing grows 14.2% annually as brands seek authentic peer endorsement at lower production cost.
Native, television, radio, print, outdoor and direct mail round out the mix, often serving as either top-of-funnel awareness or hyper-local conversion triggers. Programmatic buying now covers most display, video and audio impressions, giving planners granular control over reach and frequency. Retail media's closed-loop reporting attracts budgets from social, display and search, changing the historical hierarchy among channels. As commerce networks proliferate, advertisers diversify spend across five or more retail platforms on average, intensifying competition for inventory. The advertising services market size therefore expands on both incremental spend and higher unit pricing tied to verified outcomes
Complete Report Scope:
- By Platform
- Online
- Offline
- By Advertising Channel
- Social-media publishing
- Search-engine ads
- Display and online video
- Influencer / creator marketing
- Native advertising
- TV spots
- Radio commercials
- Print media
- Outdoor and transit (OOH / DOOH)
- Direct mail
- By End-user Industry
- Retail (incl. grocery)
- Ecommerce and DTC brands
- Travel and tourism
- Media and entertainment
- Financial services
- Healthcare and pharma
- Automotive
- Other End-user Industries
- By Agency Type
- Full-service integrated agency
- Media-buying and planning agency
- Digital-only performance agency
- Creative boutique
- In-house brand studio
- By Geography
- North America
- United States
- Canada
- Mexico
- South America
- Brazil
- Argentina
- Rest of South America
- Europe
- Germany
- United Kingdom
- France
- Italy
- Spain
- Russia
- Rest of Europe
- Asia Pacific
- China
- Japan
- India
- South Korea
- Southeast Asia
- Rest of Asia Pacific
- Middle East and Africa
- Saudi Arabia
- United Arab Emirates
- Turkey
- South Africa
- Rest of Middle East
- North America
Geography Analysis
North America accounted for 37.94% of global revenue in 2025, lifted by the United States' internet advertising income of USD 258.6 billion and the strong adoption of retail-media networks that generated USD 53.7 billion. Canadian growth benefits from grocery and pharmacy chains launching ad platforms, while Mexico leverages near-shoring to attract multinational budgets. Asia Pacific is the fastest-growing territory at 14.54% CAGR, underpinned by India's 20.2% annual rise to USD 14.17 billion and Southeast Asia's video-commerce share reaching 25% of e-commerce value. China, already exceeding USD 181.7 billion with 86.1% digital penetration, continues to favor short-video and social commerce formats. Japan and Australia add stable programmatic spend, while Southeast Asian retail-media revenue nears USD 3 billion as local marketplaces monetize data at checkout. Collectively, these dynamics enlarge the advertising services market size across emerging and mature economies.
Europe contributes significant volume despite regulatory friction, with the United Kingdom's retail-media spend set to surpass GBP 6.6 billion in 2025 and creator-marketing revenue forecast to reach GBP 2.6 billion by 2030. Germany, France, Italy, and Spain remain large buyers, yet language fragmentation and privacy rules raise operating costs. Digital out-of-home claims 63% of outdoor budgets and is projected to hit 75% by 2027, indicating sustained appetite for screen-based formats that bridge offline venues and online data. Russia experiences advertiser pullback due to geopolitical sanctions, while the Nordics and Benelux post steady gains driven by high broadband penetration. South America rebounds as Brazil's sizable social audience draws platform investment and Argentina stabilizes currency fluctuations, encouraging more consistent media outlays. Middle East and Africa growth centers on Saudi Arabia and United Arab Emirates diversification plans, with Turkey and South Africa providing additional momentum.
Across regions, spending migrates toward channels that guarantee measurable return, reinforcing a global convergence in media strategy even as local platforms and regulations differ. Asia Pacific's double-digit trajectory offsets slower European expansion, balancing the overall advertising services market. Multinational advertisers now allot budgets through centrally negotiated frameworks but adapt creatives to local language and cultural nuance. Currency fluctuations and privacy mandates add execution complexity, yet data clean rooms and consent-management platforms help standardize processes. As retail-media, programmatic CTV and generative AI spread worldwide, geographic growth differentials narrow, supporting sustained top-line expansion for the advertising services market share holders.
- WPP plc
- Omnicom Group Inc.
- The Interpublic Group of Companies Inc.
- Publicis Groupe S.A.
- Dentsu Group Inc.
- Havas S.A.
- Stagwell Inc.
- Accenture plc (Accenture Song)
- Hakuhodo DY Holdings Inc.
- Deloitte Touche Tohmatsu Ltd. (Deloitte Digital)
- PwC Advisory Services LLP (PwC Digital Services)
- Cognizant Technology Solutions Corp. (Cognizant Interactive)
- IBM Corp. (IBM iX)
- Salesforce Inc. (Marketing Cloud Services)
- Lamar Advertising Company
- JCDecaux SE
- Clear Channel Outdoor Holdings Inc.
- Fiverr International Ltd.
- S4 Capital plc (Media.Monks)
- Wieden + Kennedy Inc.
- Droga5 LLC
- Serviceplan Group SE and Co. KG
- MandC Saatchi plc
Additional Benefits:
- The market estimate (ME) sheet in Excel format
- 3 months of analyst support
TABLE OF CONTENTS
1 INTRODUCTION
- 1.1 Study Assumptions and Market Definition
- 1.2 Scope of the Study
2 RESEARCH METHODOLOGY
3 EXECUTIVE SUMMARY
4 MARKET LANDSCAPE
- 4.1 Market Overview
- 4.2 Market Drivers
- 4.2.1 Rise of Mobile-first Programmatic Video Advertising
- 4.2.2 Expanding Social-commerce and Influencer Ecosystems
- 4.2.3 Accelerating Shift of SMB Budgets to Self-serve Digital Platforms
- 4.2.4 Retail-media Networks Monetising First-party Shopper Data
- 4.2.5 Cookieless Identity Solutions Boosting First-party Data Activation
- 4.2.6 Generative-AI Creative Optimisation Cutting Campaign Cycle Times
- 4.3 Market Restraints
- 4.3.1 Escalating Digital Ad-fraud and Invalid Traffic
- 4.3.2 Widespread Consumer Ad-blocking and Fatigue
- 4.3.3 Stricter Global Privacy Regulations (GDPR, CPRA, PIPL)
- 4.3.4 Data-analytics Talent Shortage Within Full-service Agencies
- 4.4 Value Chain Analysis
- 4.5 Regulatory Landscape
- 4.6 Technological Outlook
- 4.7 Porter's Five Forces Analysis
- 4.7.1 Threat of New Entrants
- 4.7.2 Bargaining Power of Buyers
- 4.7.3 Bargaining Power of Suppliers
- 4.7.4 Threat of Substitutes
- 4.7.5 Competitive Rivalry
5 MARKET SIZE AND GROWTH FORECASTS (VALUE)
- 5.1 By Platform
- 5.1.1 Online
- 5.1.2 Offline
- 5.2 By Advertising Channel
- 5.2.1 Social-media publishing
- 5.2.2 Search-engine ads
- 5.2.3 Display and online video
- 5.2.4 Influencer / creator marketing
- 5.2.5 Native advertising
- 5.2.6 TV spots
- 5.2.7 Radio commercials
- 5.2.8 Print media
- 5.2.9 Outdoor and transit (OOH / DOOH)
- 5.2.10 Direct mail
- 5.3 By End-user Industry
- 5.3.1 Retail (incl. grocery)
- 5.3.2 Ecommerce and DTC brands
- 5.3.3 Travel and tourism
- 5.3.4 Media and entertainment
- 5.3.5 Financial services
- 5.3.6 Healthcare and pharma
- 5.3.7 Automotive
- 5.3.8 Other End-user Industries
- 5.4 By Agency Type
- 5.4.1 Full-service integrated agency
- 5.4.2 Media-buying and planning agency
- 5.4.3 Digital-only performance agency
- 5.4.4 Creative boutique
- 5.4.5 In-house brand studio
- 5.5 By Geography
- 5.5.1 North America
- 5.5.1.1 United States
- 5.5.1.2 Canada
- 5.5.1.3 Mexico
- 5.5.2 South America
- 5.5.2.1 Brazil
- 5.5.2.2 Argentina
- 5.5.2.3 Rest of South America
- 5.5.3 Europe
- 5.5.3.1 Germany
- 5.5.3.2 United Kingdom
- 5.5.3.3 France
- 5.5.3.4 Italy
- 5.5.3.5 Spain
- 5.5.3.6 Russia
- 5.5.3.7 Rest of Europe
- 5.5.4 Asia Pacific
- 5.5.4.1 China
- 5.5.4.2 Japan
- 5.5.4.3 India
- 5.5.4.4 South Korea
- 5.5.4.5 Southeast Asia
- 5.5.4.6 Rest of Asia Pacific
- 5.5.5 Middle East and Africa
- 5.5.5.1 Saudi Arabia
- 5.5.5.2 United Arab Emirates
- 5.5.5.3 Turkey
- 5.5.5.4 South Africa
- 5.5.5.5 Rest of Middle East
- 5.5.1 North America
6 COMPETITIVE LANDSCAPE
- 6.1 Market Concentration
- 6.2 Strategic Moves
- 6.3 Market Share Analysis
- 6.4 Company Profiles (includes Global level Overview, Market level overview, Core Segments, Financials as available, Strategic Information, Market Rank / Share for key companies, Products and Services, and Recent Developments)
- 6.4.1 WPP plc
- 6.4.2 Omnicom Group Inc.
- 6.4.3 The Interpublic Group of Companies Inc.
- 6.4.4 Publicis Groupe S.A.
- 6.4.5 Dentsu Group Inc.
- 6.4.6 Havas S.A.
- 6.4.7 Stagwell Inc.
- 6.4.8 Accenture plc (Accenture Song)
- 6.4.9 Hakuhodo DY Holdings Inc.
- 6.4.10 Deloitte Touche Tohmatsu Ltd. (Deloitte Digital)
- 6.4.11 PwC Advisory Services LLP (PwC Digital Services)
- 6.4.12 Cognizant Technology Solutions Corp. (Cognizant Interactive)
- 6.4.13 IBM Corp. (IBM iX)
- 6.4.14 Salesforce Inc. (Marketing Cloud Services)
- 6.4.15 Lamar Advertising Company
- 6.4.16 JCDecaux SE
- 6.4.17 Clear Channel Outdoor Holdings Inc.
- 6.4.18 Fiverr International Ltd.
- 6.4.19 S4 Capital plc (Media.Monks)
- 6.4.20 Wieden + Kennedy Inc.
- 6.4.21 Droga5 LLC
- 6.4.22 Serviceplan Group SE and Co. KG
- 6.4.23 MandC Saatchi plc
7 MARKET OPPORTUNITIES AND FUTURE OUTLOOK
- 7.1 White-space and unmet-need assessment

 2026年全球履歷最佳化服務市場報告
 3D廣告看板市場:按顯示類型、格式、顯示技術、項目類型、應用程式和地區分類
 亞太地區視訊點播廣告:市場佔有率分析、產業趨勢與統計及成長預測(2026-2031 年)無 Cookie 廣告服務:市場佔有率分析、行業趨勢和統計數據以及成長預測(2026-2031 年)音訊廣告服務:市場佔有率分析、產業趨勢與統計、成長預測(2026-2031)點擊收費廣告服務:市場佔有率分析、行業趨勢和統計數據以及成長預測(2026-2031 年)
 線上分類廣告平台市場規模、佔有率和成長分析:按類型、投放類別、收入模式、平台、最終用戶和地區分類-2026-2033年產業預測互動式OTT廣告:市佔率分析、產業趨勢與統計、成長預測(2026-2031年)
 數位廣告平台市場:2026-2032年全球市場預測(依平台類型、設備類型、定價模式、資料來源、部署模式、組織規模、客戶群及最終用戶產業分類)
 基於位置的搜尋和廣告市場規模:按類型、應用程式、地區和預測分類。