


 |
市場調查報告書
商品編碼
2118038
互動式OTT廣告:市佔率分析、產業趨勢與統計、成長預測(2026-2031年)Interactive OTT Advertising - Market Share Analysis, Industry Trends & Statistics, Growth Forecasts (2026 - 2031) |
||||||

※ 本網頁內容可能與最新版本有所差異。詳細情況請與我們聯繫。
據 Mordor Intelligence 稱,2025 年互動式 OTT 廣告市場價值 51.4 億美元,預計從 2026 年到 2031 年將以 16.39% 的複合年成長率成長,到 2031 年達到 130.5 億美元。
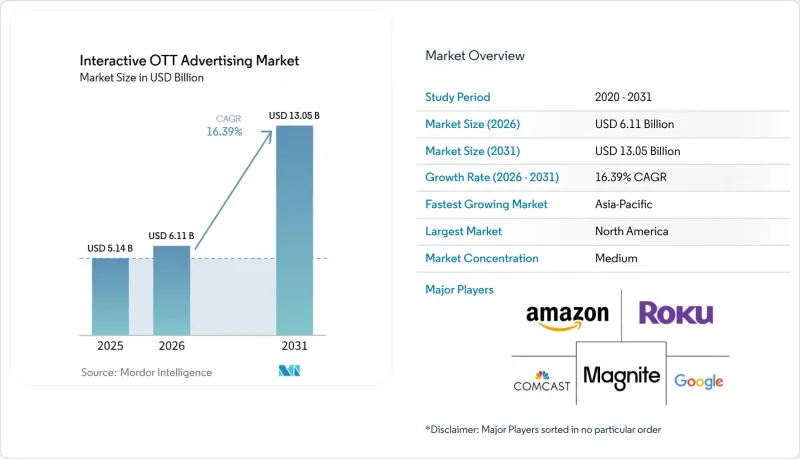
本報告按設備類型(智慧電視、智慧型手機和平板電腦、遊戲機、筆記型電腦和桌上型電腦、其他)、最終用戶(媒體和娛樂、零售和電子商務、汽車、銀行、金融服務和保險 (BFSI)、醫療保健、旅遊和酒店、其他)以及地區(北美、南美、歐洲、亞太、中東和非洲)進行細分。市場預測以美元 (USD) 為單位。
全球互動OTT廣告市場趨勢與洞察
觀看時間轉向連網電視和廣告支援的OTT平台
互動式OTT廣告市場背後的最大結構性因素是觀看時間正從傳統電視到連網串流平台持續轉移。根據IAB預測,到2026年,連網電視(CTV)廣告支出預計將成長13.8%,這意味著串流媒體將繼續引領整體廣告市場,並擴大互動廣告形式的市場空間。這項轉變意義重大,因為互動式OTT廣告市場依賴於一個消費者可以長時間停留在螢幕上、注意到提示、掃描2D碼並對疊加層做出反應的環境。隨著廣告收入計畫的擴展,擁有強大身分管理系統的優質發布商在定價權和買家信任方面佔據優勢。因此,市場成長不僅源自於串流媒體使用者數量的增加,也源自於串流內容的可商業性投放程度的提高。這一趨勢與目前正在改變全球影片貨幣化方式的更廣泛的串流轉型密切相關。
零售媒體數據影響OTT廣告購買。
零售媒體數據是影響互動式OTT廣告市場的最清晰的需求訊號之一。據NBC環球公司稱,零售媒體連網電視(CTV)廣告支出成長速度是零售媒體搜尋廣告的三倍,顯示商業數據正迅速轉向串流廣告。這種轉變增強了廣告主的信心,因為它比傳統的電視廣告策劃減少了猜測的空間,並允許他們將曝光與線上和線下行為聯繫起來。這種轉變也正在改變該管道的投資者群體。零售業以外的行業現在也可以採用同樣的閉合迴路邏輯,根據更清晰的結果來證明其影片廣告預算的合理性。這使得互動式OTT廣告市場對那些以前主要將串流媒體視為提升品牌知名度手段的、以結果為導向的買家更具吸引力。隨著這種模式的普及,互動式OTT廣告市場將受益於與推動零售媒體成為廣告優先考量相同的課責標準。
分散的跨平台指標
衡量指標的碎片化仍然是互動式OTT廣告市場面臨的最大障礙之一。這是因為廣告購買的複雜性發展速度超過了歸因分析的一致性。聯合行業委員會在其2025-2026年可交易性工作中證實,即使在新的廣告貨幣體系下,調查方法仍然不一致,這使得在沒有客製化數據安排的情況下難以實現統一的跨平台報告。此外,根據IAB的報告,72%的發布商認為技術複雜性是採用標準化CTV轉換API的障礙。這對廣告主來說是一個實際問題,因為平台特定的報告可能會高估單一平台的覆蓋範圍或掩蓋跨平台重疊。缺乏建構自身衡量系統技術資源的中型買家承受著最大的負擔。在這種情況改善之前,互動式OTT廣告市場將繼續遭受預算效率低下的問題,而這些問題是買家在更成熟的數位管道中很少遇到的,因為存在報告缺陷。
細分市場分析
預計到2025年,智慧電視將佔據互動式OTT廣告市場48.23%的佔有率,顯著超越其他設備。這項領先優勢反映出,在大螢幕上輕鬆的觀看環境中,廣告主有更多時間展示互動提示,而不會立即打斷用戶的觀看體驗。日本很好地詮釋了設備普及如何轉化為商業廣告空間。預計2025年,日本連網電視(CTV)市場規模將達到1,295億日圓(約8.64億美元),年增127%。智慧電視的普及也與「可購物式觀賞體驗」的轉變不謀而合,在這種體驗中,電視螢幕吸引觀眾的注意力,而配套設備則負責完成最終支付。因此,即使廣告商不斷嘗試新的平台,智慧電視仍然是互動式OTT廣告市場的基礎設備。
智慧型手機和平板電腦在互動式OTT廣告市場中仍然扮演著重要角色,但它們通常作為輔助工具來完成諸如掃描電視螢幕上的QR碼、將商品添加到購物車或進行支付等操作。筆記型電腦和桌上型電腦在互動式OTT廣告市場中也依然佔據重要地位,廣告商希望廣告內容能夠與基於情境的研究、在家工作時的串流媒體播放或B2B受眾行為等目標群體更加相關。預計到2031年,遊戲主機將以17.51%的複合年成長率成長,成為互動式OTT廣告市場中成長最快的設備類別。微軟廣告在一項研究中指出,遊戲廣告的完成率高達100%,而線上影片和社群媒體的完成率分別為86%和77%,這表明對於希望有效利用廣告空間的廣告商而言,遊戲廣告市場是一個利潤豐厚的領域。該研究還提到了全球遊戲用戶群的龐大規模以及用戶參與度與廣告投資之間的差距,解釋了為什麼主機廣告空間開始吸引更多標準化的獲利模式。隨著主機和遊戲內廣告形式的交易日益便捷,主機很可能在互動式OTT廣告市場中佔據更大的預算佔有率。雖然這種成長短期內不會取代智慧電視,但它將擴大互動式廣告能夠有效投放的高階螢幕範圍。
區域分析
預計到2031年,亞太地區將以17.24%的複合年成長率成長,成為互動式OTT廣告市場成長最快的地區。日本影片廣告市場總額預計在2025年達到8,855億日圓(59億美元),並在2026年達到1.1783兆日圓(79億美元),顯示該地區擁有強大的串流媒體變現基礎。 AVIA的一份報告也支持了這一區域趨勢,該報告預測,2025年至2030年,亞太地區螢幕產業的收入將以2.8%的複合年成長率成長,所有淨成長都將歸功於線上管道。線上主導的螢幕市場成長意義重大,因為它將為亞洲已開發國家和開發中國家的互動OTT廣告市場提供更廣泛的供應基礎。這也印證了亞太地區正在從互動OTT廣告市場的新興機會轉變為核心成長引擎的觀點。
到2025年,北美將成為最大的區域市場,佔互動式OTT廣告市場佔有率的43.58%。該地區受益於成熟的程序化生態系統、高聯網電視普及率以及強大的零售媒體基礎設施,這些優勢促進了用戶在串流媒體廣告領域的參與度。 2025年,亞馬遜廣告和Roku宣布合作,將在美國打造最大的認證連網電視網路。初步測試顯示,在預算不變的情況下,獨立觀眾數量增加了40%,廣告曝光頻率降低了近30%。加拿大作為注重廣告品質的買家也日益受到關注。 Pixalate發布的2025年第四季北美基準數據顯示,加拿大連網電視廣告供應中的無效流量比例低於美國。
歐洲在互動式OTT廣告市場佔有重要地位,其中英國和德國是關鍵的成長中心。根據Pixalate的報告,2026年第一季英國連網電視(CTV)的無效流量率達到46.1%,德國達到44%,這表明詐欺活動正在影響該地區一些較大市場的實際收入。這種情況促使買家從最廣泛的公開市場管道轉向優質的直接交易和精選的供應管道。法國、義大利、西班牙和其他歐洲國家不斷深化該地區的程式化OTT市場,而南美洲則受益於串流媒體較低的准入門檻,這使得觀眾更容易從傳統付費電視轉向串流媒體。在這兩個地區,互動式OTT廣告市場在數位影片消費成長速度超過傳統觀看模式的地區正蓬勃發展。
其他好處:
- Excel格式的市場預測(ME)表
- 3個月的分析師支持
目錄
第1章:引言
- 研究假設和市場定義
- 調查範圍
第2章:調查方法
第3章執行摘要
第4章 市場狀況
- 市場概覽
- 市場促進因素
- 轉向在連網電視和廣告支援的OTT平台上進行串流媒體時移播放
- 零售媒體數據正在影響OTT廣告購買。
- 程序化採購擴大了優質廣告資源的可用性。
- 可購買的互動廣告能夠提高轉換效率。
- 人工智慧驅動的情境定向技術減少了對第三方數據的依賴。
- 體育賽事和活動的直播拓寬了觀看時間的範圍。
- 市場限制因素
- 分散的跨平台指標
- 程序化OTT廣告供應中的廣告詐欺和無效流量
- 隱私法規限制了受眾細分。
- 加值內容和授權成本不斷上漲
- 產業價值鏈分析
- 監理情勢
- 技術展望
- 波特五力分析
- 宏觀經濟因素對市場的影響
第5章 市場規模與成長預測
- 依設備類型
- 智慧電視
- 智慧型手機和平板電腦
- 遊戲機
- 筆記型電腦和桌上型電腦
- 其他設備類型
- 最終用戶
- 媒體與娛樂
- 零售與電子商務
- 車
- BFSI
- 衛生保健
- 旅遊與飯店
- 其他最終用戶
- 按地區
- 北美洲
- 美國
- 加拿大
- 墨西哥
- 南美洲
- 巴西
- 阿根廷
- 智利
- 其他南美國家
- 歐洲
- 德國
- 英國
- 法國
- 義大利
- 西班牙
- 其他歐洲國家
- 亞太地區
- 中國
- 日本
- 印度
- 韓國
- 澳洲
- 其他亞太國家
- 中東
- 沙烏地阿拉伯
- 阿拉伯聯合大公國
- 卡達
- 其他中東國家
- 非洲
- 南非
- 埃及
- 奈及利亞
- 其他非洲國家
- 北美洲
第6章 競爭情勢
- 市場集中度
- 策略趨勢
- Vendor Positioning Analysis
- 公司簡介
- The Trade Desk, Inc.
- Roku, Inc.
- Amazon.com, Inc.
- Google LLC
- Comcast Corporation
- Magnite, Inc.
- Innovid Corp.
- PubMatic, Inc.
- Viant Technology Inc.
- Nexxen International Ltd.
- Samsung Electronics Co., Ltd.
- LG Electronics Inc.
- Fox Corporation
- Paramount Global
- The Walt Disney Company
- Netflix, Inc.
- Warner Bros. Discovery, Inc.
- Teads SA
- BrightLine, Inc.
第7章 市場機會與未來展望
According to Mordor Intelligence, the interactive OTT advertising market size was valued at USD 5.14 billion in 2025 and is forecast to reach USD 13.05 billion by 2031 at a CAGR of 16.39% from 2026 to 2031.
This report is Segmented by Device Type (Smart TVs, Smartphones and Tablets, Gaming Consoles, Laptops and Desktops, and More), End-User (Media and Entertainment, Retail and E-Commerce, Automotive, BFSI, Healthcare, Travel and Hospitality, and More), and Geography (North America, South America, Europe, Asia-Pacific, Middle East, and Africa). The Market Forecasts are Provided in Terms of Value (USD).
Global Interactive OTT Advertising Market Trends and Insights
Streaming Time Shift Toward CTV And Ad-Supported OTT
The largest structural force behind the interactive OTT advertising market is the continued shift in viewing time from linear television to connected streaming platforms. The IAB stated that CTV ad spend is expected to grow 13.8% in 2026, keeping streaming ahead of the broader advertising environment and expanding the inventory base for interactive formats. That change matters because the interactive OTT advertising market depends on environments where consumers stay on-screen long enough to notice prompts, scan codes, or respond to overlays. As more ad-supported plans gain scale, premium publishers with strong identity systems are better positioned to capture pricing power and buyer confidence. The result is a market that is growing not only because more people are streaming, but also because more of that streaming is becoming commercially addressable. This dynamic keeps the interactive OTT advertising market closely tied to the broader streaming migration, now reshaping video monetization worldwide.
Retail Media Data Spillover into OTT Buying
Retail media data has become one of the clearest demand signals shaping the interactive OTT advertising market. NBCUniversal reported that retail media CTV ad spend is growing 3x faster than retail media search, which shows how quickly commerce data is moving into streaming activation. That change gives advertisers more confidence because exposure can be linked to online and in-store behavior with less guesswork than in traditional television planning. It also changes who spends in the channel, as sectors outside retail can adopt the same closed-loop logic to justify video budgets with clearer outcomes. This makes the interactive OTT advertising market more attractive to performance-minded buyers who once treated streaming mainly as an awareness vehicle. The longer this model spreads, the more the interactive OTT advertising market benefits from the same accountability standards that propelled retail media to the top of the advertising priority list.
Fragmented Cross-Platform Measurement Standards
Measurement fragmentation remains one of the largest barriers to the interactive OTT advertising market because buying sophistication is improving faster than attribution consistency. The Joint Industry Committee confirmed, through its 2025-2026 transactability work, that methodologies across newer currencies still vary, making unified cross-platform reporting difficult without custom data arrangements. The IAB also reported that 72% of publishers cited technical complexity as a barrier to implementing standardized CTV conversion APIs. This creates a practical problem for advertisers, because platform-native reporting can overstate individual reach and hide cross-platform duplication. The burden falls hardest on mid-sized buyers that do not have the engineering resources to stitch together bespoke measurement systems. Until this improves, the interactive OTT advertising market will continue to lose some budget efficiency to reporting gaps that buyers do not face to the same extent in more mature digital channels.
Other drivers and restraints analyzed in the detailed report include:
- Programmatic Buying Expands Accessible Premium Inventory
- Shoppable And Interactive Creative Improves Conversion Efficiency
- Ad Fraud and Invalid Traffic in Programmatic OTT Supply
For complete list of drivers and restraints, kindly check the Table Of Contents.
Segment Analysis
Smart TVs accounted for 48.23% of the interactive OTT advertising market in 2025, keeping them well ahead of other device environments. Their lead reflects the fact that the large-screen, lean-back setting gives advertisers more time to present interactive prompts without forcing users to leave the viewing experience immediately. Japan offers a useful illustration of how device adoption is translating into commercial inventory, as the country's CTV segment reached JPY 129.5 billion (USD 864 million) in 2025 and grew 127% year over year. Smart TV usage also aligns with the shift toward shoppable viewing, as the television screen can hold attention while companion devices handle the final transaction step. For that reason, smart TVs remain the device foundation of the interactive OTT advertising market even as advertisers test newer environments.
Smartphones and tablets still play an important role in the interactive OTT advertising market, but they often serve as companion tools that complete QR-code, cart, or checkout actions initiated on television screens. Laptops and desktops also retain relevance in the interactive OTT advertising market, where advertisers want a stronger link to contextual research, work-from-home streaming, or B2B-style audience behavior. Gaming consoles are projected to expand at a 17.51% CAGR through 2031, making them the fastest-growing device category in the interactive OTT advertising market. Microsoft Advertising stated that gaming ads were fully viewed 100% of the time in its cited research, compared with 86% for online video and 77% for social media, which points to a strong attention environment for advertisers that can access the supply effectively. The same source also highlighted the scale of global gaming audiences and the gap between user attention and ad investment, which helps explain why console inventory is starting to attract more standardized monetization efforts. As more in-console and in-game formats become easier to transact, consoles are likely to pull a larger share of budgets inside the interactive OTT advertising market. That growth will not displace smart TVs in the near term, but it will expand the range of premium screens where interactive advertising can perform.
Complete Report Scope:
- By Device Type
- Smart TVs
- Smartphones and Tablets
- Gaming Consoles
- Laptops and Desktops
- Other Device Types
- By End-User
- Media and Entertainment
- Retail and E-Commerce
- Automotive
- BFSI
- Healthcare
- Travel and Hospitality
- Other End-Users
- By Geography
- North America
- United States
- Canada
- Mexico
- South America
- Brazil
- Argentina
- Chile
- Rest of South America
- Europe
- Germany
- United Kingdom
- France
- Italy
- Spain
- Rest of Europe
- Asia-Pacific
- China
- Japan
- India
- South Korea
- Australia
- Rest of Asia-Pacific
- Middle East
- Saudi Arabia
- United Arab Emirates
- Qatar
- Rest of Middle East
- Africa
- South Africa
- Egypt
- Nigeria
- Rest of Africa
- North America
Geography Analysis
Asia-Pacific is projected to expand at a 17.24% CAGR through 2031, making it the fastest-growing region in the interactive OTT advertising market. Japan's total video advertising market reached JPY 885.5 billion (USD 5.9 billion) in 2025 and is projected to reach JPY 1,178.3 billion (USD 7.9 billion) in 2026, suggesting a strong regional backdrop for streaming monetization. The same regional direction is reinforced by AVIA, which stated that Asia-Pacific screen industry revenues are projected to grow at a 2.8% CAGR from 2025 to 2030, with all net growth coming from online channels. That matters because online-led screen growth provides the interactive OTT advertising market with a broader supply base across both developed and developing Asian economies. It also supports the view that Asia-Pacific is moving from an emerging opportunity to a core expansion engine for the interactive OTT advertising market.
North America held 43.58% of the interactive OTT advertising market share in 2025, making it the largest regional base. The region benefits from a mature programmatic ecosystem, high connected TV penetration, and a strong retail media infrastructure that improves audience activation across streaming inventory. Amazon Ads and Roku announced in 2025 that their partnership created the largest authenticated CTV footprint in the United States, and early tests showed 40% more unique viewers reached with the same budget and nearly 30% lower ad frequency. Canada has also become attractive for quality-focused buying, with Pixalate's Q4 2025 North America benchmarks showing lower invalid traffic levels than the United States in CTV supply.
Europe holds a meaningful position in the interactive OTT advertising market, with the United Kingdom and Germany serving as the main growth centers. Pixalate reported that UK CTV invalid traffic reached 46.1% and Germany reached 44% in Q1 2026, which shows how fraud pressure is affecting effective yield in some of the region's largest markets. Those conditions are pushing buyers toward premium direct deals and curated supply paths rather than the broadest open-market routes. France, Italy, Spain, and the rest of Europe continue to add depth to the regional programmatic OTT base, while South America is benefiting from lower streaming entry prices that are helping audiences move away from legacy pay TV. Across both regions, the interactive OTT advertising market is gaining ground where digital video consumption is rising faster than legacy viewing models can respond.
- The Trade Desk, Inc.
- Roku, Inc.
- Amazon.com, Inc.
- Google LLC
- Comcast Corporation
- Magnite, Inc.
- Innovid Corp.
- PubMatic, Inc.
- Viant Technology Inc.
- Nexxen International Ltd.
- Samsung Electronics Co., Ltd.
- LG Electronics Inc.
- Fox Corporation
- Paramount Global
- The Walt Disney Company
- Netflix, Inc.
- Warner Bros. Discovery, Inc.
- Teads S.A.
- BrightLine, Inc.
Additional Benefits:
- The market estimate (ME) sheet in Excel format
- 3 months of analyst support
TABLE OF CONTENTS
1 INTRODUCTION
- 1.1 Study Assumptions and Market Definition
- 1.2 Scope of The Study
2 RESEARCH METHODOLOGY
3 EXECUTIVE SUMMARY
4 MARKET LANDSCAPE
- 4.1 Market Overview
- 4.2 Market Drivers
- 4.2.1 Streaming Time Shift Toward CTV and Ad-Supported OTT
- 4.2.2 Retail Media Data Spillover Into OTT Buying
- 4.2.3 Programmatic Buying Expands Accessible Premium Inventory
- 4.2.4 Shoppable and Interactive Creative Improves Conversion Efficiency
- 4.2.5 AI-Driven Contextual Targeting Reduces Third-Party Data Dependence
- 4.2.6 Live Sports and Event Streaming Deepen Attention Windows
- 4.3 Market Restraints
- 4.3.1 Fragmented Cross-Platform Measurement Standards
- 4.3.2 Ad Fraud and Invalid Traffic in Programmatic OTT Supply
- 4.3.3 Privacy Regulation Limits Audience Granularity
- 4.3.4 Premium Content and Licensing Cost Inflation
- 4.4 Industry Value Chain Analysis
- 4.5 Regulatory Landscape
- 4.6 Technological Outlook
- 4.7 Porter's Five Forces Analysis
- 4.7.1 Bargaining Power of Buyers
- 4.7.2 Bargaining Power of Suppliers
- 4.7.3 Threat of New Entrants
- 4.7.4 Threat of Substitutes
- 4.7.5 Intensity of Competitive Rivalry
- 4.8 Impact of Macroeconomic Factors on the Market
5 MARKET SIZE AND GROWTH FORECASTS (VALUE)
- 5.1 By Device Type
- 5.1.1 Smart TVs
- 5.1.2 Smartphones and Tablets
- 5.1.3 Gaming Consoles
- 5.1.4 Laptops and Desktops
- 5.1.5 Other Device Types
- 5.2 By End-User
- 5.2.1 Media and Entertainment
- 5.2.2 Retail and E-Commerce
- 5.2.3 Automotive
- 5.2.4 BFSI
- 5.2.5 Healthcare
- 5.2.6 Travel and Hospitality
- 5.2.7 Other End-Users
- 5.3 By Geography
- 5.3.1 North America
- 5.3.1.1 United States
- 5.3.1.2 Canada
- 5.3.1.3 Mexico
- 5.3.2 South America
- 5.3.2.1 Brazil
- 5.3.2.2 Argentina
- 5.3.2.3 Chile
- 5.3.2.4 Rest of South America
- 5.3.3 Europe
- 5.3.3.1 Germany
- 5.3.3.2 United Kingdom
- 5.3.3.3 France
- 5.3.3.4 Italy
- 5.3.3.5 Spain
- 5.3.3.6 Rest of Europe
- 5.3.4 Asia-Pacific
- 5.3.4.1 China
- 5.3.4.2 Japan
- 5.3.4.3 India
- 5.3.4.4 South Korea
- 5.3.4.5 Australia
- 5.3.4.6 Rest of Asia-Pacific
- 5.3.5 Middle East
- 5.3.5.1 Saudi Arabia
- 5.3.5.2 United Arab Emirates
- 5.3.5.3 Qatar
- 5.3.5.4 Rest of Middle East
- 5.3.6 Africa
- 5.3.6.1 South Africa
- 5.3.6.2 Egypt
- 5.3.6.3 Nigeria
- 5.3.6.4 Rest of Africa
- 5.3.1 North America
6 COMPETITIVE LANDSCAPE
- 6.1 Market Concentration
- 6.2 Strategic Moves
- 6.3 Vendor Positioning Analysis
- 6.4 Company Profiles (includes Global Level Overview, Market Level Overview, Core Segments, Financials as available, Strategic Information, Market Rank/Share, Products and Services, Recent Developments)
- 6.4.1 The Trade Desk, Inc.
- 6.4.2 Roku, Inc.
- 6.4.3 Amazon.com, Inc.
- 6.4.4 Google LLC
- 6.4.5 Comcast Corporation
- 6.4.6 Magnite, Inc.
- 6.4.7 Innovid Corp.
- 6.4.8 PubMatic, Inc.
- 6.4.9 Viant Technology Inc.
- 6.4.10 Nexxen International Ltd.
- 6.4.11 Samsung Electronics Co., Ltd.
- 6.4.12 LG Electronics Inc.
- 6.4.13 Fox Corporation
- 6.4.14 Paramount Global
- 6.4.15 The Walt Disney Company
- 6.4.16 Netflix, Inc.
- 6.4.17 Warner Bros. Discovery, Inc.
- 6.4.18 Teads S.A.
- 6.4.19 BrightLine, Inc.
7 MARKET OPPORTUNITIES AND FUTURE OUTLOOK
- 7.1 White-Space and Unmet-Need Assessment

 2026年全球履歷最佳化服務市場報告
 3D廣告看板市場:按顯示類型、格式、顯示技術、項目類型、應用程式和地區分類
 亞太地區視訊點播廣告:市場佔有率分析、產業趨勢與統計及成長預測(2026-2031 年)無 Cookie 廣告服務:市場佔有率分析、行業趨勢和統計數據以及成長預測(2026-2031 年)音訊廣告服務:市場佔有率分析、產業趨勢與統計、成長預測(2026-2031)廣告服務:市場佔有率分析、產業趨勢與統計、成長預測(2026-2031)點擊收費廣告服務:市場佔有率分析、行業趨勢和統計數據以及成長預測(2026-2031 年)
 線上分類廣告平台市場規模、佔有率和成長分析:按類型、投放類別、收入模式、平台、最終用戶和地區分類-2026-2033年產業預測
 數位廣告平台市場:2026-2032年全球市場預測(依平台類型、設備類型、定價模式、資料來源、部署模式、組織規模、客戶群及最終用戶產業分類)
 基於位置的搜尋和廣告市場規模:按類型、應用程式、地區和預測分類。