


 |
市場調查報告書
商品編碼
2122865
光纖電纜:市場佔有率分析、產業趨勢與統計、成長預測(2026-2031)Fiber Optic Cable - Market Share Analysis, Industry Trends & Statistics, Growth Forecasts (2026 - 2031) |
||||||

※ 本網頁內容可能與最新版本有所差異。詳細情況請與我們聯繫。
2025年光纖電纜市場價值為128.2億美元,預計到2031年將達到227.4億美元,而2026年為142.2億美元,預測期(2026-2031年)複合年成長率為9.84%。
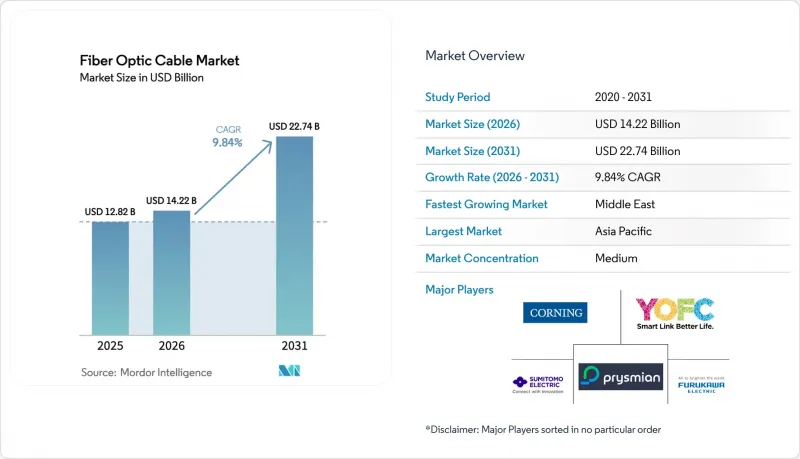
本報告依電纜類型(鎧裝電纜、非鎧裝電纜等)、光纖模式(單模光纖、多模光纖等)、安裝方式(架空/電纜、地下/埋設等)、終端用戶產業(電信、電力/智慧電網等)和地區進行細分。市場預測以美元(USD)為單位。
全球光纖電纜市場趨勢與洞察
高速網路的普及和數據流量的激增
預計到2025年,全球IP流量將達到4.8澤字節(ZB),到2028年將超過7.2澤字節,這將超越傳統銅纜環路的處理能力,並加速最後一公里光纖的部署。預計到2025年,日本家庭光纖普及率將超過85%,促使電信業者維修到「光纖到房間(FTTR)」技術,以消除建築內的網路瓶頸。印尼電信(Telkom Indonesia)在2025年鋪設了1,200萬條新的光纖連接,將服務覆蓋範圍擴展到郊區,彌補了行動網路無法滿足遠端辦公頻寬需求的不足。預製件的自動化在2024年至2025年間降低了15%的製造成本,提高了專案盈利,並加快了網路部署。歐洲電子通訊法典規定的強制性開放接取進一步降低了小規模網路服務供應商(ISP)的進入門檻,促進了競爭性網路的建置。
加速 5G 部署和光纖到府 (FTTx) 深度部署
中頻段5G無線電設備需要低於10毫秒的回程傳輸延遲,這只有專用光纖才能提供。中國移動計畫到2025年運作120萬個光纖連接的5G基地台,每個基地台周圍500公尺範圍內都將安裝光纖設備。美國T-Mobile收購了一家區域城域光纖網路,使其租賃暗纖的成本降低了20%,因此可以將這些資金用於遍遠地區的5G網路擴展。在擁擠的城市地區,光纖到戶架構正在取代分散式天線系統,因為它不需要高成本的中繼器,並簡化了運維。韓國和新加坡的建築規範現在強制要求新住宅必須採用「光纖到路邊(FTTC)」作為最低標準,以確保長期穩定的市場需求。
高昂的土木工程成本和複雜的土地徵用流程
都市區光纖計畫預算中高達75%用於溝槽和管道建設,而人手不足導致紐約市到2025年獲得許可的平均時間延長至14個月。微型溝槽施工成本降低40%,但由於擔心影響道路安全,在一些歐洲城市遭到反對,迫使業者轉而採用更深、成本更高的挖掘方式。架空鋪設成本較低,但到2025年,美國電線杆安裝費將上漲12%,將削弱其成本優勢。在缺乏明確開放接入法規的市場,土地權屬訴訟可能導致新進入者業務啟動延遲長達兩年,從而造成收入延遲和利息負擔加重。
細分市場分析
到2025年,鎧裝型光纖電纜的銷售額佔比將達到34.11%。這主要歸因於離岸風力發電、輸電線路走廊和海底連接等應用場景對機械保護的需求,使得堅固耐用的產品在光纖電纜市場佔據了最大佔有率。同時,帶狀光纖預計將以10.58%的複合年成長率成長,顯著超過整個光纖電纜市場的成長速度,因為資料中心營運商需要更短的連接時間和更高的管道填充效率。康寧的可伸縮帶狀光纖電纜可在2英吋的管道內容納3456根光纖,為擁擠的都市區佈線帶來革命性的變革。批量熔接技術可將安裝時間縮短70%,鑑於熟練技術人員長期短缺,此指標至關重要。此外,抗彎曲的單模玻璃降低了高密度安裝中的破損風險。
除了超大規模環境之外,帶狀光纜設計也擴大應用於區域性專案中,因為承包商往往需要根據嚴格的時間限制津貼,以縮短工期。同時,鎧裝光纜在海底和惡劣地形中仍然至關重要。 2025年,耐克森公司向北海風電樞紐提供了450公里的雙層鎧裝光纜,以抵禦拖網漁船的碰撞和海底的磨損。因此,鎧裝光纜的市場規模預計將繼續成長,但不會像高密度帶狀光纜那樣龐大。
2025年,單模光纖將佔全球出貨量的72.38%,鞏固其在長途、城域和FTTP(光纖到府)專案中的主導地位。其廣泛的部署記錄確保了與傳統收發器的向下相容性,從而保持了光纖電纜市場的重要佔有率。然而,多芯光纖和富模光纖目前仍處於研發階段,預計其複合年成長率將達到10.21%,這反映了營運商為延緩擁塞網路段的波長升級而進行的試驗。 NTT已於2025年成功在東京和大阪之間使用四芯光纖進行了1PB/s的現場測試,證實了其擴充性。
儘管多模光纖仍繼續用於短距離的園區內鏈路,但即使在資料中心,單模光纖也越來越受到青睞,尤其是在400G和800G光學模組領域,多模光纖的長期市場佔有率正在萎縮。塑膠光纖憑藉其卓越的電磁抗擾性,儘管頻寬有限,但在汽車LiDAR和工廠自動化領域仍佔有一席之地。總體而言,預計單模光纖將保持主導地位直至2031年,但空間復用(SDM)的初步試驗表明,在超高容量骨幹網路中,多芯光纖的應用前景廣闊。
區域分析
亞太地區仍是最大的市場,預計到2025年將佔全球收入的35.84%,這主要得益於中國光纖到戶(FtR)計畫的持續高需求、印度BharatNet網路的擴建以及日本室內網路升級。中國移動部署120萬個光纖5G基地台,凸顯了該地區電信業者所享有的規模經濟效益。 BharatNet的村際互聯互通正在減少平均自助服務終端停機時間,提高專案投資回報率,並促使各邦政府追加預算撥款。
中東地區被定位為成長最快的地區,預計到2031年複合年成長率將達到10.91%。沙烏地阿拉伯的NEOM新城和更廣泛的「2030願景」計畫、阿拉伯聯合大公國的「光纖到戶」計畫以及埃及新興的資料中心叢集,預計到2025年將新增45萬條光纖連線。康普公司在利雅德組裝廠的合資企業正是透過供應鏈在地化來滿足這項激增需求的典型案例。
預計北美和歐洲將實現中等個位數成長。人口稠密的都市區網路飽和的情況正透過美國農業部「重新連接」(ReConnect)津貼和東歐「Gigabit基礎設施法案」下的項目得到緩解。 2025年,美國農村地區的平均部署成本將為每戶8,500美元,其生命週期成本低於其他無線和衛星通訊方案。在南美洲,尤其是在巴西和阿根廷,都市區的同軸電纜網路正被光纖到樓(FTTH)升級所取代。光是Vivo一家公司預計到2025年就將新增800萬條FTTH線路。
非洲的部署主要得益於新建海底光纜和內陸回程傳輸鏈路走廊。 「2Africa」系統已將批發價格降低了高達60%,使當地網路服務供應商能夠擴展其服務層級,並加速從沿海登陸點建造陸基網路。在所有地區,光纖電纜市場都受益於旨在促進數位包容和資料主權的政策支援。
其他好處:
- Excel格式的市場預測(ME)表
- 3個月的分析師支持
目錄
第1章:引言
- 研究假設和市場定義
- 調查範圍
第2章:調查方法
第3章執行摘要
第4章 市場狀況
- 市場概覽
- 市場促進因素
- 高速網路的廣泛普及和全球數據流量的激增
- 5G部署的加速以及FTTx的引入,即深度穿透式光纖網路。
- 對超大規模資料中心互連的需求日益成長。
- 政府主導的農村寬頻和數位包容計劃
- 拓展水下航線以增強地緣政治韌性
- 作為我們永續性的一部分,我們正在用低碳玻璃纖維取代銅。
- 市場限制因素
- 高昂的土木工程成本和複雜的土地徵用流程
- 原物料價格波動和氦氣供應限制
- 水下路線環境許可審核延誤
- 電信業者在飽和的大都會圈市場的資本投資呈現趨於平穩的趨勢。
- 產業價值鏈分析
- 監理情勢
- 技術展望
- 多芯和空芯光纖發展藍圖
- 利用整合光電和矽光電整合收發器
- 價格分析
- 波特五力分析
- 宏觀經濟因素對市場的影響
- 投資分析
第5章 市場規模與成長預測
- 按電纜類型
- 鎧裝電纜
- 非鎧裝電纜
- 帶狀電纜
- 其他電纜類型
- 光纖模式
- 單模光纖
- 多模光纖
- 塑膠光纖
- 按安裝類型
- 空氣/想像
- 地下/埋藏
- 海底/水下
- 室內/入口電纜
- 按最終用戶行業分類
- 電訊
- 資料中心和雲端服務供應商
- 電力公司和智慧電網
- 國防/航太
- 工業自動化與控制
- 醫療保健
- 石油天然氣及海上作業
- 其他終端用戶產業
- 按地區
- 北美洲
- 美國
- 加拿大
- 墨西哥
- 南美洲
- 巴西
- 阿根廷
- 其他南美國家
- 歐洲
- 德國
- 英國
- 法國
- 義大利
- 西班牙
- 其他歐洲國家
- 亞太地區
- 中國
- 日本
- 印度
- 韓國
- 其他亞太國家
- 中東
- 沙烏地阿拉伯
- 阿拉伯聯合大公國
- 土耳其
- 其他中東國家
- 非洲
- 南非
- 奈及利亞
- 埃及
- 其他非洲國家
- 北美洲
第6章 競爭情勢
- 市場集中度
- 策略趨勢
- 市佔率分析
- 公司簡介
- Prysmian Group
- Corning Inc.
- Sumitomo Electric Industries Ltd.
- Furukawa Electric Co., Ltd.
- Yangtze Optical Fiber and Cable(YOFC)
- CommScope Holding Company Inc.
- Fujikura Ltd.
- Nexans SA
- LS Cable and System Ltd.
- OFS Fitel LLC
- Sterlite Technologies Ltd.
- Hengtong Optic-Electric Co. Ltd.
- ZTT Group
- Proterial Ltd.
- Finolex Cables Ltd.
- Belden Inc.
- General Cable Corp.
- Hexatronic Group AB
- HMN Tech Co., Ltd.
- Taihan Fiberoptics Co., Ltd.
第7章 市場機會與未來展望
According to Mordor Intelligence, the fiber optic cable market size was valued at USD 12.82 billion in 2025 and is estimated to grow from USD 14.22 billion in 2026 to reach USD 22.74 billion by 2031, at a CAGR of 9.84% during the forecast period (2026-2031).
This report is Segmented by Cable Type (Armored Cable, Non-Armored Cable, and More), Fiber Mode (Single-Mode Fiber, Multi-Mode Fiber, and More), Installation Type (Aerial/Overhead, Underground/Buried, and More), End-User Industry (Telecommunication, Power Utilities and Smart Grid, and More), and Geography. The Market Forecasts are Provided in Terms of Value (USD).
Global Fiber Optic Cable Market Trends and Insights
High-Speed Internet Penetration and Data-Traffic Surge
Global IP traffic climbed to 4.8 zettabytes in 2025 and is on pace to exceed 7.2 zettabytes by 2028, overwhelming legacy copper loops and fueling last-mile fiber conversions. Japan's household fiber penetration surpassed 85% in 2025, prompting operators to pursue fiber-to-the-room retrofits to eliminate in-building bottlenecks. Telkom Indonesia deployed 12 million new fiber drops in 2025, extending reach to suburban zones where mobile networks could not satisfy remote-work bandwidth needs. Preform automation trimmed manufacturing costs by 15% between 2024 and 2025, improving project returns and accelerating network rollouts. Open-access mandates under the European Electronic Communications Code further lower barriers for smaller ISPs, fostering competitive build-outs.
Accelerated 5G Roll-Outs and Fiber-Deep FTTx
Mid-band 5G radios require sub-10-millisecond backhaul latency that only dedicated fiber can supply. China Mobile activated 1.2 million fiber-fed 5G sites in 2025, placing optical plant within 500 meters of each tower. T-Mobile USA's acquisition of regional metro fiber trimmed leased-dark-fiber costs by 20%, reallocating capital toward rural 5G expansion. Fiber-deep architectures are displacing distributed-antenna systems in crowded downtowns because they remove costly repeaters and simplify operations. Building codes in South Korea and Singapore now specify fiber-to-the-curb as a minimum standard for new housing, locking in steady long-range demand.
High Civil-Works Cost and Right-of-Way Complexity
Trenching and conduit work represent up to 75% of urban fiber project budgets, and labor shortages pushed New York City permit cycles to an average 14 months in 2025. Micro-trenching, though 40% cheaper, faces opposition in several European cities over road-integrity concerns, forcing operators back to deeper, costlier digs. Aerial deployment is cheaper but pole-attachment fees in the United States rose 12% in 2025, eroding cost advantages. Right-of-way litigation can stall competitive entrants for up to two years in markets that lack clear open-access rules, delaying revenue and inflating interest costs.
Other drivers and restraints analyzed in the detailed report include:
- Hyperscale Data-Center Interconnect Demand
- Government-Backed Rural Broadband Programs
- Raw-Material Price Volatility and Helium Supply
For complete list of drivers and restraints, kindly check the Table Of Contents.
Segment Analysis
Armored designs held 34.11% of 2025 revenue as offshore wind farms, utility corridors, and subsea links demanded mechanical protection, securing the largest fiber optic cable market share for ruggedized products. Ribbon architectures, however, are forecast to expand at a 10.58% CAGR, well above the overall fiber optic cable market, as data-center operators chase splice-time savings and conduit-fill efficiency. Corning's rollable ribbon enables 3,456 fibers within a 2-inch duct, a game-changer for congested metro pathways. Mass-fusion splicing trims labor hours by 70%, a critical metric amid chronic technician shortages, while bend-insensitive single-mode glass reduces break risk during high-density pulls.
Beyond hyperscale environments, ribbon designs are winning rural projects where contractors prefer time-compressed builds financed by tight-deadline grants. Meanwhile, armored variants remain irreplaceable undersea and in harsh terrains; Nexans supplied 450 km of double-armored cable to the North Sea Wind Power Hub in 2025 to withstand trawler strikes and seabed abrasion. As a result, the fiber optic cable market size for armored lines will keep expanding, though at a slower rate than high-density ribbon.
Single-mode maintained 72.38% of global shipments in 2025, cementing its status as the workhorse for long-haul, metro, and fiber-to-the-premises projects. The enormous installed base safeguards backward compatibility with legacy transceivers, preserving its large fiber optic cable market share. Research-stage multi-core and few-mode strands, however, are recording a 10.21% CAGR, reflecting operator trials aimed at postponing wavelength upgrades on congested corridors. NTT achieved a 1-petabit-per-second field trial on a Tokyo-Osaka route using 4-core glass in 2025, underscoring the scalability path.
Multi-mode continues to serve short-reach campus links, but 400G and 800G optics increasingly favor single-mode even inside data halls, narrowing multi-mode's long-term footprint. Plastic optical fiber retains niche roles in automotive lidar and factory automation, prized for electromagnetic immunity despite limited bandwidth. Overall, single-mode will stay dominant through 2031, but spatial-division multiplexing pilots indicate an evolutionary path toward multi-core adoption in ultra-capacity backbones.
Complete Report Scope:
- By Cable Type
- Armored Cable
- Non-Armored Cable
- Ribbon Cable
- Other Cable Type
- By Fiber Mode
- Single-Mode Fiber
- Multi-Mode Fiber
- Plastic Optical Fiber
- By Installation Type
- Aerial / Overhead
- Underground / Buried
- Submarine / Under-Water
- Indoor / Drop Cables
- By End-User Industry
- Telecommunications
- Data Centers and Cloud Providers
- Power Utilities and Smart Grid
- Defense and Aerospace
- Industrial Automation and Control
- Healthcare and Medical
- Oil and Gas and Offshore
- Other End-User Industry
- By Geography
- North America
- United States
- Canada
- Mexico
- South America
- Brazil
- Argentina
- Rest of South America
- Europe
- Germany
- United Kingdom
- France
- Italy
- Spain
- Rest of Europe
- Asia Pacific
- China
- Japan
- India
- South Korea
- Rest of Asia Pacific
- Middle East
- Saudi Arabia
- United Arab Emirates
- Turkey
- Rest of Middle East
- Africa
- South Africa
- Nigeria
- Egypt
- Rest of Africa
- North America
Geography Analysis
Asia Pacific remained the largest region at 35.84% of 2025 revenue as China's fiber-to-the-room mandates, India's BharatNet expansion, and Japan's in-building upgrades sustained large volume pulls. China Mobile's deployment of 1.2 million fiber-connected 5G sites underscores the scale advantage enjoyed by the region's carriers. BharatNet's village links have reduced average kiosk downtime, reinforcing project ROI and encouraging additional state allocations.
The Middle East ranks as the fastest-growing geography at a 10.91% CAGR to 2031. Saudi Arabia's NEOM and broader Vision 2030 programs, the UAE's fiber-to-the-unit mandate, and Egypt's emerging data-center clusters created 450,000 new fiber premises in 2025. CommScope's joint venture for a Riyadh assembly plant exemplifies supply-chain localization to serve this demand burst.
North America and Europe exhibit mid-single-digit growth. Saturation in dense metros is balanced by USDA ReConnect grants and Eastern European Gigabit Infrastructure Act projects. Rural U.S. deployments averaged USD 8,500 per premise in 2025, offering lower lifecycle cost than competing wireless or satellite options. South America concentrates in Brazil and Argentina where urban fiber-to-the-building upgrades displace coax networks; Vivo alone added 8 million FTTH lines in 2025.
Africa's trajectory hinges on new wet cables and inland backhaul corridors. The 2Africa system cut wholesale prices by up to 60%, enabling local ISPs to expand service tiers and stimulating terrestrial build-outs from coastal landing points. Across all regions, the fiber optic cable market benefits from converging policy support for digital inclusion and data-sovereignty requirements.
- Prysmian Group
- Corning Inc.
- Sumitomo Electric Industries Ltd.
- Furukawa Electric Co., Ltd.
- Yangtze Optical Fiber and Cable (YOFC)
- CommScope Holding Company Inc.
- Fujikura Ltd.
- Nexans S.A.
- LS Cable and System Ltd.
- OFS Fitel LLC
- Sterlite Technologies Ltd.
- Hengtong Optic-Electric Co. Ltd.
- ZTT Group
- Proterial Ltd.
- Finolex Cables Ltd.
- Belden Inc.
- General Cable Corp.
- Hexatronic Group AB
- HMN Tech Co., Ltd.
- Taihan Fiberoptics Co., Ltd.
Additional Benefits:
- The market estimate (ME) sheet in Excel format
- 3 months of analyst support
TABLE OF CONTENTS
1 INTRODUCTION
- 1.1 Study Assumptions and Market Definition
- 1.2 Scope of the Study
2 RESEARCH METHODOLOGY
3 EXECUTIVE SUMMARY
4 MARKET LANDSCAPE
- 4.1 Market Overview
- 4.2 Market Drivers
- 4.2.1 Increasing Penetration of High-Speed Internet and Global Data-Traffic Surge
- 4.2.2 Accelerated 5G Roll-outs and Fiber-Deep FTTx Deployments
- 4.2.3 Expanding Hyperscale Data-Center Interconnect Demand
- 4.2.4 Government-Backed Rural Broadband and Digital-Inclusion Programs
- 4.2.5 Sub-Sea Route Diversification for Geopolitical Resiliency
- 4.2.6 Sustainability Push Replacing Copper with Low-Carbon Glass Fiber
- 4.3 Market Restraints
- 4.3.1 High Civil-Works Cost and Right-of-Way Complexities
- 4.3.2 Price Volatility in Raw Materials and Helium Supply Constraints
- 4.3.3 Delays in Environmental Permitting for Submarine Routes
- 4.3.4 Plateauing Telco Capex in Saturated Metro Markets
- 4.4 Industry Value-Chain Analysis
- 4.5 Regulatory Landscape
- 4.6 Technological Outlook
- 4.6.1 Multi-Core and Hollow-Core Fiber Roadmap
- 4.6.2 Integrated Photonics and Silicon-Photonics Transceiver Integration
- 4.7 Pricing Analysis
- 4.8 Porter's Five Forces Analysis
- 4.8.1 Threat of New Entrants
- 4.8.2 Bargaining Power of Buyers
- 4.8.3 Bargaining Power of Suppliers
- 4.8.4 Threat of Substitute Products
- 4.8.5 Intensity of Competitive Rivalry
- 4.9 Impact of Macroeconomic Factors on the Market
- 4.10 Investment Analysis
5 MARKET SIZE AND GROWTH FORECASTS (VALUE)
- 5.1 By Cable Type
- 5.1.1 Armored Cable
- 5.1.2 Non-Armored Cable
- 5.1.3 Ribbon Cable
- 5.1.4 Other Cable Type
- 5.2 By Fiber Mode
- 5.2.1 Single-Mode Fiber
- 5.2.2 Multi-Mode Fiber
- 5.2.3 Plastic Optical Fiber
- 5.3 By Installation Type
- 5.3.1 Aerial / Overhead
- 5.3.2 Underground / Buried
- 5.3.3 Submarine / Under-Water
- 5.3.4 Indoor / Drop Cables
- 5.4 By End-User Industry
- 5.4.1 Telecommunications
- 5.4.2 Data Centers and Cloud Providers
- 5.4.3 Power Utilities and Smart Grid
- 5.4.4 Defense and Aerospace
- 5.4.5 Industrial Automation and Control
- 5.4.6 Healthcare and Medical
- 5.4.7 Oil and Gas and Offshore
- 5.4.8 Other End-User Industry
- 5.5 By Geography
- 5.5.1 North America
- 5.5.1.1 United States
- 5.5.1.2 Canada
- 5.5.1.3 Mexico
- 5.5.2 South America
- 5.5.2.1 Brazil
- 5.5.2.2 Argentina
- 5.5.2.3 Rest of South America
- 5.5.3 Europe
- 5.5.3.1 Germany
- 5.5.3.2 United Kingdom
- 5.5.3.3 France
- 5.5.3.4 Italy
- 5.5.3.5 Spain
- 5.5.3.6 Rest of Europe
- 5.5.4 Asia Pacific
- 5.5.4.1 China
- 5.5.4.2 Japan
- 5.5.4.3 India
- 5.5.4.4 South Korea
- 5.5.4.5 Rest of Asia Pacific
- 5.5.5 Middle East
- 5.5.5.1 Saudi Arabia
- 5.5.5.2 United Arab Emirates
- 5.5.5.3 Turkey
- 5.5.5.4 Rest of Middle East
- 5.5.6 Africa
- 5.5.6.1 South Africa
- 5.5.6.2 Nigeria
- 5.5.6.3 Egypt
- 5.5.6.4 Rest of Africa
- 5.5.1 North America
6 COMPETITIVE LANDSCAPE
- 6.1 Market Concentration
- 6.2 Strategic Moves
- 6.3 Market Share Analysis
- 6.4 Company Profiles (includes Global Level Overview, Market Level Overview, Core Segments, Financials as Available, Strategic Information, Market Rank/Share for Key Companies, Products and Services, and Recent Developments)
- 6.4.1 Prysmian Group
- 6.4.2 Corning Inc.
- 6.4.3 Sumitomo Electric Industries Ltd.
- 6.4.4 Furukawa Electric Co., Ltd.
- 6.4.5 Yangtze Optical Fiber and Cable (YOFC)
- 6.4.6 CommScope Holding Company Inc.
- 6.4.7 Fujikura Ltd.
- 6.4.8 Nexans S.A.
- 6.4.9 LS Cable and System Ltd.
- 6.4.10 OFS Fitel LLC
- 6.4.11 Sterlite Technologies Ltd.
- 6.4.12 Hengtong Optic-Electric Co. Ltd.
- 6.4.13 ZTT Group
- 6.4.14 Proterial Ltd.
- 6.4.15 Finolex Cables Ltd.
- 6.4.16 Belden Inc.
- 6.4.17 General Cable Corp.
- 6.4.18 Hexatronic Group AB
- 6.4.19 HMN Tech Co., Ltd.
- 6.4.20 Taihan Fiberoptics Co., Ltd.
7 MARKET OPPORTUNITIES AND FUTURE OUTLOOK
- 7.1 White-Space and Unmet-Need Assessment

 特種光纖電纜市場-全球及區域分析:按應用、產品與國家分類-分析與預測,2026-2036年
 美國及歐洲光纖電纜:市場佔有率分析、產業趨勢與統計及成長預測(2026-2031 年)
 模式調節電纜市場規模、佔有率和成長分析:按電纜類型、連接器類型、應用、最終用戶和地區分類-2026年至2033年產業預測美國光纖電纜:市場佔有率分析、行業趨勢和統計數據以及成長預測(2026-2031 年)
 光纖電纜市場-2026-2032年全球市場預測智慧公路和自動駕駛基礎設施中的光纖電纜:市場佔有率分析、行業趨勢和統計數據以及成長預測(2026-2031 年)鐵路和地鐵基礎設施用光纖電纜:市場佔有率分析、行業趨勢和統計數據以及成長預測(2026-2031 年)
 2026-2030年全球軍用級光纖電纜市場
 光纖電纜市場商機、成長要素、產業趨勢分析及2026-2035年預測
 光纖電纜市場預測至2034年—按光纖類型、電纜類型、安裝類型、應用、最終用戶和地區分類的全球分析