


 |
市場調查報告書
商品編碼
2125613
美國及歐洲光纖電纜:市場佔有率分析、產業趨勢與統計及成長預測(2026-2031 年)United States And European Fiber Optic Cable - Market Share Analysis, Industry Trends & Statistics, Growth Forecasts (2026 - 2031) |
||||||

※ 本網頁內容可能與最新版本有所差異。詳細情況請與我們聯繫。
據 Mordor Intelligence 稱,美國和歐洲光纖電纜市場預計到 2026 年價值 45.6 億美元,高於 2025 年的 41.8 億美元,預計到 2031 年將達到 70.3 億美元。
預計 2026 年至 2031 年的複合年成長率為 9.05%。
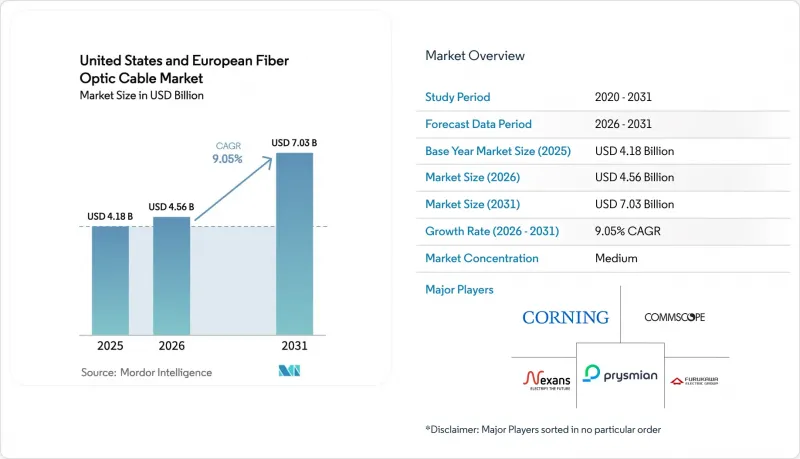
本報告按電纜類型(鬆套管、緊包電纜等)、模式(單模、多模)、安裝方式(地下、架空、海底)、終端用戶產業(電信、電力等)和地區進行細分。市場預測以美元計價。
美國和歐洲光纖電纜市場的趨勢和見解。
資料流量和雲端工作負載的快速成長
專用於人工智慧訓練叢集的超大規模資料中心正以前所未有的速度消耗高密度帶狀光纖元件,這反映了銅線無法應對的東西向流量模式。 Meta 的「沃特沃斯計畫」(Project Waterworth)和亞馬遜的愛爾蘭-美國海底光纜就是數十億美元投資私人骨幹基礎設施的例證,這些計畫優先考慮 400G 和 800G 光通道。 MPO/MTP 連接器的前置作業時間超過 16 週,顯示供應緊張,並凸顯了垂直整合供應商的優勢。超低損耗 G.654.E 光纖的應用日益廣泛,以減少離岸鏈路的再生點,從而降低雲端運營商的總體擁有成本 (TCO)。因此,能夠提供針對人工智慧工作負載最佳化的專用緊緩衝和帶狀光纖設計的製造商,不僅能夠獲得溢價,還能透過本地環境中的遷移、擴展和改造等業務收益。
加速對光纖到府 (FTTH) 和 5G 部署的投資
截至2024年9月,歐盟39個成員國的光纖普及率達74.6%,同期德國新增380萬戶家庭接入光纖網路,英國新增420萬戶家庭接入光纖網路。 Delta Fibre、Open Dutch Fibre和KPN旗下的Glaspoort等公司透過競爭性建設,推動荷蘭的家庭光纖覆蓋率達到88%,創下里程碑式的成就。同時,毫米波5G網路密度的提升依賴於暗纖回程傳輸傳至小型基地台叢集,這促使行動網路營運商聯合部署FTTH和5G資產以分攤挖掘成本。基礎設施共用和中立主機塔模式降低了新加入經營者的准入門檻,而多租戶資料中心則透過利用相同的管道系統整合了連網機房。這種融合正在加速電纜製造商的訂單成長,這些製造商維護可適應架空和地下線路的模組化產品系列。
高昂的土木工程成本和土地徵收成本
2024年,地下管線建設成本達到每英尺18.25美元,漲幅達12%,主要原因是人事費用上升以及人口密集城市核准流程冗長。由於土木工程成本佔專案預算的80%之多,營運商被迫採用微型溝槽和管道再利用等策略。架空管線安裝成本為每英尺6.55美元,雖然仍具有吸引力,但在歐洲,為了保護城市景觀,強制要求採用地下管線,這給架空管線安裝帶來了挑戰。這些趨勢為擁有傳統電線杆安裝權和現有管道的營運商創造了有利環境,限制了在待開發區的新管線安裝,並緩解了成熟郵遞區號區域的激烈競爭。
細分市場分析
2025年,鬆套管光纖電纜在光纖市場銷售中仍佔33.68%的佔有率。這主要歸功於其防潮結構,使其成為戶外管道和架空線路的理想選擇。政府資助的遍遠地區建設項目推動了這個細分市場的發展,這些項目需要使用凝膠填充或乾芯鬆套管光纖電纜,以確保在極端溫度波動環境下的長期可靠性。此外,各州優先發展地下網路而非無線網路的寬頻津貼政策也與市場需求密切相關,這使得預測現有業者國內設施的產能成為可能。
同時,超大規模資料中心和託管業者正在加速採購緊包線束組件,預計到2031年,其複合年成長率將達到9.54%。這反映出資料通道中緊包線束的部署量增加,其中抗彎曲護套和900µm塗層可縮短安裝時間。隨著人工智慧叢集集中每個機架的連接埠數量增加兩倍,帶狀緊包線束便於與預端接的MPO主幹線纜進行大批量熔接,在連接器持續短缺的情況下,這導致了溢價。 GPU的普及使得人們傾向於選擇靠近再生能源來源的多租戶建築,從而推動了線纜配置向阻燃阻燃型阻燃標準轉變,供應商正在改造其護套生產線以適應低毒性化合物。
由於單模光纖具有遠距離傳輸能力,且頻寬足以滿足頻寬(FTTH)、城域網路和海底光纜骨幹網路的未來需求,預計到 2025 年,單模光纖解決方案將佔據 60.92% 的收入佔有率。政府補貼鞏固了單模光纖在接入環路中的主導地位,而 1 Gbps 服務正逐漸成為標準配置。電信業者正在部署標準的 G.652.D 或抗彎曲的 G.657.A2 光纖芯,以延長新投資的使用壽命。
預計到2031年,多模光纖的出貨量將以9.41%的複合年成長率成長。這主要歸功於OM4/OM5系列光纖支援超大規模葉脊式光纖網路結構中的400G SR8和800G SR4通道。雖然平行光架構將傳輸距離限制在150公尺以內,但它們顯著降低了收發器的成本,並在資料傳輸領域重新奪回了市場佔有率。供應商正透過採用針對850奈米VCSEL光源最佳化的階梯式屈光分佈來解決這個問題,從而改善模式分散並提高規格容差。這一趨勢正在推動短距離跳線的整體出貨量成長,提高長途專案之間的工廠運轉率,並有助於緩解電信營運商資本支出週期中固有的收入波動。
其他好處:
- Excel格式的市場預測(ME)表
- 3個月的分析師支持
目錄
第1章:引言
- 市場分析與定義的前提條件
- 分析範圍
第2章 分析方法
第3章執行摘要
第4章 市場狀況
- 市場概覽
- 市場促進因素
- 資料流量和雲端工作負載正在激增。
- 加速對光纖到府 (FTTH) 和 5G 部署的投資
- 政府寬頻推廣政策(美國的 BEAD / 歐盟的數位十年)
- 採用超低損耗單模光纖
- 在開放式無線存取網路 (Open-RAN) 中,使用中立主機的高密度網路連線需要暗纖。
- 公共產業利用光纖技術實現電網現代化
- 市場限制因素
- 高昂的土木工程成本和土地徵收成本
- 來自固定無線和衛星寬頻的競爭。
- 光纖連接工作技術純熟勞工短缺
- 玻璃預製件供應鏈的可變性
- 價值鏈分析
- 監理情勢
- 技術展望
- 光纖在主要產業的現狀
- 波特五力分析
- 宏觀經濟因素對市場的影響
第5章:預測市場規模與成長率
- 按電纜類型
- 鬆管
- 緊緩衝
- 絲帶
- 裝甲
- 按模式
- 單模
- 多模式
- 透過安裝方法
- 地下
- 虛構的
- 海底
- 按最終用戶行業分類
- 溝通
- 電力
- 國防/軍事
- 工業和製造業
- 醫療保健
- 國家
- 美國
- 德國
- 英國
- 法國
- 義大利
- 西班牙
- 荷蘭
- 奧地利
- 瑞士
- 其他歐洲國家
第6章 競爭情勢
- 市場集中度
- 策略趨勢
- 市佔率分析
- 公司簡介
- Prysmian Group
- Corning Inc.
- Nexans SA
- CommScope Holding Company Inc.
- Furukawa Electric Co., Ltd.
- Sumitomo Electric Industries Ltd.
- Sterlite Technologies Limited
- Fujikura Ltd.
- Leoni AG
- Belden Inc.
- LS Cable and System
- HUBER+SUHNER AG
- Hexatronic Group AB
- AFL(Fujikura)
- Optical Cable Corp.
- Coherent Corp.(Finisar Corporation)
- ZTT Group
- Molex LLC
第7章 市場機會與未來展望
According to Mordor Intelligence, the United States and European Fiber Optic Cable Market size in 2026 is estimated at USD 4.56 billion, growing from 2025 value of USD 4.18 billion with 2031 projections showing USD 7.03 billion, growing at 9.05% CAGR over 2026-2031.
This report is Segmented by Cable Type (Loose-Tube, Tight-Buffered, and More), Mode (Single-Mode, Multi-Mode), Deployment Type (Underground, Aerial, Submarine), End-User Industry (Telecommunications, Power Utilities, and More), and Geography. The Market Forecasts are Provided in Terms of Value (USD).
United States And European Fiber Optic Cable Market Trends and Insights
Surging Data Traffic and Cloud Workloads
Hyperscale data centers dedicated to AI training clusters are consuming high-density ribbon assemblies at an unprecedented pace, reflecting east-west traffic patterns that copper links cannot support. Meta's Project Waterworth and Amazon's Ireland-US cable exemplify multibillion-dollar commitments to private backbone infrastructure that prioritize 400 G and 800 G optical lanes. Connector lead times exceed 16 weeks for MPO/MTP formats, illustrating a tightening supply environment that strengthens the hand of vertically integrated suppliers . Ultra-low-loss G.654.E fibers are gaining traction because they reduce regeneration sites across ocean spans, thereby decreasing the total cost of ownership for cloud operators. As a result, manufacturers capable of delivering specialty tight-buffered and ribbon designs optimized for AI workloads secure premium pricing while broadening recurring services revenue from on-premise moves, adds, and changes.
Accelerated FTTH and 5G Rollout Investments
EU39 fiber coverage rose to 74.6% by September 2024, with Germany adding 3.8 million premises and the United Kingdom passing 4.2 million during that period. Competitive overbuilds by Delta Fibre, Open Dutch Fibre, and KPN's Glaspoort drove the Netherlands to an 88% household coverage milestone. In parallel, millimeter-wave 5G densification depends on dark-fiber backhaul to small-cell clusters, prompting mobile network operators to co-deploy FTTH and 5G assets to amortize trenching costs. Infrastructure sharing and neutral-host tower models lower barriers for alternative operators, while multitenant data centers leverage the same conduit systems to integrate meet-me rooms. This convergence accelerates order pipelines for cable makers that maintain modular product portfolios adaptable to both aerial and underground pathways.
High Civil-Works and Right-of-Way Costs
Underground construction reached USD 18.25 per foot in 2024, a 12% leap attributed to labor inflation and lengthy permitting cycles in dense metros . Civil works represent up to 80% of project budgets, compelling operators to pursue micro-trenches and conduit reuse strategies. Aerial placement, priced at USD 6.55 per foot, remains attractive but faces European mandates for burial to preserve streetscapes. These dynamics tilt the playing field toward incumbents holding legacy pole-attachment rights and pre-existing ducts, deterring greenfield overbuilds and moderating competitive intensity in mature ZIP codes.
Other drivers and restraints analyzed in the detailed report include:
- Government Broadband Stimulus Programs
- Adoption of Ultra-Low-Loss Single-Mode Fibers
- Competition from Fixed-Wireless and Satellite Broadband
For complete list of drivers and restraints, kindly check the Table Of Contents.
Segment Analysis
Loose-tube designs maintained a 33.68% revenue lead within the fiber optic cable market in 2025, owing to moisture-blocked constructions ideal for outdoor ducts and aerial spans. This segment capitalizes on government-funded rural builds, where extended temperature swings demand gel-filled or dry-core loose-tube formats for long-term reliability. Demand ties closely to statewide broadband grants that prioritize buried networks over wireless substitutes, enabling predictable furnace loading at domestic facilities owned by incumbents.
Hyperscale and colocation operators, however, are accelerating procurement of tight-buffered assemblies that demonstrate a 9.54% CAGR to 2031, reflecting growing intra-data-hall deployments where bend-insensitive jacketing and 900-µm coatings reduce installation time. Port counts per rack have tripled in AI clusters, and ribbonized tight buffers ease mass-fusion splicing to pre-terminated MPO trunks, attracting price premiums amid ongoing connector shortages. As GPU expansion favors multi-tenant buildings located near renewable energy, the cable mix skews toward flame-retardant plenum ratings, prompting vendors to retool jacketing lines for lower-toxicity compounds.
Single-mode solutions controlled 60.92% of 2025 revenue, given their long-haul reach and future-proof bandwidth for FTTH, metro, and subsea backbones. Government subsidies cement single-mode dominance for access loops where 1 Gbps services are baseline. Operators deploy standard G.652.D or bend-tolerant G.657.A2 cores to extend the life cycles of new plant investments.
Multi-mode fiber volumes are set for a 9.41% CAGR through 2031 as OM4/OM5 variants support 400G SR8 and 800G SR4 lanes inside hyperscale leaf-spine fabrics. Parallel-optic architectures limit reach to 150 m but slash transceiver costs, reclaiming share in data halls. Vendors respond with graded-index profiles optimized for 850 nm VCSEL sources that improve modal dispersion, tightening spec tolerances. The trend lifts overall volume for short-reach jumpers, enhancing factory utilization rates between long-haul campaign runs and helping buffer revenue cyclicality inherent in carrier capex cycles.
Complete Report Scope:
- By Cable Type
- Loose-tube
- Tight-buffered
- Ribbon
- Armoured
- By Mode
- Single-mode
- Multi-mode
- By Deployment Type
- Underground
- Aerial
- Submarine
- By End-user Industry
- Telecommunications
- Power Utilities
- Defense and Military
- Industrial and Manufacturing
- Medical
- By Country
- United States
- Germany
- United Kingdom
- France
- Italy
- Spain
- Netherlands
- Austria
- Switzerland
- Rest of Europe
List of Companies Covered in this Report:
- Prysmian Group
- Corning Inc.
- Nexans SA
- CommScope Holding Company Inc.
- Furukawa Electric Co., Ltd.
- Sumitomo Electric Industries Ltd.
- Sterlite Technologies Limited
- Fujikura Ltd.
- Leoni AG
- Belden Inc.
- LS Cable and System
- HUBER+SUHNER AG
- Hexatronic Group AB
- AFL (Fujikura)
- Optical Cable Corp.
- Coherent Corp. (Finisar Corporation)
- ZTT Group
- Molex LLC
Additional Benefits:
- The market estimate (ME) sheet in Excel format
- 3 months of analyst support
TABLE OF CONTENTS
1 INTRODUCTION
- 1.1 Study Assumptions and Market Definition
- 1.2 Scope of the Study
2 RESEARCH METHODOLOGY
3 EXECUTIVE SUMMARY
4 MARKET LANDSCAPE
- 4.1 Market Overview
- 4.2 Market Drivers
- 4.2.1 Surging data traffic and cloud workloads
- 4.2.2 Accelerated FTTH and 5G rollout investments
- 4.2.3 Government broadband stimulus (US BEAD/EU Digital Decade)
- 4.2.4 Adoption of ultra-low-loss single-mode fibers
- 4.2.5 Open-RAN neutral-host densification needs dark fiber
- 4.2.6 Utility-owned fiber commercialization for grid modernization
- 4.3 Market Restraints
- 4.3.1 High civil-works and right-of-way costs
- 4.3.2 Competition from fixed-wireless and satellite broadband
- 4.3.3 Skilled labour shortage for fiber splicing
- 4.3.4 Volatility in glass-preform supply chain
- 4.4 Value Chain Analysis
- 4.5 Regulatory Landscape
- 4.6 Technological Outlook
- 4.7 State of Fiber Optics in Key Industries
- 4.8 Porter's Five Forces Analysis
- 4.8.1 Threat of New Entrants
- 4.8.2 Bargaining Power of Suppliers
- 4.8.3 Bargaining Power of Buyers
- 4.8.4 Threat of Substitutes
- 4.8.5 Competitive Rivalry
- 4.9 Impact of Macroeconomic Factors on the Market
5 UNITED STATES MARKET SIZE AND GROWTH FORECASTS (VALUE)
- 5.1 By Cable Type
- 5.1.1 Loose-tube
- 5.1.2 Tight-buffered
- 5.1.3 Ribbon
- 5.1.4 Armoured
- 5.2 By Mode
- 5.2.1 Single-mode
- 5.2.2 Multi-mode
- 5.3 By Deployment Type
- 5.3.1 Underground
- 5.3.2 Aerial
- 5.3.3 Submarine
- 5.4 By End-user Industry
- 5.4.1 Telecommunications
- 5.4.2 Power Utilities
- 5.4.3 Defense and Military
- 5.4.4 Industrial and Manufacturing
- 5.4.5 Medical
- 5.5 By Country
- 5.5.1 United States
- 5.5.2 Germany
- 5.5.3 United Kingdom
- 5.5.4 France
- 5.5.5 Italy
- 5.5.6 Spain
- 5.5.7 Netherlands
- 5.5.8 Austria
- 5.5.9 Switzerland
- 5.5.10 Rest of Europe
6 COMPETITIVE LANDSCAPE
- 6.1 Market Concentration
- 6.2 Strategic Moves
- 6.3 Market Share Analysis
- 6.4 Company Profiles (includes Global level Overview, Market level overview, Core Segments, Financials as available, Strategic Information, Market Rank/Share for key companies, Products and Services, and Recent Developments)
- 6.4.1 Prysmian Group
- 6.4.2 Corning Inc.
- 6.4.3 Nexans SA
- 6.4.4 CommScope Holding Company Inc.
- 6.4.5 Furukawa Electric Co., Ltd.
- 6.4.6 Sumitomo Electric Industries Ltd.
- 6.4.7 Sterlite Technologies Limited
- 6.4.8 Fujikura Ltd.
- 6.4.9 Leoni AG
- 6.4.10 Belden Inc.
- 6.4.11 LS Cable and System
- 6.4.12 HUBER+SUHNER AG
- 6.4.13 Hexatronic Group AB
- 6.4.14 AFL (Fujikura)
- 6.4.15 Optical Cable Corp.
- 6.4.16 Coherent Corp. (Finisar Corporation)
- 6.4.17 ZTT Group
- 6.4.18 Molex LLC
7 MARKET OPPORTUNITIES AND FUTURE OUTLOOK
- 7.1 White-space and Unmet-need Assessment

 特種光纖電纜市場-全球及區域分析:按應用、產品與國家分類-分析與預測,2026-2036年
 模式調節電纜市場規模、佔有率和成長分析:按電纜類型、連接器類型、應用、最終用戶和地區分類-2026年至2033年產業預測
 光纖電纜:市場佔有率分析、產業趨勢與統計、成長預測(2026-2031)美國光纖電纜:市場佔有率分析、行業趨勢和統計數據以及成長預測(2026-2031 年)
 光纖電纜市場-2026-2032年全球市場預測智慧公路和自動駕駛基礎設施中的光纖電纜:市場佔有率分析、行業趨勢和統計數據以及成長預測(2026-2031 年)鐵路和地鐵基礎設施用光纖電纜:市場佔有率分析、行業趨勢和統計數據以及成長預測(2026-2031 年)
 2026-2030年全球軍用級光纖電纜市場
 光纖電纜市場商機、成長要素、產業趨勢分析及2026-2035年預測
 光纖電纜市場預測至2034年—按光纖類型、電纜類型、安裝類型、應用、最終用戶和地區分類的全球分析