


 |
市場調查報告書
商品編碼
2122277
企業級路由器:市場佔有率分析、產業趨勢與統計、成長預測(2026-2031)Enterprise Routers - Market Share Analysis, Industry Trends & Statistics, Growth Forecasts (2026 - 2031) |
||||||

※ 本網頁內容可能與最新版本有所差異。詳細情況請與我們聯繫。
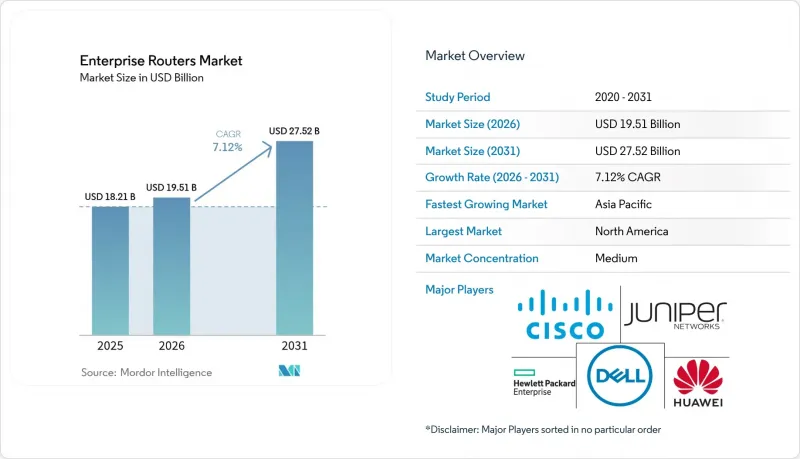
據 Mordor Intelligence 稱,2025 年企業路由器市值為 182.1 億美元,預計到 2031 年將達到 275.2 億美元,而 2026 年為 195.1 億美元,預測期(2026-2031 年)的複合年成長率為 7.12%。
本報告按連接方式(有線、無線、混合)、連接埠密度(8 個連接埠或以下、9-24 個連接埠、24 個連接埠以上)、路由器類型(核心路由器、邊緣/匯聚路由器、連接路由器、SD-WAN 設備)、最終用戶產業(銀行、金融服務和保險 (BFSI)、IT 和電信、醫療保健、零售和電子商務、製造業、其他地區)以及電子商務地區進行細分。市場預測以美元 (USD) 為單位。
全球企業路由器市場趨勢與洞察
擴大SD-WAN的應用
軟體定義廣域網路 (SD-WAN) 透過最大限度地降低 MPLS 成本和簡化策略控制,徹底改變了廣域連接的經濟模式。思科在 2025 年第二季的 SD-WAN訂單年增 15%,Catalyst SD-WAN 的基本客群已擴展至超過 5 萬家企業。曾經認為自己無力承擔企業級廣域網路的中型企業,現在可以透過動態路由降低 30-50% 的網路營運成本,同時提升應用程式響應速度。隨著零信任原則主導採購,安全性仍然至關重要,整合防火牆和網路分段已成為路由器供應商的必備功能。 SD-WAN 的平均更新週期為 3-5 年,預計在預測期內將出現重複需求,這種成長勢頭有望持續推動中期市場擴張。
企業雲端遷移激增
一些公司正在整合其 40% 的本地資料中心,同時提高雲端工作負載的密度,並圍繞直接網路存取和多重雲端連接重構其網路。路由器需要動態頻寬管理、精細化的服務品質 (QoS) 以及符合資料主權規則的自動化路由策略管理。對延遲敏感的應用(例如即時分析)擴大採用邊緣路由器,以毫秒級精度確定流量流向,而不是將封包回程傳輸傳到集中式閘道。因此,供應商的藍圖強調雲端閘道器和 API 級編配,以使路由決策與運算位置和合規性標籤保持一致。
供應鏈中晶片長期短缺
支援高階路由平台的專用ASIC晶片供應依然緊張,前置作業時間延長至20-26週,且組件成本不斷上漲。企業正透過採用多供應商框架和簽訂更長的採購合約來應對,但關鍵任務項目仍然被迫推遲。基礎接取路由器受到的影響較小,因為它們可以用更常見的商用晶片替代,但資料中心的核心部件(嚴重依賴最先進的製程節點)正面臨嚴重的晶片短缺。
細分市場分析
到2025年,有線鏈路將佔總收入的63.04%,為需要穩定吞吐量和強大電磁屏蔽的工作負載提供支援。同時,隨著企業追求靈活的樓層平面圖、物聯網感測器網路和園區行動化,無線部署正以8.53%的複合年成長率快速成長。將光纖骨幹網路與Wi-Fi 6E接取結合的混合設計,兼具線連接的可靠性和無線技術的靈活性,可將部署時間縮短高達60%。專用5G網路能夠實現亞毫秒延遲,這在以前只有銅線才能做到,從而促進了工業機器人和自動導引運輸車在工廠車間的應用。
此外,企業在決定採用乙太網路或無線終端時,也會考慮頻段管理、干擾和電池續航力。 Wi-Fi 6E 的 6 GHz 頻段頻道提供了一個新的 1.2 GHz頻寬,減少了競爭,並支援 160 MHz 寬的頻道,其性能可與有線連接媲美。在災害復原中,LTE 和 5G 路由器可確保在固定線路中斷時立即恢復連線。對於無法容忍 POS 系統停機的零售連鎖店而言,這是一項極為重要的功能。企業路由器市場正日益呈現兩極化的趨勢。關鍵任務型應用領域繼續採用光纖,而無線技術則在邊緣和分店環境中更受歡迎,預計在整個預測期內,這兩種需求趨勢將持續存在。
到2025年,9至24埠路由器將佔據企業級路由器市場48.10%的佔有率,這反映了它們在中型伺服器機房中作為主要聚合節點的地位。同時,隨著資料中心營運商整合機架並採用能夠最大限度減少佈線和延遲的雙層葉脊式拓撲結構,擁有24個以上連接埠的平台正以8.01%的複合年成長率快速成長。高密度底盤可將每個連接埠的成本降低高達35%,並釋放寶貴的占地面積,使營運商能夠推遲昂貴的設施擴建。
虛擬化和容器化推動了東西向流量的成長,加速了路由器中400GbE介面的普及,這些路由器能夠部署大量的虛擬連線。同時,邊緣微型資料中心傾向採用緊湊型8埠設計,並針對攝影機和感測器最佳化了PoE供電方案。醫療和金融業對網路分段的監管要求需要連接埠級策略控制,這推動了模組化線路卡的普及,管理員可以根據信任區域分配實體介面。因此,企業路由器市場根據工作負載部署策略的不同,同時需要高密度核心和緊湊型邊緣。
區域分析
預計到2025年,北美將佔據企業路由器市場38.40%的佔有率,這主要得益於其完善的光纖骨幹網、SD-WAN的早期應用以及嚴格的聯邦網路安全指令。隨著政府機構轉向零信任架構以及企業升級設備以提高能源效率,市場需求仍然強勁,儘管與新興地區相比,北美路由器的銷售成長速度有所放緩。加拿大石油、天然氣和採礦業的公司正在採用能夠承受溫度波動和空氣中顆粒物污染的耐環境路由器。
亞太地區預計將成為成長最快的地區,到2031年複合年成長率將達到7.61%,主要得益於5G部署和政府主導的製造業數位轉型。中國的國內技術優先政策正扶持本土路由器OEM廠商,同時也敦促跨國公司實現在地化生產並進行韌體審核。印度的「數位印度」計畫正在推動寬頻網路在農村地區和資料中心走廊的普及,從而促進金融科技、醫療保健和業務流程外包(BPO)等行業對邊緣路由器的應用。日本的「社會5.0」藍圖正在推動對自動化和智慧基礎設施的投資,從而支撐對確定性低延遲路由設備的高需求。
在歐洲,受永續性法規和GDPR資料主權規則的推動,收入穩定成長,促使兼具環保設計和合規保障的本地路由器得到更廣泛的應用。循環經濟獎勵正在促進回收計劃和再生硬體的使用。在拉丁美洲,電信骨幹網和採礦設施的升級改造正在推進,這使得耐高溫硬體的需求日益成長。中東地區(例如阿拉伯聯合大公國和沙烏地阿拉伯)的智慧城市專案需要人工智慧路由器來控制影像分析和物聯網遙測,而非洲國家正開始快速向5G固定無線存取過渡,這刺激了企業分店對整合蜂窩路由器的需求。
其他好處:
- Excel格式的市場預測(ME)表
- 3個月的分析師支持
目錄
第1章:引言
- 研究假設和市場定義
- 調查範圍
第2章:調查方法
第3章執行摘要
第4章 市場狀況
- 市場概覽
- 市場促進因素
- 擴大SD-WAN的應用
- 企業雲端遷移激增
- 邊緣運算流量激增
- 永續性驅動的路由器升級
- 基於人工智慧的意圖網路
- 政府強制要求安全路由
- 市場限制因素
- 半導體供應鏈長期短缺
- 可程式網路領域的技能差距
- 由於SASE導致的同類相食現象擴大。
- 開放原始碼白盒顛覆
- 產業價值鏈分析
- 監理情勢
- 技術展望
- 波特五力分析
- 宏觀經濟因素的影響
第5章 市場規模與成長預測
- 連結性別
- 有線
- 無線的
- 混合
- 按端口密度分類的端口密度
- 8 個連接埠或更少
- 9-24個端口
- 24個或更多端口
- 路由器類型
- 核
- 邊緣/聚合
- 使用權
- SD-WAN 設備
- 按最終用戶行業分類
- BFSI
- IT/通訊
- 衛生保健
- 零售與電子商務
- 製造業
- 政府/國防
- 教育
- 按地區
- 北美洲
- 美國
- 加拿大
- 歐洲
- 德國
- 英國
- 法國
- 俄羅斯
- 其他歐洲國家
- 亞太地區
- 中國
- 印度
- 日本
- 東南亞
- 其他亞太國家
- 南美洲
- 巴西
- 阿根廷
- 其他南美國家
- 中東和非洲
- 中東
- 沙烏地阿拉伯
- 阿拉伯聯合大公國
- 其他中東國家
- 非洲
- 南非
- 奈及利亞
- 其他非洲國家
- 中東
- 北美洲
第6章 競爭情勢
- 市場集中度
- 策略趨勢
- 市佔率分析
- 公司簡介
- Cisco Systems Inc.
- Juniper Networks Inc.
- Huawei Technologies Co. Ltd.
- Hewlett Packard Enterprise Co.
- Dell Technologies Inc.
- Nokia Corp.
- Arista Networks Inc.
- Extreme Networks Inc.
- Ubiquiti Inc.
- Fortinet Inc.
- Netgear Inc.
- Check Point Software Technologies Ltd.
- Palo Alto Networks Inc.
- Edgecore Networks Corp.
- ZTE Corp.
- TP-Link Technologies Co. Ltd.
- MikroTik LS
- Riverbed Technology LLC
- Ciena Corp.
- Adtran Inc.
- Versalink International Ltd.
第7章 市場機會與未來展望
According to Mordor Intelligence, the enterprise routers market size was valued at USD 18.21 billion in 2025 and estimated to grow from USD 19.51 billion in 2026 to reach USD 27.52 billion by 2031, at a CAGR of 7.12% during the forecast period (2026-2031).
This report is Segmented by Connectivity (Wired, Wireless, and Hybrid), Port Density (less Than or Equal To 8 Ports, 9-24 Ports, and Above 24 Ports), Router Type (Core, Edge/Aggregation, Access, and SD-WAN Appliance), End-User Industry (BFSI, IT and Telecom, Healthcare, Retail and E-Commerce, Manufacturing, and More), and Geography. The Market Forecasts are Provided in Terms of Value (USD).
Global Enterprise Routers Market Trends and Insights
Growing SD-WAN Adoption
Software-defined WAN has altered the economics of wide-area connectivity by minimizing MPLS spend and simplifying policy control. Cisco processed a 15% year-over-year increase in SD-WAN product orders during Q2 2025, bringing its Catalyst SD-WAN customer base above 50,000 enterprises. Mid-market organizations that once deemed enterprise-grade WAN unaffordable can now trim network operating expenses by 30-50% while improving application response through dynamic path selection. Security remains integral as zero-trust principles steer procurement, making integrated firewalls and segmentation table-stakes for router vendors. The momentum is likely to sustain medium-term market expansion because SD-WAN refresh cycles average three to five years, creating repeat demand within the forecast horizon.
Surge in Enterprise Cloud Migration
Enterprises consolidating on-premises data centers by 40% while elevating cloud workload density are re-architecting networks around direct internet access and multi-cloud links. Routers must manage dynamic bandwidth, granular QoS, and automated route policies that honor data-sovereignty rules. Latency-sensitive apps such as real-time analytics are encouraging edge routers that decide traffic flows in milliseconds rather than backhauling packets to centralized gateways. Vendor roadmaps therefore emphasize cloud gateways and API-level orchestration that align route decisions with compute location and compliance tags.
Persistent Supply-Chain Chip Shortages
Specialized ASICs powering high-end routing platforms remain in tight supply, stretching lead times to 20-26 weeks and inflating component costs. Enterprises respond by adopting multi-vendor frameworks and committing to longer procurement contracts, yet mission-critical projects still face deferrals. Basic access routers see smaller impact because they can swap in more common merchant silicon, but data-center cores experience acute shortages due to cutting-edge process node dependence.
Other drivers and restraints analyzed in the detailed report include:
- Edge-Compute Traffic Explosion
- Sustainability-Driven Router Refresh
- Rising SASE Cannibalization
For complete list of drivers and restraints, kindly check the Table Of Contents.
Segment Analysis
Wired links captured 63.04% of 2025 revenue, underpinning workloads that demand deterministic throughput and strong electromagnetic shielding. Simultaneously, wireless deployments are gaining an 8.53% CAGR as companies pursue flexible floorplans, IoT sensor grids, and campus mobility. Hybrid designs that marry fiber backbones with Wi-Fi 6E access deliver the reliability of cable and the agility of radio, shrinking deployment timelines by up to 60%. Private 5G networks now achieve sub-millisecond latency once reserved for copper links, unleashing industrial robots and autonomous guided vehicles across factory floors.
Enterprises also weigh spectrum governance, interference, and battery life in deciding between Ethernet and wireless endpoints. Wi-Fi 6E's 6 GHz channels supply 1.2 GHz of fresh spectrum, reducing contention and enabling 160 MHz-wide channels that approximate cabled performance. For disaster recovery, LTE and 5G routers furnish immediate connectivity when terrestrial lines fail, a feature prized by retail chains that cannot tolerate point-of-sale downtime. The enterprise routers market continues to bifurcate: mission-critical segments stay on fiber while edge and branch environments adopt radio first, sustaining parallel demand paths across the forecast horizon.
Routers with 9-24 ports held a 48.10% enterprise routers market share in 2025, reflecting their role as workhorse aggregation nodes in medium server closets. Yet platforms exceeding 24 ports are expanding at 8.01% CAGR as data-center operators consolidate racks and strive for two-tier leaf-spine topologies that minimize cabling and latency. High-density chassis reduce per-port costs by up to 35% and free valuable floor space, allowing operators to defer expensive building expansions.
Virtualization and containerization have magnified east-west traffic, driving 400GbE interface adoption on routers that can fan out numerous virtual connections. Conversely, edge micro-data centers advocate compact eight-port designs with PoE profiles tailored for cameras and sensors. Regulatory demands for network segmentation in healthcare and finance require port-level policy control, encouraging modular line-cards that let administrators allocate physical interfaces by trust zone. The enterprise routers market therefore supports simultaneous demand for dense cores and compact edges, depending on workload placement strategies.
Complete Report Scope:
- By Connectivity
- Wired
- Wireless
- Hybrid
- By Port Density
- less than or equal to 8 Ports
- 9 - 24 Ports
- above 24 Ports
- By Router Type
- Core
- Edge / Aggregation
- Access
- SD-WAN Appliance
- By End-user Industry
- BFSI
- IT and Telecom
- Healthcare
- Retail and E-commerce
- Manufacturing
- Government and Defense
- Education
- By Geography
- North America
- United States
- Canada
- Europe
- Germany
- United Kingdom
- France
- Russia
- Rest of Europe
- Asia Pacific
- China
- India
- Japan
- South-East Asia
- Rest of Asia Pacific
- South America
- Brazil
- Argentina
- Rest of South America
- Middle East and Africa
- Middle East
- Saudi Arabia
- United Arab Emirates
- Rest of Middle East
- Africa
- South Africa
- Nigeria
- Rest of Africa
- Middle East
- North America
Geography Analysis
North America commanded a 38.40% enterprise routers market share in 2025 on the back of established fiber backbones, early SD-WAN adoption, and stringent federal cybersecurity directives. Demand persists as agencies migrate toward zero-trust architectures and enterprises refresh for energy efficiency, though unit growth slows relative to emerging regions. Canadian enterprises in oil, gas, and mining adopt ruggedized routers rated for temperature swings and airborne particulates.
Asia Pacific is the fastest-growing territory at a 7.61% CAGR through 2031, buoyed by 5G buildouts and state-sponsored manufacturing digitization. China's policy of indigenous technology preference nurtures domestic router OEMs while compelling multinationals to localize production and firmware audits. India's Digital India program fosters broadband to rural districts and data-center corridors, catalyzing edge-router installations across fintech, healthcare, and BPO verticals. Japan's Society 5.0 roadmap spurs investments in automation and smart infrastructure, sustaining premium demand for deterministic and low-latency routing gear.
Europe exhibits steady revenue progression anchored in sustainability regulations and GDPR-driven data-sovereignty rules, prompting on-premises router deployments that pair green design with compliance guarantees. Circular-economy incentives encourage take-back schemes and refurbished hardware. Latin America upgrades telco backbones and mining operations, favoring high-temperature tolerant hardware. Middle Eastern smart-city programs in the UAE and Saudi Arabia require AI-enabled routers to direct video analytics and IoT telemetry, while African nations begin leapfrogging to 5G fixed-wireless access, sparking demand for integrated cellular routers in enterprise branches.
- Cisco Systems Inc.
- Juniper Networks Inc.
- Huawei Technologies Co. Ltd.
- Hewlett Packard Enterprise Co.
- Dell Technologies Inc.
- Nokia Corp.
- Arista Networks Inc.
- Extreme Networks Inc.
- Ubiquiti Inc.
- Fortinet Inc.
- Netgear Inc.
- Check Point Software Technologies Ltd.
- Palo Alto Networks Inc.
- Edgecore Networks Corp.
- ZTE Corp.
- TP-Link Technologies Co. Ltd.
- MikroTik LS
- Riverbed Technology LLC
- Ciena Corp.
- Adtran Inc.
- Versalink International Ltd.
Additional Benefits:
- The market estimate (ME) sheet in Excel format
- 3 months of analyst support
TABLE OF CONTENTS
1 INTRODUCTION
- 1.1 Study Assumptions and Market Definition
- 1.2 Scope of the Study
2 RESEARCH METHODOLOGY
3 EXECUTIVE SUMMARY
4 MARKET LANDSCAPE
- 4.1 Market Overview
- 4.2 Market Drivers
- 4.2.1 Growing SD-WAN adoption
- 4.2.2 Surge in enterprise cloud migration
- 4.2.3 Edge-compute traffic explosion
- 4.2.4 Sustainability-driven router refresh
- 4.2.5 AI-driven intent-based networking
- 4.2.6 Government secure-routing mandates
- 4.3 Market Restraints
- 4.3.1 Persistent supply-chain chip shortages
- 4.3.2 Skill-gap in programmable networking
- 4.3.3 Rising SASE cannibalisation
- 4.3.4 Open-source white-box disruption
- 4.4 Industry Value Chain Analysis
- 4.5 Regulatory Landscape
- 4.6 Technological Outlook
- 4.7 Porter's Five Forces Analysis
- 4.7.1 Threat of New Entrants
- 4.7.2 Bargaining Power of Buyers
- 4.7.3 Bargaining Power of Suppliers
- 4.7.4 Threat of Substitutes
- 4.7.5 Competitive Rivalry
- 4.8 Impact of Macroeconomic Factors
5 MARKET SIZE AND GROWTH FORECASTS (VALUE)
- 5.1 By Connectivity
- 5.1.1 Wired
- 5.1.2 Wireless
- 5.1.3 Hybrid
- 5.2 By Port Density
- 5.2.1 less than or equal to 8 Ports
- 5.2.2 9 - 24 Ports
- 5.2.3 above 24 Ports
- 5.3 By Router Type
- 5.3.1 Core
- 5.3.2 Edge / Aggregation
- 5.3.3 Access
- 5.3.4 SD-WAN Appliance
- 5.4 By End-user Industry
- 5.4.1 BFSI
- 5.4.2 IT and Telecom
- 5.4.3 Healthcare
- 5.4.4 Retail and E-commerce
- 5.4.5 Manufacturing
- 5.4.6 Government and Defense
- 5.4.7 Education
- 5.5 By Geography
- 5.5.1 North America
- 5.5.1.1 United States
- 5.5.1.2 Canada
- 5.5.2 Europe
- 5.5.2.1 Germany
- 5.5.2.2 United Kingdom
- 5.5.2.3 France
- 5.5.2.4 Russia
- 5.5.2.5 Rest of Europe
- 5.5.3 Asia Pacific
- 5.5.3.1 China
- 5.5.3.2 India
- 5.5.3.3 Japan
- 5.5.3.4 South-East Asia
- 5.5.3.5 Rest of Asia Pacific
- 5.5.4 South America
- 5.5.4.1 Brazil
- 5.5.4.2 Argentina
- 5.5.4.3 Rest of South America
- 5.5.5 Middle East and Africa
- 5.5.5.1 Middle East
- 5.5.5.1.1 Saudi Arabia
- 5.5.5.1.2 United Arab Emirates
- 5.5.5.1.3 Rest of Middle East
- 5.5.5.2 Africa
- 5.5.5.2.1 South Africa
- 5.5.5.2.2 Nigeria
- 5.5.5.2.3 Rest of Africa
- 5.5.5.1 Middle East
- 5.5.1 North America
6 COMPETITIVE LANDSCAPE
- 6.1 Market Concentration
- 6.2 Strategic Moves
- 6.3 Market Share Analysis
- 6.4 Company Profiles (includes Global Overview, Market Overview, Core Segments, Financials, Strategic Info, Market Rank/Share, Products and Services, Recent Developments)
- 6.4.1 Cisco Systems Inc.
- 6.4.2 Juniper Networks Inc.
- 6.4.3 Huawei Technologies Co. Ltd.
- 6.4.4 Hewlett Packard Enterprise Co.
- 6.4.5 Dell Technologies Inc.
- 6.4.6 Nokia Corp.
- 6.4.7 Arista Networks Inc.
- 6.4.8 Extreme Networks Inc.
- 6.4.9 Ubiquiti Inc.
- 6.4.10 Fortinet Inc.
- 6.4.11 Netgear Inc.
- 6.4.12 Check Point Software Technologies Ltd.
- 6.4.13 Palo Alto Networks Inc.
- 6.4.14 Edgecore Networks Corp.
- 6.4.15 ZTE Corp.
- 6.4.16 TP-Link Technologies Co. Ltd.
- 6.4.17 MikroTik LS
- 6.4.18 Riverbed Technology LLC
- 6.4.19 Ciena Corp.
- 6.4.20 Adtran Inc.
- 6.4.21 Versalink International Ltd.
7 MARKET OPPORTUNITIES AND FUTURE OUTLOOK
- 7.1 White-space and Unmet-need Assessment

 住宅路由器:市場佔有率分析、產業趨勢與統計、成長預測(2026-2031)
 CNC雕刻機市場-2026-2032年全球市場預測智慧路由器市場:依路由器類型、技術標準、應用、通路和最終用戶分類-2026-2032年全球市場預測中小企業路由器:市場佔有率分析、產業趨勢與統計及成長預測(2026-2031 年)分支路由器:市場佔有率分析、行業趨勢和統計數據、成長預測(2026-2031 年)工業路由器市場:2026-2032年全球市場預測(依產品類型、連接技術、部署環境、最終用戶產業及銷售管道)核心路由器:市場佔有率分析、行業趨勢和統計數據、成長預測(2026-2031 年)網路路由器:市場佔有率分析、產業趨勢與統計、成長預測(2026-2031)路由器:市場佔有率分析、行業趨勢和統計數據、成長預測(2026-2031 年)
 2026年全球電信級路由市場報告