


 |
市場調查報告書
商品編碼
2073067
網路路由器:市場佔有率分析、產業趨勢與統計、成長預測(2026-2031)Network Router - Market Share Analysis, Industry Trends & Statistics, Growth Forecasts (2026 - 2031) |
||||||

※ 本網頁內容可能與最新版本有所差異。詳細情況請與我們聯繫。
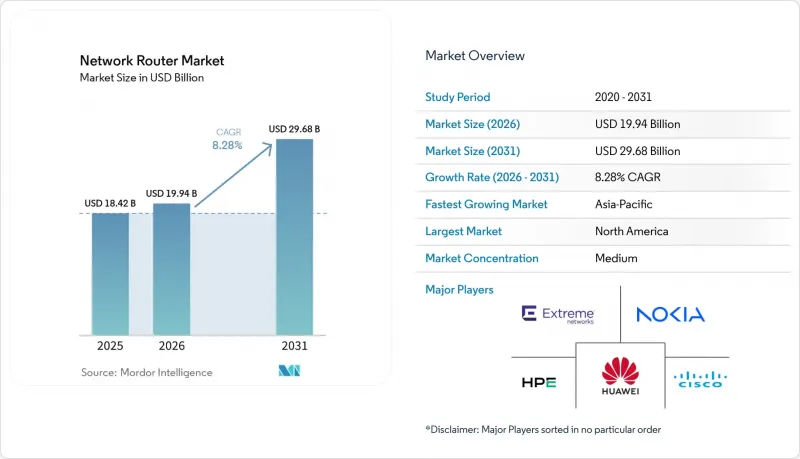
根據 Mordor Intelligence 預測,網路路由器市場規模將從 2025 年的 184.2 億美元和 2026 年的 199.4 億美元成長到 2031 年的 296.8 億美元,2026 年至 2031 年的複合年成長率為 8.28%。
本報告按網路層(接入路由器、匯聚路由器、核心路由器及其他)、效能等級(低吞吐量、中吞吐量及其他)、企業規模(大型企業、中小企業)、最終用戶行業(銀行、金融服務和保險 (BFSI)、IT 和電信、製造業、政府和公共部門、醫療保健和生命科學及其他)以及地區進行細分。市場預測以美元 (USD) 為單位。
全球網路路由器市場趨勢與洞察
資料中心 IP 流量增加
為了支援生成式人工智慧叢集交換Petabyte級梯度更新,超大規模資料中心和託管設施正在不斷擴展,從而推動了對能夠以亞微秒延遲傳輸400 GbE和800 GbE流量的路由器的需求。思科預測,到2026年,全球資料中心的IP流量將超過每年20澤字節,其中人工智慧工作負載預計將佔大部分。因此,通訊業者優先考慮整合遙測引擎並支援無損擁塞控制的可程式晶片,以確保混合精度張量的確定性效能。隨著邊緣節點與集中式參數伺服器同步,分散式推理進一步增加了東西向流量。為了因應此趨勢,路由器廠商正在整合無需再生即可覆蓋80公里的連貫光子技術,從而簡化城域網路架構。所有這些特性共同維持了高基數底盤在網路路由器市場的核心地位,使其價格居高不下。
快速部署5G回程傳輸需要高容量路由器
行動網路業者升級到5G獨立組網架構時,需要聚合峰值超過10Gbps的行動通訊基地台流量。中國移動的目標是到2025年建成超過400萬個5G基地台,而MTN集團已宣佈在17個非洲國家投資10億美元用於5G部署。因此,回程傳輸路由器需要分段路由和靈活的乙太網路介面,以便為自動駕駛車輛遙測、工業自動化和增強型行動寬頻等應用分類頻寬。無法證明其與Open RAN互通性的供應商可能會被排除在政府資助的頻率分配之外。回程傳輸容量的激增導致對高容量平台的持續訂單,並推動了新興地區網路路由器市場的擴張。
先進ASIC晶片的供應鏈波動
由於汽車、行動和人工智慧加速器都在爭奪尖端製程節點,晶圓代工廠產能持續緊張,路由器專用積體電路(ASIC)的前置作業時間已延長至40週以上,預計到2025年初,高頻寬記憶體的價格將比去年同期上漲超過30%。儘管供應商正透過跨多家晶圓代工廠的雙源策略來規避風險,但中型供應商卻難以獲得優先配額,這給它們的毛利率帶來了壓力。基於晶片組(Chiplet)的設計將轉發、遙測和加密引擎分離,這增加了封裝的複雜性,並造成了進一步的瓶頸。這些趨勢限制了短期出貨量,並抑制了原本強勁的網路路由器市場規模前景。
細分市場分析
到 2025 年,邊緣路由器將佔據網路路由器市場 36.48% 的佔有率,鞏固其作為企業區域網路 (LAN) 和營運商廣域網路 (WAN) 之間關鍵邊界的地位。這些設備將防火牆、VPN 和應用程式感知路由功能整合到緊湊的外形規格中,無需現場工程師即可在分公司部署。基於雲端的控制器可實現零接觸設置,使其對沒有專門網路負責人的零售商和遠端園區極具吸引力。聚合路由器定位更高一級,支援需要本地封包聚合的邊緣運算工作負載,預計其複合年成長率 (CAGR) 將達到 9.62%。分段路由和靈活的乙太網路介面現已成為標準配置,可對工業感測器和自動駕駛車輛進行確定性控制,從而推動中端平台網路路由器市場規模的成長。
核心路由器優先考慮吞吐量和連接埠密度,是建立每秒數百Terabit超大規模骨幹網路的基礎。接入路由器雖然規模較小,但整合了被動光終端和LTE鏈路,填補了最後一公里的空白。連貫可插拔技術使路由器能夠直接調製波長,消除了傳統的層邊界,也無需為都會區網路配備獨立的轉發器。這種路由光方案降低了5G回程傳輸和資料中心連結的延遲,擴展了網路路由器市場中匯聚和邊緣平台的應用場景。
主導到2025年,吞吐量在1至10 Gbps之間的中等吞吐量系統將佔據38.92%的銷售佔有率,推動分店和園區部署。然而,隨著超超大規模資料中心業者升級到吞吐量超過100 Gbps的路由器,以及400 GbE和800 GbE光學模組價格降至每Gigabit0.5美元以下,預計該細分市場將以11.84%的複合年成長率成長。人工智慧訓練網路需要在數千個GPU之間交換梯度更新,這導致低速網路架構飽和,迫使網路轉向採用片上遙測和無損擁塞控制的高基數設計。這些特性,加上傳輸距離超過80公里的連貫光學模組,正在擴大網路路由器市場中超高吞吐量細分市場。
10-100Gbps 級路由器為中型企業和區域通訊業者提供了成本和效能的最佳化平衡。單機框架單位(SRU) 平台現在能夠提供以前只有多底盤系統才能實現的總頻寬,從而減少資料中心的面積和冷卻負載。 1Gbps 或更低吞吐量的路由器仍用於物聯網閘道和電力預算有限的小規模辦公室。可程式網路處理器 (PNP) 和 FPGA 擴大承擔加密和深度套件偵測 (DPI) 處理任務,同時保持傳輸平面的速度。連貫DSP 成本的降低進一步推動了高容量介面的普及,並加速了向更高效能的過渡。
區域分析
北美擁有全球最集中的超大規模資料中心,企業級SD-WAN應用廣泛,預計到2025年將佔全球收入的35.12%。美國的BEAD計畫正在資助服務欠缺地區的光纖鋪設,從而推動了對本地交換器匯聚路由器的需求。在加拿大和墨西哥,隨著汽車和電子產業的回流,跨境連接正在現代化,這推動了對低延遲連線的需求。南美洲受外匯波動和進口限制的影響,對價格較為敏感,但巴西在該地區部署方面處於領先地位,主要運營商正在推進5G獨立組網核心網的部署。
亞太地區預計將以10.44%的複合年成長率成長,成為網路路由器市場成長最快的細分市場。中國正邁向5G-Advanced時代,預計到2025年,其5G基地台數量將超過400萬,將推動核心網路和匯聚網的升級。印度斥資1.3兆美元的數位基礎設施計畫正在支援大規模光纖回程傳輸傳至鄉村地區,需要數萬台緊湊型匯聚路由器。日本正在投資5G之後的兆赫回程傳輸,用於匯集多Gigabit無線流量的路由器的測試和部署工作正在穩步推進。澳洲和紐西蘭正在聯合資助農村寬頻發展,而印尼和越南則在資料中心領域吸引外國直接投資(FDI),從而帶動了大規模的脊葉式路由器訂單。
在歐洲,為回應「數位十年」2030年實現Gigabit存取的指南,各國正努力平衡區域政策與各自國情。德國、英國和法國仍然是最大的買家,優先為其關鍵基礎設施購買「安全設計」路由器。制裁限制了俄羅斯,加速了其國內半導體替代方案的研發。在中東,石油收入正被投資於智慧城市項目,沙烏地阿拉伯和阿拉伯聯合大公國的自動駕駛和監控網路均指定使用路由器。非洲的需求主要集中在南非和奈及利亞,但由於貨幣波動和電力基礎設施不足,中東和非洲其他地區的採用速度緩慢。為此,全球供應商正在建立區域服務中心,以滿足在地採購需求並最大限度地減少運輸延誤,從而擴大網路路由器的潛在市場。
其他好處
- Excel格式的市場預測(ME)表
- 3個月的分析師支持
目錄
第1章:引言
- 研究假設和市場定義
- 調查範圍
第2章:調查方法
第3章執行摘要
第4章 市場狀況
- 市場概覽
- 市場促進因素
- 資料中心 IP 流量增加
- 快速部署5G回程傳輸需要高容量路由器
- 企業向 SD-WAN 架構遷移
- 政府寬頻推廣政策
- 邊緣運算正在催生對緊湊型聚合路由器的需求。
- 透過引入開放原始碼網路作業系統來減少供應商鎖定。
- 市場限制因素
- 先進ASIC的供應鏈波動
- 網路安全合規成本不斷上升
- 網路自動化技能人才短缺
- 高階矽晶片的出口受到地緣政治限制
- 產業價值/價值鏈分析
- 監理情勢
- 技術展望
- 宏觀經濟因素對市場的影響
- 波特五力分析
第5章 市場規模與成長預測
- 網路層
- 存取路由器
- 聚合路由器
- 核心路由器
- 邊緣路由器
- 性能等級
- 低吞吐量(低於 1 Gbps)
- 中等吞吐量(1-10 Gbps)
- 高吞吐量(10-100 Gbps)
- 超高吞吐量(超過 100 Gbps)
- 按公司規模
- 大公司
- 小型企業
- 按最終用戶行業分類
- BFSI
- IT/通訊
- 製造業
- 政府/公共部門
- 醫療保健和生命科學
- 零售與電子商務
- 教育
- 其他
- 按地區
- 北美洲
- 美國
- 加拿大
- 墨西哥
- 南美洲
- 巴西
- 阿根廷
- 其他南美國家
- 歐洲
- 德國
- 英國
- 法國
- 義大利
- 西班牙
- 俄羅斯
- 其他歐洲國家
- 亞太地區
- 中國
- 日本
- 印度
- 韓國
- 澳洲和紐西蘭
- 其他亞太國家
- 中東
- 沙烏地阿拉伯
- 阿拉伯聯合大公國
- 其他中東國家
- 非洲
- 南非
- 奈及利亞
- 其他非洲地區
- 北美洲
第6章 競爭情勢
- 市場集中度
- 策略趨勢
- 市佔率分析
- 公司簡介
- Cisco Systems, Inc.
- Huawei Technologies Co., Ltd.
- Nokia Corporation
- Hewlett Packard Enterprise Company
- Extreme Networks, Inc.
- Arista Networks, Inc.
- TP-Link Technologies Co., Ltd.
- Netgear, Inc.
- D-Link Corporation
- Zyxel Communications Corporation
- Ubiquiti Inc.
- MikroTikls SIA
- Edgecore Networks Corporation
- Ruijie Networks Co., Ltd.
- Fortinet, Inc.
- Linksys Holdings, Inc.
- DrayTek Corp.
- Allied Telesis Holdings KK
- ADTRAN Holdings, Inc.
- Cambium Networks Corporation
- Peplink International Limited
- Dell Technologies Inc.
- Commscope Holding Company, Inc.
- Palo Alto Networks, Inc.
第7章 市場機會與未來展望
According to Mordor Intelligence, the network router market size is projected to expand from USD 18.42 billion in 2025 and USD 19.94 billion in 2026 to USD 29.68 billion by 2031, registering a CAGR of 8.28% between 2026 and 2031.
This report is Segmented by Network Layer (Access Routers, Aggregation Routers, Core Routers, and More), Performance Tier (Low Throughput, Mid Throughput, and More), Enterprise Size (Large Enterprises, and SMEs), End User Industry (BFSI, IT and Telecom, Manufacturing, Government and Public Sector, Healthcare and Lifesciences, and More), and Geography. The Market Forecasts are Provided in Terms of Value (USD).
Global Network Router Market Trends and Insights
Growing IP Traffic Volume in Data Centers
Hyperscale and colocation facilities are scaling to support generative-AI clusters that exchange petabytes of gradient updates, driving demand for routers that forward 400 GbE and 800 GbE traffic with sub-microsecond latency. Cisco projects global data-center IP traffic will surpass 20 zettabytes annually by 2026, with AI workloads accounting for an outsized share. Operators therefore prioritize programmable silicon that embeds telemetry engines and supports lossless congestion control, ensuring deterministic performance for mixed-precision tensors. Distributed inference further increases east-west traffic as edge nodes synchronize with centralized parameter servers. Router vendors responding to this pattern are integrating coherent optics that span 80 km without regeneration, simplifying metro fabrics. These capabilities collectively sustain premium pricing for high-radix chassis at the core of the network router market.
Rapid 5 G Backhaul Deployment Requiring High-Capacity Routers
Mobile network operators upgrading to 5 G standalone architectures must aggregate cell-site traffic that now peaks above 10 Gbps per sector. China Mobile crossed 4 million 5 G base stations by 2025, while MTN Group committed USD 1 billion for 5 G across 17 African countries. Backhaul routers consequently need segment routing and flexible Ethernet interfaces to slice bandwidth for autonomous-vehicle telemetry, industrial automation, and enhanced mobile broadband. Vendors unable to demonstrate Open RAN interoperability risk exclusion from government-funded spectrum awards. The surge in backhaul capacity translates into sustained orders for high-capacity platforms, adding momentum to the network router market size growth in emerging regions.
Supply Chain Volatility for Advanced ASICs
Foundry capacity remains tight because automotive, mobile, and AI accelerators compete for leading-edge nodes, stretching router ASIC lead times beyond 40 weeks and inflating high-bandwidth-memory prices by over 30% year-over-year in early 2025. Vendors hedge through dual-source strategies across multiple foundries, yet mid-tier suppliers struggle to secure priority allocations, compressing gross margins. Chiplet-based designs that disaggregate forwarding, telemetry, and crypto engines add packaging complexity and expose additional choke points. These dynamics curtail near-term shipment volumes and temper the otherwise robust outlook for the network router market size.
Other drivers and restraints analyzed in the detailed report include:
- Enterprise Shift to SD-WAN Architectures
- Government Broadband Stimulus Programs
- Rising Cyber-Security Compliance Costs
For complete list of drivers and restraints, kindly check the Table Of Contents.
Segment Analysis
Edge routers accounted for 36.48% of the network router market share in 2025, confirming their role as the critical demarcation point between enterprise LANs and carrier WANs. These devices fold firewall, VPN, and application-aware routing into compact formats that branch offices can deploy without on-site engineers. Cloud-based controllers automate zero-touch setup, appealing to retailers and remote campuses that lack full-time networking staff. Aggregation routers sit one tier upstream and are projected to register a 9.62% CAGR, supported by edge-computing workloads that require localized packet consolidation. Segment routing and flexible Ethernet interfaces are now standard, enabling deterministic control for industrial sensors and autonomous vehicles and bolstering the network router market size for mid-tier platforms.
Core routers emphasize sheer throughput and port density, anchoring hyperscale spines at hundreds of terabits per second. Access routers, although more modest, are integrating passive-optical termination and LTE links to backfill last-mile gaps. Coherent pluggables now allow routers to modulate wavelengths directly, collapsing traditional layer boundaries and eliminating separate transponders for metro networks. This routed-optical approach reduces latency in 5 G backhaul and inter-data-center links, expanding use cases for aggregation and edge platforms across the network router market.
Mid-throughput systems ranging from 1 Gbps to 10 Gbps held 38.92% revenue share in 2025, dominating branch and campus installations. Hyperscalers, however, are upgrading to routers exceeding 100 Gbps, a tier forecast to grow at an 11.84% CAGR as 400 GbE and 800 GbE optics drop below USD 0.50 per gigabit. AI training networks that exchange gradient updates across thousands of GPUs saturate lower-speed fabrics, forcing a shift toward high-radix designs with on-chip telemetry and lossless congestion control. These capabilities, combined with coherent optics that maintain reach beyond 80 km, are expanding the ultra-high-throughput slice of the network router market.
Routers in the 10 Gbps to 100 Gbps bracket bridge cost and performance for mid-sized enterprises and regional carriers. Single-rack-unit platforms now deliver aggregate bandwidth once reserved for multi-chassis systems, shrinking data-center footprints and cooling loads. Low-throughput routers below 1 Gbps persist in IoT gateways and small offices where power budgets are tight. Programmable network processors and FPGAs are increasingly offloading encryption and DPI, preserving forwarding-plane speed. The declining cost of coherent DSPs further democratizes high-capacity interfaces, accelerating migration up the performance ladder.
Complete Report Scope:
- By Network Layer
- Access Routers
- Aggregation Routers
- Core Routers
- Edge Routers
- By Performance Tier
- Low Throughput (<1 Gbps)
- Mid Throughput (1-10 Gbps)
- High Throughput (10-100 Gbps)
- Ultra-High (>100 Gbps)
- By Enterprise Size
- Large Enterprises
- SMEs
- By End User Industry
- BFSI
- IT and Telecom
- Manufacturing
- Government and Public Sector
- Healthcare and Lifesciences
- Retail and E-commerce
- Education
- Other End User Industries
- By Geography
- North America
- United States
- Canada
- Mexico
- South America
- Brazil
- Argentina
- Rest of South America
- Europe
- Germany
- United Kingdom
- France
- Italy
- Spain
- Russia
- Rest of Europe
- Asia-Pacific
- China
- Japan
- India
- South Korea
- Australia and New Zealand
- Rest of Asia-Pacific
- Middle East
- Saudi Arabia
- United Arab Emirates
- Rest of Middle East
- Africa
- South Africa
- Nigeria
- Rest of Africa
- North America
Geography Analysis
North America retained 35.12% of 2025 revenue, anchored by the world's highest concentration of hyperscale data centers and enterprise SD-WAN adoption. The United States BEAD program is funding fiber builds in underserved counties, pulling demand for aggregation routers into rural exchanges. Canada and Mexico are modernizing cross-border corridors as reshoring in automotive and electronics drives demand for low-latency connectivity. Currency swings and import rules in South America create price sensitivity, yet Brazil leads regional deployments, where major carriers roll out 5G standalone cores.
Asia-Pacific is expected to post a 10.44% CAGR, making it the fastest-growing slice of the network router market. China surpassed 4 million 5G base stations by 2025 and is transitioning to 5G-Advanced, which drives core and aggregation upgrades. India's USD 1.3 trillion digital infrastructure plan underpins mass fiber backhaul to villages, requiring tens of thousands of compact aggregation routers. Japan invests in beyond-5 G terahertz backhaul, prompting trials of routers that aggregate multi-gigabit wireless flows. Australia and New Zealand co-fund rural broadband, while Indonesia and Vietnam attract data-center FDI that triggers large spine-and-leaf orders.
Europe balances continent-wide policy with national preferences under the Digital Decade mandate for gigabit access by 2030. Germany, the United Kingdom, and France remain the largest buyers, each emphasizing secure-by-design routers for critical infrastructure. Sanctions constrain Russia, encouraging domestic silicon substitutes. The Middle East funnels oil revenue into smart-city projects, with Saudi Arabia and the United Arab Emirates specifying routers for autonomous transport and surveillance grids. Africa's volume is concentrated in South Africa and Nigeria, but currency volatility and limited power infrastructure slow adoption elsewhere. Global suppliers respond by opening regional service hubs to satisfy local-content clauses and minimize shipping delays, actions that expand their addressable network router market.
- Cisco Systems, Inc.
- Huawei Technologies Co., Ltd.
- Nokia Corporation
- Hewlett Packard Enterprise Company
- Extreme Networks, Inc.
- Arista Networks, Inc.
- TP-Link Technologies Co., Ltd.
- Netgear, Inc.
- D-Link Corporation
- Zyxel Communications Corporation
- Ubiquiti Inc.
- MikroTikls SIA
- Edgecore Networks Corporation
- Ruijie Networks Co., Ltd.
- Fortinet, Inc.
- Linksys Holdings, Inc.
- DrayTek Corp.
- Allied Telesis Holdings K.K.
- ADTRAN Holdings, Inc.
- Cambium Networks Corporation
- Peplink International Limited
- Dell Technologies Inc.
- Commscope Holding Company, Inc.
- Palo Alto Networks, Inc.
Additional Benefits:
- The market estimate (ME) sheet in Excel format
- 3 months of analyst support
TABLE OF CONTENTS
1 INTRODUCTION
- 1.1 Study Assumptions and Market Definition
- 1.2 Scope of the Study
2 RESEARCH METHODOLOGY
3 EXECUTIVE SUMMARY
4 MARKET LANDSCAPE
- 4.1 Market Overview
- 4.2 Market Drivers
- 4.2.1 Growing IP Traffic Volume in Data Centers
- 4.2.2 Rapid 5G Backhaul Deployment Requiring High-Capacity Routers
- 4.2.3 Enterprise Shift to SD-WAN Architectures
- 4.2.4 Government Broadband Stimulus Programs
- 4.2.5 Edge Computing Creating Demand for Compact Aggregation Routers
- 4.2.6 Open-Source NOS Adoption Reducing Vendor Lock-In
- 4.3 Market Restraints
- 4.3.1 Supply Chain Volatility for Advanced ASICs
- 4.3.2 Rising Cyber-security Compliance Costs
- 4.3.3 Talent Shortage in Network Automation Skill Sets
- 4.3.4 Geopolitical Export Controls on High-End Silicon
- 4.4 Industry Value / Supply-Chain Analysis
- 4.5 Regulatory Landscape
- 4.6 Technological Outlook
- 4.7 Impact of Macroeconomic Factors on the Market
- 4.8 Porter's Five Forces Analysis
- 4.8.1 Threat of New Entrants
- 4.8.2 Bargaining Power of Suppliers
- 4.8.3 Bargaining Power of Buyers
- 4.8.4 Threat of Substitutes
- 4.8.5 Intensity of Competitive Rivalry
5 MARKET SIZE AND GROWTH FORECASTS (VALUE)
- 5.1 By Network Layer
- 5.1.1 Access Routers
- 5.1.2 Aggregation Routers
- 5.1.3 Core Routers
- 5.1.4 Edge Routers
- 5.2 By Performance Tier
- 5.2.1 Low Throughput (<1 Gbps)
- 5.2.2 Mid Throughput (1-10 Gbps)
- 5.2.3 High Throughput (10-100 Gbps)
- 5.2.4 Ultra-High (>100 Gbps)
- 5.3 By Enterprise Size
- 5.3.1 Large Enterprises
- 5.3.2 SMEs
- 5.4 By End User Industry
- 5.4.1 BFSI
- 5.4.2 IT and Telecom
- 5.4.3 Manufacturing
- 5.4.4 Government and Public Sector
- 5.4.5 Healthcare and Lifesciences
- 5.4.6 Retail and E-commerce
- 5.4.7 Education
- 5.4.8 Other End User Industries
- 5.5 By Geography
- 5.5.1 North America
- 5.5.1.1 United States
- 5.5.1.2 Canada
- 5.5.1.3 Mexico
- 5.5.2 South America
- 5.5.2.1 Brazil
- 5.5.2.2 Argentina
- 5.5.2.3 Rest of South America
- 5.5.3 Europe
- 5.5.3.1 Germany
- 5.5.3.2 United Kingdom
- 5.5.3.3 France
- 5.5.3.4 Italy
- 5.5.3.5 Spain
- 5.5.3.6 Russia
- 5.5.3.7 Rest of Europe
- 5.5.4 Asia-Pacific
- 5.5.4.1 China
- 5.5.4.2 Japan
- 5.5.4.3 India
- 5.5.4.4 South Korea
- 5.5.4.5 Australia and New Zealand
- 5.5.4.6 Rest of Asia-Pacific
- 5.5.5 Middle East
- 5.5.5.1 Saudi Arabia
- 5.5.5.2 United Arab Emirates
- 5.5.5.3 Rest of Middle East
- 5.5.6 Africa
- 5.5.6.1 South Africa
- 5.5.6.2 Nigeria
- 5.5.6.3 Rest of Africa
- 5.5.1 North America
6 COMPETITIVE LANDSCAPE
- 6.1 Market Concentration
- 6.2 Strategic Moves
- 6.3 Market Share Analysis
- 6.4 Company Profiles (includes Global Level Overview, Market Level Overview, Core Segments, Financials as available, Strategic Information, Market Rank/Share, Products and Services, Recent Developments)
- 6.4.1 Cisco Systems, Inc.
- 6.4.2 Huawei Technologies Co., Ltd.
- 6.4.3 Nokia Corporation
- 6.4.4 Hewlett Packard Enterprise Company
- 6.4.5 Extreme Networks, Inc.
- 6.4.6 Arista Networks, Inc.
- 6.4.7 TP-Link Technologies Co., Ltd.
- 6.4.8 Netgear, Inc.
- 6.4.9 D-Link Corporation
- 6.4.10 Zyxel Communications Corporation
- 6.4.11 Ubiquiti Inc.
- 6.4.12 MikroTikls SIA
- 6.4.13 Edgecore Networks Corporation
- 6.4.14 Ruijie Networks Co., Ltd.
- 6.4.15 Fortinet, Inc.
- 6.4.16 Linksys Holdings, Inc.
- 6.4.17 DrayTek Corp.
- 6.4.18 Allied Telesis Holdings K.K.
- 6.4.19 ADTRAN Holdings, Inc.
- 6.4.20 Cambium Networks Corporation
- 6.4.21 Peplink International Limited
- 6.4.22 Dell Technologies Inc.
- 6.4.23 Commscope Holding Company, Inc.
- 6.4.24 Palo Alto Networks, Inc.
7 MARKET OPPORTUNITIES AND FUTURE OUTLOOK
- 7.1 White-Space and Unmet-Need Assessment

 企業級路由器:市場佔有率分析、產業趨勢與統計、成長預測(2026-2031)住宅路由器:市場佔有率分析、產業趨勢與統計、成長預測(2026-2031)
 CNC雕刻機市場-2026-2032年全球市場預測智慧路由器市場:依路由器類型、技術標準、應用、通路和最終用戶分類-2026-2032年全球市場預測中小企業路由器:市場佔有率分析、產業趨勢與統計及成長預測(2026-2031 年)分支路由器:市場佔有率分析、行業趨勢和統計數據、成長預測(2026-2031 年)工業路由器市場:2026-2032年全球市場預測(依產品類型、連接技術、部署環境、最終用戶產業及銷售管道)核心路由器:市場佔有率分析、行業趨勢和統計數據、成長預測(2026-2031 年)路由器:市場佔有率分析、行業趨勢和統計數據、成長預測(2026-2031 年)
 2026年全球電信級路由市場報告