


 |
市場調查報告書
商品編碼
2121709
氧氣感知器:市場佔有率分析、產業趨勢與統計、成長預測(2026-2031)Oxygen Gas Sensors - Market Share Analysis, Industry Trends & Statistics, Growth Forecasts (2026 - 2031) |
||||||

※ 本網頁內容可能與最新版本有所差異。詳細情況請與我們聯繫。
根據 Mordor Intelligence 預測,氧氣感測器市場規模將從 2025 年的 14.6 億美元成長到 2026 年的 15.4 億美元,然後在 2031 年達到 19.4 億美元,2026 年至 2031 年的複合年成長率為 4.73%。
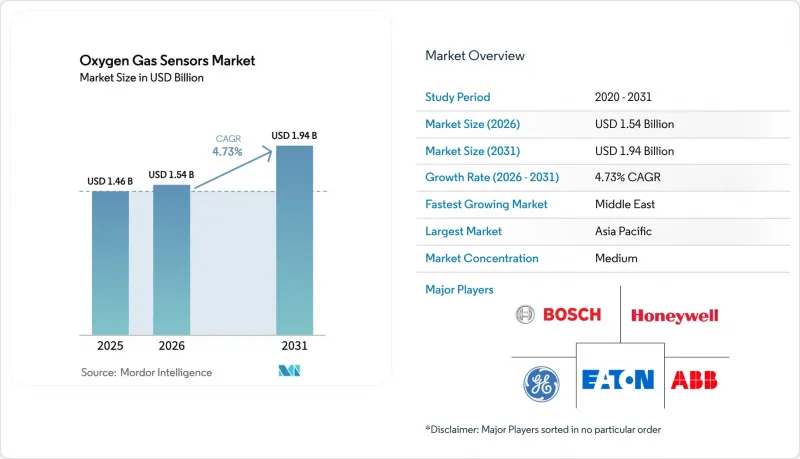
本報告按類型(電位式、電阻式等)、技術(紅外線、觸媒珠等)、終端用戶產業(汽車、智慧建築等)、測量範圍(0–1%O2、1–25%O2、25–100%O2)、輸出訊號(類比、數位、無線)、安裝類型(固定/固定式、可攜式/手持式)和地區進行細分。市場預測以美元(USD)為單位。
全球氧氣感測器市場趨勢與洞察
政府關於職場安全的法規
美國職業安全與健康管理局 (OSHA)、美國消防協會 (NFPA) 72 和美國防爆設備管理局 (ATEX) 強制要求在密閉空間內進行氧氣監測,這迫使工業業者縮短傳統探測器的更換週期。每次違規罰款金額從 7,000 美元到 70,000 美元不等,高昂的違規成本促使設施管理人員採用具備遠距離診斷功能的數位感測器。歐洲的化工廠正在選擇通過 IECEx 認證的設備,雖然價格更高,但可以減少停機時間。合規性審核通常每兩年進行一次,這推動了由法規主導的需求,進而引發了一波持續的設備升級浪潮,導致連網探測器的部署數量增加。提供校準服務的供應商獲得了持續的收入。隨著越來越多的地區遵守國際標準,氧氣感測器市場正受益於合規性主導而蓬勃發展。
汽車排放氣體控制系統的需求日益成長
更嚴格的排放法規,例如歐7、EPA Tier 4和國六排放標準,正在推動所有新型微型車和許多非道路引擎採用氧化鋯氧感測器。汽車製造商目前正在整合上游和下游感測器以滿足車載診斷(OBD)標準,使每輛車的感測器數量翻倍。全球14億輛微型車支撐著大規模的售後市場,感測器更換週期通常為8萬至16萬公里。由於感測器精度直接影響觸媒轉換器的效率,因此品質標準依然很高,這使得擁有陶瓷技術專長的知名一級供應商更具優勢。在每個車型換代期間,需求會短暫激增,然後隨著更換週期趨於正常,這使得大型製造商的產量可以預測。
催化劑中毒導致的感測器漂移。
硫化物和矽氧烷會污染活性位點,降低觸媒珠感測器和電流測量感測器的靈敏度,有時甚至需要每90天重新校準一次。在石油化工煉廠,二氧化硫濃度超過10 ppm會在六個月內使感測器壽命減半,導致維護成本增加。在沼氣廠,矽氧烷沉積物可能導致設備需要更換而非維修。儘管製造商正在測試耐毒性塗層,但由於現場檢驗通常需要兩年以上的時間,因此廣泛應用進展緩慢。在此之前,總擁有成本仍然是處理酸性氣體的設施面臨的一大障礙。
細分市場分析
到2025年,安培式氧氣感知器產品將佔氧氣感知器市場銷售額的42.36%,憑藉其低功耗和在0-25%氧氣濃度範圍內±2%的精度,在攜帶式檢測設備和通風設備市場佔據主導地位。預計光學感測器的成長速度將高於整個品類的成長速度,到2031年,其年均成長率預計將達到5.93%。這一成長率比整個品類的成長率高出120個基點,顯示光學感測器在各種應用領域的需求和應用正在擴大。
煉油廠和發電廠營運商高度重視可調諧二極體雷射不到2秒的反應時間,這可以將燃燒器控制迴路的燃料消耗降低3-5%。雖然光學裝置的價格在8,000美元到15,000美元之間,但其五年免維護運作降低了生命週期成本。隨著認證機構進一步批准用於SIL2製程的光學元件,其應用範圍正在擴展到液化天然氣工廠、玻璃熔爐和化學反應器。用於危險物質應急小組的攜帶式光學產品也正在湧現。光學設計的高精度和耐用性正在改變市場認知,它們有望在響應速度和感測器污染風險至關重要的應用中與安培感測器競爭。
2025年,紅外線技術將引領非消耗性稱重和輸送應用市場,佔37.19%的銷售額。催化電池和電化學電池在攜帶式安全設備和醫療設備領域佔據主導地位,因為這些領域對緊湊性要求極高。氧化鋯固體感測器不受濕度影響,能夠承受高達1600 度C的溫度,預計到2031年將維持5.97%的複合年成長率。由於其在惡劣環境條件下的耐用性和可靠性,這些感測器正被越來越多的行業所採用,並且是需要高精度和穩定性的應用的首選。
汽車用氧感知器目前已佔據市場主導地位,年銷量超過2億台。例如,博世LSU 4.9等寬頻氧感知器能夠實現稀薄燃燒策略,在滿足歐盟7排放標準的同時,將燃油效率提高8%至12%。在工業領域,玻璃、鋁和鋼熔爐等需要精確氧氣控制以降低能耗的熔爐,其應用正在加速成長。隨著越來越多的製程工業傾向於使用高耐久性和校準穩定性強的測量設備,二氧化鋯氧氣感測器的市場規模有望縮小與紅外線氧感測器的差距。
區域分析
亞太地區是氧氣感測器市場的主要驅動力,預計2025年將佔全球市場收入的33.49%。台灣、韓國和中國的半導體投資推動了對微量氧氣分析儀的需求,而印度550萬輛汽車的產量則促進了λ感測器的出貨量。預計2023年至2025年間,中國石化產業的擴張將使乙烯產能增加800萬噸,每個新裂解裝置都將安裝數十個氧氣測量節點。日本對密閉空間的嚴格監管也支撐了對氧氣感測器的更換需求,而澳洲的礦場則持續採購用於地下通風檢測的攜帶式設備。
預計到2031年,中東地區將以每年5.89%的速度成長。 「沙烏地阿拉伯2030願景」下的石化大型企劃以及阿布達比國家石油公司(ADNOC)的碳捕獲舉措均要求在燃燒和硫磺回收裝置中進行持續的氧氣監測。卡達液化天然氣產能的提升以及以色列醫療設備出口的成長,進一步擴大了該地區的需求基礎。南非的礦業法規定在深層隧道中進行氧氣檢測,而埃及的蘇伊士運河經濟特區則是新建石化工廠的中心。
到2025年,北美和歐洲合計將佔市場佔有率的45%。在美國發電廠,環保署(EPA)規定分析儀器的精度必須維持在±0.5%以內,形成穩定的更換週期。德國TRGS 510法規和英國HSE的強制執行通知正在推動固定式和無線式偵測器的銷售。在法國,氧氣感測器正被用於核能發電廠的氫氣監測;而在巴西,隨著混合動力汽車的普及,靈活燃料汽車正在創造新的市場需求。
其他好處:
- Excel格式的市場預測(ME)表
- 3個月的分析師支持
目錄
第1章:引言
- 研究假設和市場定義
- 調查範圍
第2章:調查方法
第3章執行摘要
第4章 市場狀況
- 市場概覽
- 宏觀經濟因素對市場的影響
- 市場促進因素
- 政府關於職場安全的法規
- 汽車排放氣體控制系統的需求日益成長
- 在醫療和生命科學設備中的應用擴展
- 智慧建築和暖通空調監控的投資
- 快速應用於微電子無塵室
- 與無線物聯網平台整合
- 市場限制因素
- 中小企業缺乏意識
- 催化劑材料價格波動
- 催化劑污染會導致感測器漂移。
- 高濕度環境下的校準挑戰
- 產業價值鏈分析
- 監理情勢
- 技術展望
- 波特五力分析
- 投資分析
第5章 市場規模與成長預測
- 按類型
- 電位差類型
- 安培法
- 電阻式
- 光學
- 波長可調諧二極體雷射
- 透過技術
- 紅外線的
- 觸媒珠
- 電化學
- 氧化鋯固體
- 其他技術
- 按最終用戶行業分類
- 化工/石油化工
- 車
- 醫學與生命科學
- 工業製造
- 水和污水處理
- 智慧建築
- 食品/飲料
- 按測量範圍
- 0~1 % O2
- 1~25 % O2
- 25~100 % O2
- 透過輸出訊號
- 模擬
- 數位的
- 無線的
- 按安裝類型
- 固定式/獨立式
- 可攜式/手持式
- 按地區
- 北美洲
- 美國
- 加拿大
- 墨西哥
- 歐洲
- 德國
- 英國
- 法國
- 俄羅斯
- 其他歐洲國家
- 亞太地區
- 中國
- 日本
- 印度
- 韓國
- 澳洲
- 其他亞太國家
- 中東和非洲
- 中東
- 沙烏地阿拉伯
- 阿拉伯聯合大公國
- 其他中東國家
- 非洲
- 南非
- 埃及
- 其他非洲國家
- 中東
- 南美洲
- 巴西
- 阿根廷
- 其他南美國家
- 北美洲
第6章 競爭情勢
- 市場集中度
- 策略趨勢
- 市佔率分析
- 公司簡介
- Robert Bosch GmbH
- Honeywell International Corporation
- ABB Ltd.
- Yokogawa Electric Corporation
- Figaro Engineering Inc.
- Eaton Corporation
- Advanced Micro Instruments Inc.
- City Technology Ltd.
- General Electric Company
- Sensirion AG
- TE Connectivity plc
- Mettler-Toledo International Inc.
- AlphaSense Inc.
- Aeroqual Ltd.
- NevadaNano Inc.
- SGX Sensortech
- Control Instruments Corporation
- Fujikura Ltd.
- Maxtec LLC
- Membrapor AG
第7章 市場機會與未來展望
According to Mordor Intelligence, the oxygen gas sensors market size is expected to grow from USD 1.46 billion in 2025 to USD 1.54 billion in 2026 and is forecast to reach USD 1.94 billion by 2031 at 4.73% CAGR over 2026-2031.
This report is Segmented by Type (Potentiometric, Resistive, and More), Technology (Infrared, Catalytic Bead, and More), End-User Industry (Automotive, Smart Buildings, and More), Measurement Range (0-1% O2, 1-25% O2, 25-100% O2), Output Signal (Analog, Digital, Wireless), Installation (Fixed/Stationary, Portable/Handheld), and Geography. The Market Forecasts are Provided in Terms of Value (USD).
Global Oxygen Gas Sensors Market Trends and Insights
Government Regulations for Workplace Safety
Mandatory oxygen monitoring in confined spaces, as mandated by OSHA, NFPA 72, and ATEX, prompts industrial operators to replace legacy detectors at shorter intervals. Penalties that range from USD 7,000 to USD 70,000 per violation make non-compliance costly, so facility managers favor digital sensors with remote diagnostics. European chemical plants are adopting IECEx-certified devices that command price premiums while promising lower downtime. With enforcement audits typically following two-year cycles, the rule-driven pull translates into a persistent wave of equipment refreshes, thereby widening the installed base of connected detectors. Vendors that bundle calibration services capture recurring revenue. As more jurisdictions align with international codes, the oxygen gas sensors market gains a durable compliance-led floor.
Growing Demand for Automotive Emission Control Systems
Tightening rules, such as Euro 7, EPA Tier 4, and China VI, have driven the adoption of zirconia lambda sensors in every new light vehicle and many non-road engines. Automakers now integrate upstream and downstream sensors to meet on-board diagnostics thresholds, doubling unit content per vehicle. The global car park of 1.4 billion light vehicles sustains a large aftermarket, where change-out typically occurs every 80,000-160,000 kilometers. Because sensor accuracy directly influences catalytic-converter efficiency, quality standards remain high, benefiting established tier-one suppliers with ceramic expertise. Near-term demand spikes during each model-year transition, then normalizes into replacement cycles, keeping volumes predictable for large-scale producers.
Catalyst Poisoning Leading to Sensor Drift
Sulfur compounds and siloxanes reduce the sensitivity of catalytic-bead and amperometric sensors by fouling active sites, necessitating recalibration as frequently as every 90 days. In petrochemical refineries, sulfur dioxide levels above 10 ppm halve sensor life within six months, thereby inflating maintenance budgets. Biogas plants encounter siloxane build-up, prompting replacement rather than service. Although manufacturers are testing poison-resistant coatings, field validation typically spans two years or more, delaying widespread adoption. Until then, the total cost of ownership remains a deterrent for facilities handling sour gases.
Other drivers and restraints analyzed in the detailed report include:
- Expanding Use in Medical and Life-Sciences Devices
- Investments in Smart Buildings and HVAC Monitoring
- Calibration Challenges in High-Humidity Environments
For complete list of drivers and restraints, kindly check the Table Of Contents.
Segment Analysis
In 2025, amperometric designs accounted for 42.36% of the oxygen gas sensor market revenue, dominating portable detectors and ventilators due to their combination of low power draw and +-2% accuracy across the 0-25% oxygen range. Optical sensors are set to outpace category growth, projected to expand at a rate of 5.93% through 2031. This growth rate surpasses the category growth by 120 basis points, highlighting the increasing demand and adoption of optical sensors across various applications.
Operators in refineries and power plants value the sub-2-second response time of tunable diode laser units, which reduce fuel consumption by 3-5% in burner control loops. Optical devices cost USD 8,000-15,000, yet their five-year maintenance-free runtime lowers lifecycle expense. As certification bodies clear more optical models for SIL2 processes, adoption spreads to LNG trains, glass furnaces, and chemical reactors. Portable optical offerings also emerge for hazardous response teams. The higher accuracy and durability of optical designs tilt market perception, positioning them to pull share from amperometric cells whenever response speed or sensor poisoning risk is paramount.
Infrared technology led the market with 37.19% revenue share in 2025, serving non-consumptive custody-transfer applications. Catalytic and electrochemical cells dominate portable safety devices and medical gear where compactness is crucial. Zirconia solid-state sensors, with their immunity to humidity and ability to withstand temperatures up to 1,600 °C, are poised to register a 5.97% CAGR through 2031. These sensors are increasingly being adopted across various industries due to their durability and reliability in extreme environmental conditions, making them a preferred choice for applications requiring high precision and stability.
Automotive lambda sensors now exceed 200 million units annually, anchoring the market, and wideband variants, such as the Bosch LSU 4.9, enable lean-burn strategies that improve fuel economy by 8-12%, while meeting Euro 7 limits. Industrial uptake accelerates in glass, aluminum, and steel furnaces that rely on precise oxygen trimming to curb energy use. The oxygen gas sensor market size for zirconia devices is on track to narrow the gap with infrared solutions as more process industries favor durable, calibration-stable measurements.
Complete Report Scope:
- By Type
- Potentiometric
- Amperometric
- Resistive
- Optical
- Tunable Diode Laser
- By Technology
- Infrared
- Catalytic Bead
- Electrochemical
- Zirconia Solid-State
- Other Technologies
- By End-User Industry
- Chemical and Petrochemical
- Automotive
- Medical and Life Sciences
- Industrial Manufacturing
- Water and Wastewater
- Smart Buildings
- Food and Beverage
- By Measurement Range
- 0-1 % O2
- 1-25 % O2
- 25-100 % O2
- By Output Signal
- Analog
- Digital
- Wireless
- By Installation
- Fixed/Stationary
- Portable/Handheld
- By Geography
- North America
- United States
- Canada
- Mexico
- Europe
- Germany
- United Kingdom
- France
- Russia
- Rest of Europe
- Asia-Pacific
- China
- Japan
- India
- South Korea
- Australia
- Rest of Asia-Pacific
- Middle East and Africa
- Middle East
- Saudi Arabia
- United Arab Emirates
- Rest of Middle East
- Africa
- South Africa
- Egypt
- Rest of Africa
- Middle East
- South America
- Brazil
- Argentina
- Rest of South America
- North America
Geography Analysis
The Asia-Pacific region led the oxygen gas sensors market, accounting for 33.49% of the market revenue in 2025. Semiconductor investment in Taiwan, South Korea, and China drives demand for trace-oxygen analyzers, while India's auto output of 5.5 million units boosts lambda-sensor shipments. Petrochemical expansions in China added 8 million metric tons of ethylene capacity between 2023-2025, with each new cracker installing dozens of oxygen nodes. Japan's strict confined-space rules sustain replacement sales, and Australian mines continue to procure portable units for underground ventilation checks.
The Middle East is projected to grow at a rate of 5.89% through 2031. Petrochemical megaprojects under Saudi Vision 2030 and ADNOC's carbon-capture initiatives specify continuous oxygen monitoring for combustion and sulfur recovery units. Qatar's LNG capacity build-out and Israel's expanding medical-device exports further widen the regional demand base. South Africa's mining code mandates oxygen sensing in deep shafts, and Egypt's Suez Canal Economic Zone anchors new petrochemical builds.
North America and Europe jointly accounted for 45% of market revenue in 2025. U.S. power plants must maintain analyzer accuracy within +-0.5% under EPA rules, creating a stable replacement cadence. Germany's TRGS 510 and the U.K. HSE's enforcement notices bolster sales of both fixed and wireless detectors. France's nuclear fleet utilizes oxygen sensors in hydrogen monitoring, while Brazil's flex-fuel fleet in South America creates niche demand as it pivots toward hybrid vehicles.
- Robert Bosch GmbH
- Honeywell International Corporation
- ABB Ltd.
- Yokogawa Electric Corporation
- Figaro Engineering Inc.
- Eaton Corporation
- Advanced Micro Instruments Inc.
- City Technology Ltd.
- General Electric Company
- Sensirion AG
- TE Connectivity plc
- Mettler-Toledo International Inc.
- AlphaSense Inc.
- Aeroqual Ltd.
- NevadaNano Inc.
- SGX Sensortech
- Control Instruments Corporation
- Fujikura Ltd.
- Maxtec LLC
- Membrapor AG
Additional Benefits:
- The market estimate (ME) sheet in Excel format
- 3 months of analyst support
TABLE OF CONTENTS
1 INTRODUCTION
- 1.1 Study Assumptions and Market Definition
- 1.2 Scope of the Study
2 RESEARCH METHODOLOGY
3 EXECUTIVE SUMMARY
4 MARKET LANDSCAPE
- 4.1 Market Overview
- 4.2 Impact of Macroeconomic Factors on the Market
- 4.3 Market Drivers
- 4.3.1 Government Regulations for Workplace Safety
- 4.3.2 Growing Demand for Automotive Emission Control Systems
- 4.3.3 Expanding Use in Medical and Life-Sciences Devices
- 4.3.4 Investments in Smart Buildings and HVAC Monitoring
- 4.3.5 Rapid Adoption in Micro-electronics Cleanrooms
- 4.3.6 Integration with Wireless IoT Platforms
- 4.4 Market Restraints
- 4.4.1 Lack of Awareness in Small and Medium Enterprises
- 4.4.2 Price Volatility of Catalytic Materials
- 4.4.3 Catalyst Poisoning Leading to Sensor Drift
- 4.4.4 Calibration Challenges in High-Humidity Environments
- 4.5 Industry Value Chain Analysis
- 4.6 Regulatory Landscape
- 4.7 Technological Outlook
- 4.8 Porter's Five Forces Analysis
- 4.8.1 Threat of New Entrants
- 4.8.2 Bargaining Power of Buyers
- 4.8.3 Bargaining Power of Suppliers
- 4.8.4 Threat of Substitute Products
- 4.8.5 Intensity of Competitive Rivalry
- 4.9 Investment Analysis
5 MARKET SIZE AND GROWTH FORECASTS (VALUE)
- 5.1 By Type
- 5.1.1 Potentiometric
- 5.1.2 Amperometric
- 5.1.3 Resistive
- 5.1.4 Optical
- 5.1.5 Tunable Diode Laser
- 5.2 By Technology
- 5.2.1 Infrared
- 5.2.2 Catalytic Bead
- 5.2.3 Electrochemical
- 5.2.4 Zirconia Solid-State
- 5.2.5 Other Technologies
- 5.3 By End-User Industry
- 5.3.1 Chemical and Petrochemical
- 5.3.2 Automotive
- 5.3.3 Medical and Life Sciences
- 5.3.4 Industrial Manufacturing
- 5.3.5 Water and Wastewater
- 5.3.6 Smart Buildings
- 5.3.7 Food and Beverage
- 5.4 By Measurement Range
- 5.4.1 0-1 % O2
- 5.4.2 1-25 % O2
- 5.4.3 25-100 % O2
- 5.5 By Output Signal
- 5.5.1 Analog
- 5.5.2 Digital
- 5.5.3 Wireless
- 5.6 By Installation
- 5.6.1 Fixed/Stationary
- 5.6.2 Portable/Handheld
- 5.7 By Geography
- 5.7.1 North America
- 5.7.1.1 United States
- 5.7.1.2 Canada
- 5.7.1.3 Mexico
- 5.7.2 Europe
- 5.7.2.1 Germany
- 5.7.2.2 United Kingdom
- 5.7.2.3 France
- 5.7.2.4 Russia
- 5.7.2.5 Rest of Europe
- 5.7.3 Asia-Pacific
- 5.7.3.1 China
- 5.7.3.2 Japan
- 5.7.3.3 India
- 5.7.3.4 South Korea
- 5.7.3.5 Australia
- 5.7.3.6 Rest of Asia-Pacific
- 5.7.4 Middle East and Africa
- 5.7.4.1 Middle East
- 5.7.4.1.1 Saudi Arabia
- 5.7.4.1.2 United Arab Emirates
- 5.7.4.1.3 Rest of Middle East
- 5.7.4.2 Africa
- 5.7.4.2.1 South Africa
- 5.7.4.2.2 Egypt
- 5.7.4.2.3 Rest of Africa
- 5.7.4.1 Middle East
- 5.7.5 South America
- 5.7.5.1 Brazil
- 5.7.5.2 Argentina
- 5.7.5.3 Rest of South America
- 5.7.1 North America
6 COMPETITIVE LANDSCAPE
- 6.1 Market Concentration
- 6.2 Strategic Moves
- 6.3 Market Share Analysis
- 6.4 Company Profiles (includes Global Level Overview, Market Level Overview, Core Segments, Financials as Available, Strategic Information, Market Rank/Share for Key Companies, Products and Services, and Recent Developments)
- 6.4.1 Robert Bosch GmbH
- 6.4.2 Honeywell International Corporation
- 6.4.3 ABB Ltd.
- 6.4.4 Yokogawa Electric Corporation
- 6.4.5 Figaro Engineering Inc.
- 6.4.6 Eaton Corporation
- 6.4.7 Advanced Micro Instruments Inc.
- 6.4.8 City Technology Ltd.
- 6.4.9 General Electric Company
- 6.4.10 Sensirion AG
- 6.4.11 TE Connectivity plc
- 6.4.12 Mettler-Toledo International Inc.
- 6.4.13 AlphaSense Inc.
- 6.4.14 Aeroqual Ltd.
- 6.4.15 NevadaNano Inc.
- 6.4.16 SGX Sensortech
- 6.4.17 Control Instruments Corporation
- 6.4.18 Fujikura Ltd.
- 6.4.19 Maxtec LLC
- 6.4.20 Membrapor AG
7 MARKET OPPORTUNITIES AND FUTURE OUTLOOK
- 7.1 White-Space and Unmet-Need Assessment

 礦業雷射甲烷感測器市場報告:趨勢、預測和競爭分析(至2035年)
 氣體感測器、偵測器和分析儀器:市場佔有率分析、行業趨勢和統計數據以及成長預測(2026-2031 年)美國氣體感測器:市場佔有率分析、行業趨勢和統計數據、成長預測(2026-2031 年)氣體感測器:市場佔有率分析、產業趨勢與統計、成長預測(2026-2031)
 氣體感測器市場:2026-2032年全球市場預測(按產品類型、連接方式、技術、類別、氣體類型、應用和最終用戶分類)低功耗、緊湊型氣體感測器市場:2026-2032年全球市場預測(依偵測技術、目標氣體類型、輸出介面、應用、銷售管道和最終用戶產業分類)
 全球氣體感測器市場規模、佔有率、趨勢和成長分析報告(2026-2034年)全球臭氧感測器市場:市場規模、佔有率、趨勢和成長分析(2026-2034)
 2026年全球建築用黑色花崗岩市場報告
 氣體感測器市場:按氣體類型、技術、最終用戶和地區分類