


 |
市場調查報告書
商品編碼
2120597
氣體感測器:市場佔有率分析、產業趨勢與統計、成長預測(2026-2031)Gas Sensors - Market Share Analysis, Industry Trends & Statistics, Growth Forecasts (2026 - 2031) |
||||||

※ 本網頁內容可能與最新版本有所差異。詳細情況請與我們聯繫。
根據 Mordor Intelligence 預測,氣體感測器市場預計將從 2025 年的 16.7 億美元成長到 2026 年的 18.6 億美元,到 2031 年達到 29.9 億美元,2026 年至 2031 年的複合年成長率為 9.96%。
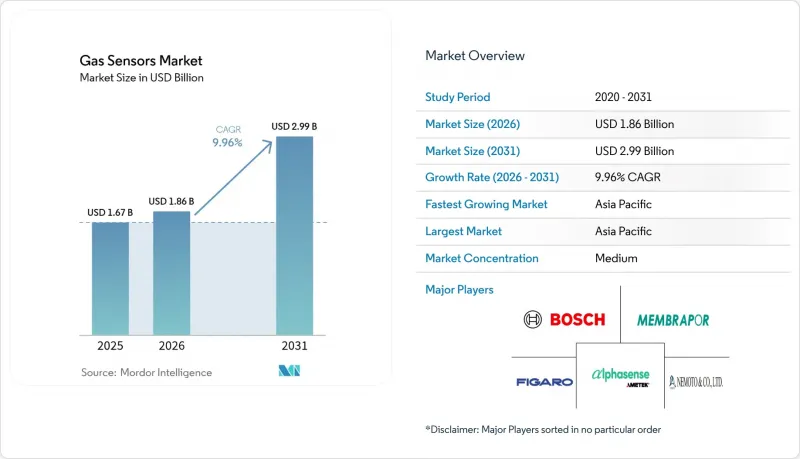
本報告按氣體類型(氧氣、一氧化碳、二氧化碳、氮氧化物、碳氫化合物及其他氣體)、技術(電化學、光電離及其他)、外形規格(固定式、現場安裝式及其他)、連接方式(有線和無線)、終端應用產業(工業安全、汽車及其他)和地區進行細分。市場預測以美元計價。
全球氣體感測器市場趨勢與洞察
加強對汽車車載診斷(OBD)系統的監管
將於2025年7月生效的歐7排放標準將把車輛整個生命週期內允許的氮氧化物排放量降低至10毫克/公里,迫使汽車製造商安裝具有冗餘功能的雙氮氧化物探頭,並透過自我診斷功能實現檢測。在美國,EPA Tier 3標準將每組車輛的平均氮氧化物排放量限制在30毫克/英里,而中國的國家VI-b標準也採用了類似的閾值,每年影響約9000萬輛輕型汽車。目前,一級供應商正在指定使用能夠承受850 度C高溫廢氣流並確保響應時間小於5秒的氧化鋯感測器。雖然訂單的增加給平均售價帶來了壓力,但總需求量也在增加。能夠同時測量氮氧化物、氨氣和碳氫化合物的多氣體模組正在湧現,從而降低了線路和ECU的成本。
引入基於物聯網的空氣品質監測
在每個城市,該系統正從每10萬居民一個符合監管規定的測量站,轉向每平方公里10至50個低成本節點的網格化部署,從而即時產生超本地化地圖。繼歐盟2024年將基準值10微克/立方米、NO2年均濃度標準降至20微克/立方米之後,米蘭、華沙和雅典正在部署互補的電化學和非分散紅外線(NDIR)測量陣列。在中國,自動化測量站的數量已超過5,000個,並計畫到2027年再增設2,000個鄉鎮級節點。印度已在2025年累計220億印度盧比(約2.65億美元),用於建造覆蓋132個不符合標準的城市的監控網路。西門子、ABB 和泰萊達因的平台透過將資料上傳到雲端儀表板進行漂移校正,減少了 25% 的現場服務訪問次數。
混合氣體基質中低於10 ppm的交叉敏感度所面臨的挑戰
鉑基一氧化碳感測器與氫氣的反應靈敏度約為其一氧化碳靈敏度的50%,而硫化氫感測器與二氧化硫的交叉反應率則高達20-30%。這導致應用特定的檢驗成本顯著增加,專案預算可能因此增加25%。金屬氧化物半導體(MOS)感測器的干擾頻寬更寬,而ISO 17025標準僅涵蓋單氣體校準,因此最終用戶需要自行設計測試系統。 2025年,Alphasense公司發布了一款帶有卡爾曼濾波器的前端晶片,用於減少瞬態誤報,但這使每個模組的成本增加了15-30美元。
細分市場分析
2025年,氧氣探頭的銷售額佔比將達到28.19%,這主要得益於其在λ值控制、工業燃燒調節和人工呼吸器等領域的廣泛應用。氧化鋯感測器在-40 度C至850 度C的溫度範圍內精度可達1%以下,持續支撐著氧氣檢測氣體感測器市場的發展。包括揮發性有機化合物(VOCs)和甲烷在內的碳氫化合物市場正以11.77%的複合年成長率成長,這主要得益於OGMP 2.0法規下對上游設施強制進行的季度檢查,從而推動了光電離檢測器和開放式雷射光譜儀的銷售。
電解槽和燃料電池汽車中高濃度的氫氣推動了對微量氧氣和氮氣感測器的需求,這些感測器能夠在70巴壓力下測量低於10 ppm的濃度。二氧化碳感測器受益於暖通空調系統的維修,該系統可將室內二氧化碳濃度維持在800 ppm以下。自歐盟7排放標準實施以來,氮氧化物探頭的需求激增,但單價已從45美元降至38美元。採用防爆外殼包裝的二氧化硫、氨氣和氯氣模組仍然價格高昂。
由於電化學元件在單一氣體環境中具有高選擇性,預計到2025年,其市佔率將達到35.45%。將微鏡和紅外線檢測器整合在3毫米封裝內的MEMS光學陣列,可應用於穿戴式裝置和智慧型手機,其複合年成長率(CAGR)為11.95%。與分離式設計相比,MEMS模組的平均售價(ASP)始終較高,因此其在氣體感測器市場的佔有率正在不斷擴大。
PID 設備仍是危險物品緊急應變小組的小眾產品,而 MOS 元件成本最低,但容易因濕度波動而發生漂移,需要頻繁進行零點調整。 NDIR 技術對於環境監測站的二氧化碳和碳氫化合物分析仍然至關重要,其 15 年的使用壽命使其 50 至 150 美元的價格物有所值。觸媒珠仍然是住宅甲烷警報器的主流,但人們對矽中毒的擔憂正促使高階安裝轉向紅外線系統。
區域分析
預計到2025年,亞太地區將佔全球銷售額的36.12%,年複合成長率達11.59%,是所有地區中成長最快的。中國運作5,000多個政府空氣品質監測站,並計畫在2027年再增設2,000個鄉鎮級監測站。每個監測站的年漂移率必須低於10%。印度已在其「國家清潔空氣計畫」下撥款220億印度盧比(約2.65億美元),強制要求火力發電廠採用非分散紅外線(NDIR)型二氧化硫(SO2)和氮氧化物(NOx)探頭。日本計劃在2030年建成1000座加氫站,將推動對符合ISO 19881認證標準的觸媒珠檢測器的需求。同時,韓國的「綠色新政」撥款1.8兆韓元用於建造配備無線感測器網路的智慧工廠。
預計到2025年,北美地區的銷售額將佔全球總銷售額的約28%。美國職業安全與健康管理局(OSHA)收緊了硫化氫排放限值,促使各工廠普遍採用硫化氫檢測器;此外,根據《通貨膨脹削減法案》(3美元/公斤)提供的氫氣補貼,推動了超過15吉瓦的電解槽項目建設,這些項目需要安裝痕量氧感測器。加拿大的甲烷排放法規要求每季進行洩漏測試,而墨西哥已在1200個污染源進行了連續監測。
到2025年,歐洲的佔有率約為24%。歐盟降低了PM2.5和NO2的排放限值,因此需要在南部都會區部署高密度物聯網節點。德國擴大了持續排放法規的適用範圍,將中型燃燒設施納入其中,新增了8,000個相關裝置。英國根據2021年《環境法》設定了具有法律約束力的PM2.5目標,法國則在所有學校實施了室內空氣監測。
中東和非洲地區的銷售額佔總銷售額的近8%。沙烏地阿拉伯阿美公司的傑夫拉天然氣田已在整個礦井入口處安裝了硫化氫測量網路;在阿拉伯聯合大公國,到2025年將建成150個環境監測站。在南非,礦井柴油顆粒物排放標準已降低,並且正在維修藍牙標籤。
南美洲佔總銷售額的4%,主要得益於巴西的甘蔗乙醇聯合裝置和阿根廷的瓦卡穆埃爾塔頁岩氣田。目前,這兩個設施都被要求在其壓縮機組上安裝固定式甲烷和一氧化碳偵測器。
其他福利
- Excel格式的市場預測(ME)表
- 3個月的分析師支持
目錄
第1章:引言
- 研究假設和市場定義
- 調查範圍
第2章:調查方法
第3章執行摘要
第4章 市場狀況
- 市場概覽
- 市場促進因素
- 加強汽車車載診斷(OBD)法規(歐盟7,EPA Tier 3)
- 職場安全法規(OSHA、REACH、ISO 45001)
- 引入基於物聯網的空氣品質監測(智慧城市)
- 氫氣生產和燃料電池價值鏈的需求激增
- 石油和天然氣產業甲烷外洩檢測新規(OGMP 2.0)
- 由於微型化的基於MEMS的多氣體陣列(小於3毫米)而提高了平均售價
- 市場限制因素
- 混合氣體基質中低於10 ppm的交叉敏感度所面臨的挑戰
- 由於矽供應波動,晶圓價格上漲。
- 缺乏全球校準標準阻礙了相容性。
- 來自中國低成本電化學供應商的成本壓力
- 產業價值鏈分析
- 監理情勢
- 技術展望
- 宏觀經濟因素對市場的影響
- 波特五力分析
第5章 市場規模與成長預測
- 依氣體類型
- 氧
- 一氧化碳(CO)
- 二氧化碳(CO2)
- 氮氧化物(NOx)
- 碳氫化合物(VOCs,CH4)
- 其他氣體(SO2、H2S)
- 透過技術
- 電化學公式
- 光電離公式(PID)
- 固態MOS
- 觸媒珠
- 非色散紅外光譜(NDIR)
- 微機電系統與半導體光學
- 按外形規格
- 固定式和現場安裝式模組
- 可攜式手持終端機
- 穿戴式徽章和貼片
- 連結性別
- 有線(4-20mA、CAN、RS-485)
- 無線(BLE、NB-IoT、LoRaWAN)
- 按最終用途行業分類
- 工業安全與製程(石油天然氣、化學)
- 汽車動力系統和暖通空調
- 建築自動化/智慧家居
- 醫療和生命科學設備
- 食品飲料及冷鏈物流
- 環境監測與智慧城市節點
- 按地區
- 北美洲
- 美國
- 加拿大
- 墨西哥
- 南美洲
- 巴西
- 阿根廷
- 歐洲
- 德國
- 英國
- 法國
- 俄羅斯
- 亞太地區
- 中國
- 日本
- 印度
- 韓國
- 中東和非洲
- 中東
- 阿拉伯聯合大公國
- 沙烏地阿拉伯
- 非洲
- 南非
- 其他非洲地區
- 中東
- 北美洲
第6章 競爭情勢
- 市場集中度
- 策略趨勢
- 市佔率分析
- 公司簡介
- Robert Bosch GmbH
- Honeywell International Inc.-City Technology
- Dragerwerk AG & Co. KGaA
- Figaro Engineering Inc.
- Sensirion Holding AG
- AlphaSense Inc.
- Amphenol SGX Sensortech Ltd.
- Membrapor AG
- Nemoto and Co., Ltd.
- Niterra Co., Ltd.(NGK-NTK)
- Delphi Technologies(BorgWarner Inc.)
- Senseair AB(Asahi Kasei Microdevices)
- Dynament Ltd.
- Siemens AG-BT Sensors
- ABB Ltd.-Ability Gas Analytics
- Yokogawa Electric Corporation
- Emerson Electric Co.-Rosemount
- Teledyne FLIR LLC
- General Electric Company-Panametrics
- Zhengzhou Winsen Electronics Technology Co., Ltd.
- NevadaNano Inc.
- MSA Safety Incorporated
第7章 市場機會與未來展望
According to Mordor Intelligence, the gas sensors market size is expected to increase from USD 1.67 billion in 2025 to USD 1.86 billion in 2026 and reach USD 2.99 billion by 2031, growing at a CAGR of 9.96% over 2026-2031.
This report is Segmented by Gas Type (Oxygen, Carbon Monoxide, Carbon Dioxide, Nitrogen Oxides, Hydrocarbons, and More Gases), Technology (Electrochemical, Photo-Ionisation, and More), Form Factor (Fixed/In-Situ, and More), Connectivity (Wired, Wireless), End-Use Industry (Industrial Safety, Automotive, and More), and Geography. Market Forecasts are Provided in Terms of Value (USD).
Global Gas Sensors Market Trends and Insights
Stricter Vehicle On-Board Diagnostics
Euro 7 rules effective July 2025 cut allowable nitrogen-oxide slip to 10 mg km-1 for the full vehicle life, forcing automakers to install dual NOx probes with self-diagnostic redundancy. In the United States, EPA Tier 3 tightened fleet-average NOx to 30 mg mile-1, while China's National VI-b mirrors the same thresholds, together covering close to 90 million light-duty vehicles per year. Tier-1 suppliers now specify zirconia cells that survive 850 °C exhaust streams and deliver sub-5 s response. Larger order volumes are compressing average selling prices but are also boosting total unit demand. Multi-gas modules that simultaneously read NOx, ammonia slip, and hydrocarbons are emerging to trim wiring and ECU costs.
IoT-Enabled Air-Quality Monitoring Rollouts
Cities are moving from one regulatory-grade station per 100 000 residents to grid densities of 10-50 low-cost nodes km-2, generating hyperlocal maps in real time. The European Union cut annual PM2. 5 limits to 10 µg m-3 and NO2 to 20 µg m-3 in 2024, prompting Milan, Warsaw, and Athens to deploy supplementary electrochemical and NDIR arrays. China has surpassed 5 000 automated stations and plans another 2 000 township nodes by 2027. India budgeted INR 22 billion (USD 265 million) in 2025 for networks across 132 non-attainment cities. Platforms from Siemens, ABB, and Teledyne upload data to cloud dashboards that apply drift correction, trimming field service visits by 25%.
Sub-10 ppm Cross-Sensitivity Challenges in Mixed Gas Matrices
Platinum-based CO cells respond to hydrogen at about 50% of CO sensitivity, while H2S cells cross-respond 20-30% to SO2, leading to costly application-specific validation that can add 25% to project budgets. MOS sensors have even wider interference bands, and ISO 17025 covers only single-gas calibrations, leaving end users to design custom test regimes. Alphasense released a Kalman-filter front-end chip in 2025 that cuts transient false positives yet adds USD 15-30 to each module.
Other drivers and restraints analyzed in the detailed report include:
- Surging Demand from Hydrogen Production and Fuel-Cell Value Chain
- Workplace Safety Mandates
- Silicon Supply Volatility Inflating Wafer Prices
For complete list of drivers and restraints, kindly check the Table Of Contents.
Segment Analysis
Oxygen probes delivered 28.19% of 2025 revenue thanks to universal use in lambda control, industrial combustion tuning, and ventilators. The gas sensors market size for oxygen detection remains buoyed by zirconia cells that achieve sub-1% accuracy across -40 °C to 850 °C. Hydrocarbons, including VOCs and methane, are advancing at an 11.77% CAGR because OGMP 2.0 compels quarterly surveys at upstream sites, boosting sales of photo-ionization detectors and open-path laser spectrometers.
Hydrogen-rich atmospheres in electrolyzers and fuel-cell vehicles are pushing demand for trace oxygen and nitrogen sensors able to measure below 10 ppm at 70 bars. CO2 sensors benefited from HVAC retrofits that hold in-room levels under 800 ppm. Nitrogen-oxide probes rose sharply after Euro 7 but saw unit price erosion from USD 45 to 38. Premium pricing persists for SO2, NH3, and Cl2 modules that ship in explosion-proof enclosures.
Electrochemical devices held 35.45% of 2025 value, backed by high selectivity in single-gas contexts. MEMS-optical arrays are climbing at an 11.95% CAGR, integrating micro-mirrors and IR detectors within 3 mm packages that fit wearables and phones. The gas sensors market share of MEMS modules is widening as ASPs stay high relative to discrete designs.
PID instruments remain niche for hazmat teams, whereas MOS parts offer the lowest bill-of-materials but drift under humidity swings, requiring frequent zeroing. NDIR remains indispensable for CO2 and hydrocarbon analysis in ambient stations where 15-year lifetimes justify USD 50-150 pricing. Catalytic beads still dominate residential methane alarms, though silicone poisoning is nudging premium installations toward infrared options.
Complete Report Scope:
- By Gas Type
- Oxygen
- Carbon Monoxide (CO)
- Carbon Dioxide (CO?)
- Nitrogen Oxides (NO?)
- Hydrocarbons (VOC/CH?)
- Other Gases (SO?, H?S)
- By Technology
- Electrochemical
- Photo-Ionisation (PID)
- Solid-State / MOS
- Catalytic Bead
- Non-Dispersive Infra-Red (NDIR)
- MEMS-Semiconductor Optical
- By Form Factor
- Fixed / In-Situ Modules
- Portable / Hand-Held Devices
- Wearable Badges / Patches
- By Connectivity
- Wired (4-20 mA, CAN, RS-485)
- Wireless (BLE, NB-IoT, LoRaWAN)
- By End-Use Industry
- Industrial Safety and Process (Oil and Gas, Chemicals)
- Automotive Powertrain and HVAC
- Building Automation / Smart Homes
- Medical and Life-Science Equipment
- Food, Beverage and Cold-Chain Logistics
- Environmental Monitoring and Smart City Nodes
- By Geography
- North America
- United States
- Canada
- Mexico
- South America
- Brazil
- Argentina
- Europe
- Germany
- United Kingdom
- France
- Russia
- Asia-Pacific
- China
- Japan
- India
- South Korea
- Middle East and Africa
- Middle East
- United Arab Emirates
- Saudi Arabia
- Africa
- South Africa
- Rest of Africa
- Middle East
- North America
Geography Analysis
Asia-Pacific generated 36.12% of 2025 revenue and is forecast to grow at an 11.59% CAGR, the fastest regional pace. China operates more than 5 000 government air-quality stations and will add 2 000 township nodes by 2027, each specified for <10% annual drift. India budgeted INR 22 billion (USD 265 million) under its National Clean Air Programme, mandating NDIR SO2 and NOx probes in thermal plants. Japan aims for 1 000 hydrogen stations by 2030, boosting demand for catalytic bead detectors certified to ISO 19881, while South Korea's Green New Deal earmarked KRW 1.8 trillion for smart factories with wireless sensor grids.
North America provided roughly 28% of 2025 turnover. OSHA's stricter hydrogen-sulfide limits triggered plant-wide badge issuance, and the Inflation Reduction Act's USD 3 kg-1 hydrogen credit stimulated more than 15 GW of electrolyzer projects needing trace oxygen sensors. Canada's methane rule mandates quarterly leak checks, while Mexico expanded continuous monitoring across 1 200-point sources.
Europe held about 24% share in 2025. The EU cut PM2. 5 and NO2 limits, forcing southern capitals to deploy dense IoT nodes. Germany extended continuous emission rules to medium combustion plants, adding 8 000 new installations. The United Kingdom fixed a binding PM2. 5 target under the Environment Act 2021, and France introduced indoor-air monitoring in all schools.
Middle East and Africa contributed close to 8% of revenue. Saudi Aramco's Jafurah gas field is fitting H2S networks across wellheads, and the UAE installed 150 ambient stations in 2025. South Africa lowered diesel particulate limits in mines, prompting retrofits with BLE badges.
South America accounted for 4% of revenue, led by Brazil's sugarcane ethanol complexes and Argentina's Vaca Muerta shale pads, both of which now mandate fixed methane and CO detectors on compressor skids.
- Robert Bosch GmbH
- Honeywell International Inc. - City Technology
- Dragerwerk AG & Co. KGaA
- Figaro Engineering Inc.
- Sensirion Holding AG
- AlphaSense Inc.
- Amphenol SGX Sensortech Ltd.
- Membrapor AG
- Nemoto and Co., Ltd.
- Niterra Co., Ltd. (NGK-NTK)
- Delphi Technologies (BorgWarner Inc.)
- Senseair AB (Asahi Kasei Microdevices)
- Dynament Ltd.
- Siemens AG - BT Sensors
- ABB Ltd. - Ability Gas Analytics
- Yokogawa Electric Corporation
- Emerson Electric Co. - Rosemount
- Teledyne FLIR LLC
- General Electric Company - Panametrics
- Zhengzhou Winsen Electronics Technology Co., Ltd.
- NevadaNano Inc.
- MSA Safety Incorporated
Additional Benefits:
- The market estimate (ME) sheet in Excel format
- 3 months of analyst support
TABLE OF CONTENTS
1 INTRODUCTION
- 1.1 Study Assumptions and Market Definition
- 1.2 Scope of the Study
2 RESEARCH METHODOLOGY
3 EXECUTIVE SUMMARY
4 MARKET LANDSCAPE
- 4.1 Market Overview
- 4.2 Market Drivers
- 4.2.1 Stricter Vehicle On-Board Diagnostics (Euro 7, EPA Tier 3)
- 4.2.2 Workplace Safety Mandates (OSHA, REACH, ISO 45001)
- 4.2.3 IoT-Enabled Air-Quality Monitoring Roll-Outs (Smart Cities)
- 4.2.4 Surging Demand from Hydrogen Production and Fuel-Cell Value Chain
- 4.2.5 Emerging Methane-Leak Detection Rules for Oil and Gas (OGMP 2.0)
- 4.2.6 Miniaturised MEMS-Based Multi-Gas Arrays (< 3 mm) Driving ASP Uplift
- 4.3 Market Restraints
- 4.3.1 Sub-10 ppm Cross-Sensitivity Challenges in Mixed-Gas Matrices
- 4.3.2 Silicon Supply Volatility Inflating Wafer Prices
- 4.3.3 Lack of Global Calibration Standards Hampers Interchangeability
- 4.3.4 Cost Pressure from Low-End Chinese Electrochemical Suppliers
- 4.4 Industry Value-Chain Analysis
- 4.5 Regulatory Landscape
- 4.6 Technological Outlook
- 4.7 Impact of Macroeconomic Factors on the Market
- 4.8 Porter's Five Forces Analysis
- 4.8.1 Bargaining Power of Suppliers
- 4.8.2 Bargaining Power of Buyers
- 4.8.3 Threat of New Entrants
- 4.8.4 Threat of Substitutes
- 4.8.5 Intensity of Competitive Rivalry
5 MARKET SIZE AND GROWTH FORECASTS (VALUE)
- 5.1 By Gas Type
- 5.1.1 Oxygen
- 5.1.2 Carbon Monoxide (CO)
- 5.1.3 Carbon Dioxide (CO?)
- 5.1.4 Nitrogen Oxides (NO?)
- 5.1.5 Hydrocarbons (VOC/CH?)
- 5.1.6 Other Gases (SO?, H?S)
- 5.2 By Technology
- 5.2.1 Electrochemical
- 5.2.2 Photo-Ionisation (PID)
- 5.2.3 Solid-State / MOS
- 5.2.4 Catalytic Bead
- 5.2.5 Non-Dispersive Infra-Red (NDIR)
- 5.2.6 MEMS-Semiconductor Optical
- 5.3 By Form Factor
- 5.3.1 Fixed / In-Situ Modules
- 5.3.2 Portable / Hand-Held Devices
- 5.3.3 Wearable Badges / Patches
- 5.4 By Connectivity
- 5.4.1 Wired (4-20 mA, CAN, RS-485)
- 5.4.2 Wireless (BLE, NB-IoT, LoRaWAN)
- 5.5 By End-Use Industry
- 5.5.1 Industrial Safety and Process (Oil and Gas, Chemicals)
- 5.5.2 Automotive Powertrain and HVAC
- 5.5.3 Building Automation / Smart Homes
- 5.5.4 Medical and Life-Science Equipment
- 5.5.5 Food, Beverage and Cold-Chain Logistics
- 5.5.6 Environmental Monitoring and Smart City Nodes
- 5.6 By Geography
- 5.6.1 North America
- 5.6.1.1 United States
- 5.6.1.2 Canada
- 5.6.1.3 Mexico
- 5.6.2 South America
- 5.6.2.1 Brazil
- 5.6.2.2 Argentina
- 5.6.3 Europe
- 5.6.3.1 Germany
- 5.6.3.2 United Kingdom
- 5.6.3.3 France
- 5.6.3.4 Russia
- 5.6.4 Asia-Pacific
- 5.6.4.1 China
- 5.6.4.2 Japan
- 5.6.4.3 India
- 5.6.4.4 South Korea
- 5.6.5 Middle East and Africa
- 5.6.5.1 Middle East
- 5.6.5.1.1 United Arab Emirates
- 5.6.5.1.2 Saudi Arabia
- 5.6.5.2 Africa
- 5.6.5.2.1 South Africa
- 5.6.5.2.2 Rest of Africa
- 5.6.5.1 Middle East
- 5.6.1 North America
6 COMPETITIVE LANDSCAPE
- 6.1 Market Concentration
- 6.2 Strategic Moves
- 6.3 Market Share Analysis
- 6.4 Company Profiles (includes Global Level Overview, Market Level Overview, Core Segments, Financials as available, Strategic Information, Market Rank/Share, Products and Services, Recent Developments)
- 6.4.1 Robert Bosch GmbH
- 6.4.2 Honeywell International Inc. - City Technology
- 6.4.3 Dragerwerk AG & Co. KGaA
- 6.4.4 Figaro Engineering Inc.
- 6.4.5 Sensirion Holding AG
- 6.4.6 AlphaSense Inc.
- 6.4.7 Amphenol SGX Sensortech Ltd.
- 6.4.8 Membrapor AG
- 6.4.9 Nemoto and Co., Ltd.
- 6.4.10 Niterra Co., Ltd. (NGK-NTK)
- 6.4.11 Delphi Technologies (BorgWarner Inc.)
- 6.4.12 Senseair AB (Asahi Kasei Microdevices)
- 6.4.13 Dynament Ltd.
- 6.4.14 Siemens AG - BT Sensors
- 6.4.15 ABB Ltd. - Ability Gas Analytics
- 6.4.16 Yokogawa Electric Corporation
- 6.4.17 Emerson Electric Co. - Rosemount
- 6.4.18 Teledyne FLIR LLC
- 6.4.19 General Electric Company - Panametrics
- 6.4.20 Zhengzhou Winsen Electronics Technology Co., Ltd.
- 6.4.21 NevadaNano Inc.
- 6.4.22 MSA Safety Incorporated
7 MARKET OPPORTUNITIES AND FUTURE OUTLOOK
- 7.1 White-Space and Unmet-Need Assessment

 礦業雷射甲烷感測器市場報告:趨勢、預測和競爭分析(至2035年)
 氣體感測器、偵測器和分析儀器:市場佔有率分析、行業趨勢和統計數據以及成長預測(2026-2031 年)氧氣感知器:市場佔有率分析、產業趨勢與統計、成長預測(2026-2031)美國氣體感測器:市場佔有率分析、行業趨勢和統計數據、成長預測(2026-2031 年)
 氣體感測器市場:2026-2032年全球市場預測(按產品類型、連接方式、技術、類別、氣體類型、應用和最終用戶分類)低功耗、緊湊型氣體感測器市場:2026-2032年全球市場預測(依偵測技術、目標氣體類型、輸出介面、應用、銷售管道和最終用戶產業分類)
 全球氣體感測器市場規模、佔有率、趨勢和成長分析報告(2026-2034年)全球臭氧感測器市場:市場規模、佔有率、趨勢和成長分析(2026-2034)
 2026年全球建築用黑色花崗岩市場報告
 氣體感測器市場:按氣體類型、技術、最終用戶和地區分類