


 |
市場調查報告書
商品編碼
2121404
水產飼料:市場佔有率分析、產業趨勢與統計、成長預測(2026-2031)Aquafeed - Market Share Analysis, Industry Trends & Statistics, Growth Forecasts (2026 - 2031) |
||||||

※ 本網頁內容可能與最新版本有所差異。詳細情況請與我們聯繫。
預計到 2025 年,漁業飼料市場將佔全球市場價值的 63.7%,主要得益於鯉魚、吳郭魚和鮭魚在亞洲-大西洋地區水產養殖業的持續主導地位。
甲殼類動物飼料(主要用於蝦)預計將在 2026 年至 2031 年間以 5.4% 的複合年成長率成長,這主要得益於厄瓜多爾和印度太平洋白蝦產量的兩位數成長。
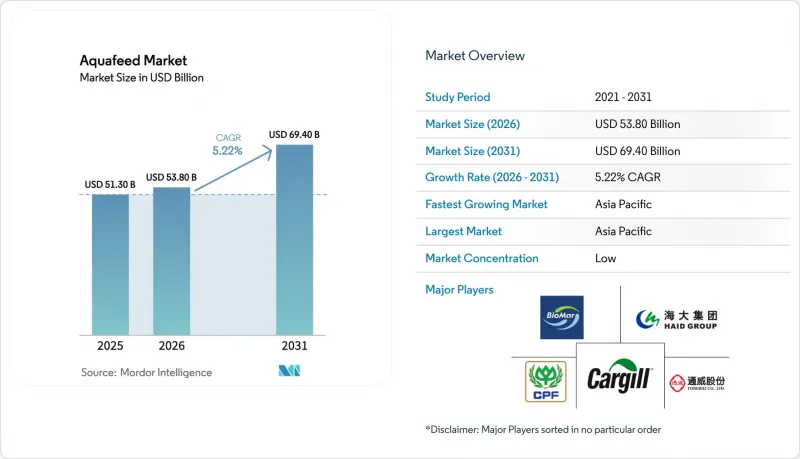
根據Mordor Intelligence預測,2025年水產養殖飼料市場規模預計為513億美元,2026年將達538億美元。本報告按類型(魚飼料、軟體動物飼料等)、原料(穀物、油籽和豆類等)、添加劑類型(胺基酸、維生素和礦物質等)、形態(顆粒飼料、膨化飼料等)、生長階段(雛魚、成魚等)和地區(北美、歐洲等)進行細分。市場預測以美元計價。
全球水產養殖飼料市場趨勢及洞察
全球水產品消費量增加
預計人均水產品消費量將從2019年的19.2公斤增加到2025年的21.4公斤,其中水產養殖已滿足58%的需求,凸顯了複合飼料的結構性利多。印度、印尼和奈及利亞不斷壯大的中產階級正將消費重心從穀物轉向魚貝類蛋白,即使在經濟成長放緩的情況下,也推動了海鮮消費的穩定成長。從飼料經濟角度來看,魚蝦每公斤活重僅需1.2至1.8公斤飼料,遠低於豬肉,進一步凸顯了水產養殖的效率優勢。光是在中國,預計到2031年,水產品需求將以每年3.8%的速度成長,不僅能消化自身創紀錄的產量,還能吸引越南、泰國等鄰國的產品。基於國際標準化組織(ISO)22000的統一食品安全標準降低了貿易摩擦,使飼料生產商擴大出口規模。這些因素共同促成了所有主要地區水產飼料市場的擴張,儘管原料成本上漲,但價格仍保持穩定。
集約化水產養殖系統的擴張
由於土地資源有限和人事費用不斷上漲,養殖方式正從大型池轉向高密度養殖系統,而高密度養殖需要高營養飼料。在挪威,近海網箱的養殖密度已達到每單位20萬條鮭魚,是傳統標準的兩倍。同時,在印度的生物絮團養殖池中,每公頃蝦產量翻了兩番。如此高的養殖密度增加了疾病風險,迫使飼料生產商採用「最低成本配方模型」來微調氨基酸和能量含量,以適應原料價格的日常波動。越南水產養殖戶已將養殖密度提高到每平方公尺150-200尾幼魚,因此需要購買蛋白質含量為38-42%且添加了活化的飼料。歐洲和美國的監管機構正在降低抗生素殘留基準值,迫使水產養殖場從使用藥物轉向使用功能性添加劑。所有這些因素都在增加對高品質飼料的需求,從而提升水產養殖飼料市場的價值,即使銷售量成長緩慢。
疾病爆發會導致飼料需求快速波動。
2024年,泰國爆發的「過早死亡症候群」導致蝦類漁獲量下降40%,飼料需求量因此季度減少18萬噸,迫使飼料廠停產。 2025年,厄瓜多和哥倫比亞爆發的「吳郭魚湖病毒」導致當地飼料需求量下降25%,庫存積壓數月。智利傳染性鮭魚貧血症的再次爆發導致800萬條魚被撲殺,飼料訂單減少3.5萬噸。由於市面上只有三種適用於蝦子的疫苗,而鮭魚疫苗卻有15種,甲殼類養殖戶不得不為含有活化促效劑的飼料支付8%至12%的高價。這些衝擊造成了難以預測的供應缺口,阻礙了水產養殖飼料市場的穩定擴張。
細分市場分析
儘管鱒魚、鱸魚和鯰魚飼料的價格仍然較為敏感,但由於疾病控制的需要,功能性添加劑的使用日益增多,促使買家轉向高階產品。目前,一種含有25-30%昆蟲蛋白和藻油的鮭魚飼料飼料正在測試中,旨在滿足零售商的永續發展標準,同時保持omega-3的含量。
甲殼類動物飼料市場的成長動能持續推動各地區原料流動格局的重新平衡,南美洲大豆粕的流入量增加,而挪威和越南飼料廠的昆蟲粉供應量也隨之加快。優質蝦飼料的價格已比一般魚飼料顆粒高出25%,在銷售量之前就已經提升了水產飼料市場的整體價值。軟體動物飼料這一細分市場的成長依然緩慢,凸顯了人們對中國牡蠣養殖場水質日益成長的擔憂。由於出口通路上巴沙魚的價格競爭,鯰魚的需求保持平穩,但隨著含有特定免疫促效劑的產品的推出,預計從2027年起利潤率將有所回升。
到2025年,油籽和豆類將佔市場價值的29.6%,凸顯了大豆粕(每噸500美元)相對於魚粉(每噸1500美元)的成本優勢。隨著歐洲食品安全局(EFSA)近期批准昆蟲粉、藻類和單細胞蛋白等新型蛋白質安全,預計在2026年至2031年的預測期內,其複合年成長率將達到6.0%,到2031年將佔總複合成本的9%。魚粉和魚油在幼蟲和成蟲階段的功能性作用不可替代,因此它們仍然是原料預算的重要組成部分。穀物衍生的能源來源使擠壓生產線能夠達到顆粒耐久性所需的澱粉含量目標。
黑甲蟲幼蟲在鱒魚和鱸魚飼料中的應用日益廣泛,已使每公斤蛋白質的土地和水資源佔用量減少了90%以上,這一效益目前已被貸款機構納入環境貸款協議。預計到2027年,透過氣體發酵獲得的單細胞蛋白價格將達到每噸900美元,遠低於目前的昆蟲原料價格。中國的初步試驗也表明,這種蛋白質可以以高達40%的比例添加到吳郭魚飼料中。儘管魚粉價格不時上漲,但這些進展正在推動供應鏈多元化,並進一步增強水產養殖飼料市場的成長前景。
區域分析
到2025年,亞太地區將佔全球水產飼料市場價值的69.9%,預計2031年將以5.5%的複合年成長率成長。中國3000萬噸的漁獲量推動了國內需求,而印度的蝦類養殖場消耗85萬噸甲殼類飼料。越南70%的巴沙魚和蝦類產量依賴出口,因此極易受到歐洲永續性法規的影響,這些法規強制要求大豆可追溯性。泰國正在從疾病爆發中恢復,並透過降低養殖密度,將每公頃飼料用量減少了高達20%。印尼政府的價格上限政策穩定了水產養殖戶的成本,但也限制了飼料加工廠對新擠壓生產線的投資。日本是單細胞蛋白的試驗場,而澳洲的陸基鮭魚養殖場則需要高能量飼料。所有這些因素都促成了高價利基市場的形成,從而提升了該地區在水產養殖飼料市場的佔有率。
中東和非洲地區正呈現成長態勢。埃及的吳郭魚養殖業消耗45萬噸複合飼料,奈及利亞的鯰魚養殖業年增率達10%。沙烏地阿拉伯的目標是到2030年實現陸基養殖鮭魚10萬噸的產量,並正吸引跨國飼料生產商在當地生產混合飼料,以規避25%的進口關稅。土耳其嚴重依賴鱸魚出口,面臨外匯波動擠壓利潤空間的挑戰。同時,南非正計劃發展電力基礎設施,這可能會使東開普省貝類養殖區的飼料需求增加兩倍。在這些新興中心地區,區域政府的支持對於維持水產養殖飼料市場的成長至關重要。
在歐洲和北美,水產養殖業的成長步伐更為穩定。光是挪威就消耗180萬噸飼料,並在配方技術方面持續創新,例如測試含有20%昆蟲來源成分和10%藻油的鮭魚飼料。蘇格蘭新近獲批的近海養殖網箱要求使用能夠沉至40-60公尺深處且營養價值不受影響的顆粒飼料。美國緬因州和加州的循環水養殖鮭魚場對優質飼料的需求增加了2萬噸,飼料生產商願意支付的價格幾乎是吳郭魚飼料的三倍。智利正在從疾病的影響中恢復,西班牙的有機海鱸市場成長了12%,這有利於符合水產養殖管理委員會(ASC)標準的飼料生產商。這些項目共同鞏固了已開發國家對水產養殖飼料市場規模的貢獻,儘管亞洲仍然主導。
其他好處:
- Excel格式的市場預測(ME)表
- 3個月的分析師支持
目錄
第1章:引言
- 研究假設和市場定義
- 調查範圍
第2章:調查方法
第3章執行摘要
第4章 市場狀況
- 市場概覽
- 市場促進因素
- 全球水產品消費量增加
- 集約化水產養殖系統的擴張
- 功能性飼料添加劑和精準營養的進展
- 強制使用區塊鏈技術進行原料追溯
- 與環境、社會及公司治理 (ESG) 相關的融資條款正在加速替代蛋白的採用。
- 人工智慧驅動的自動餵食可提高飼料轉換率。
- 市場限制因素
- 魚粉和魚油價格波動
- 導致飼料需求快速波動的疾病的出現
- 對水產養殖廢水中磷的排放實施更嚴格的限制。
- 新蛋白質的供應正在向高階寵物食品領域轉移。
- 監理情勢
- 技術展望
- 波特五力分析
第5章 市場規模與成長預測
- 類型
- 魚飼料
- 鯉魚
- 鮭魚
- 吳郭魚
- 鯰魚
- 其他
- 軟體動物飼料
- 甲殼類動物飼料
- 蝦
- 其他
- 其他
- 魚飼料
- 按成分
- 穀類和穀類食品
- 油籽/豆類
- 魚粉/魚油
- 新型蛋白質(昆蟲、藻類、單株抗體)
- 添加劑
- 其他
- 按添加劑類型
- 胺基酸
- 維生素和礦物質
- 益生菌
- 酵素
- 抗氧化劑
- 其他
- 按形式
- 顆粒
- 擠壓飼料
- 粉末
- 液體
- 依生命週期階段
- 起動機
- 種植者
- 終結者
- 父系
- 按地區
- 北美洲
- 美國
- 加拿大
- 墨西哥
- 其他北美國家
- 歐洲
- 西班牙
- 英國
- 法國
- 德國
- 義大利
- 俄羅斯
- 其他歐洲國家
- 亞太地區
- 中國
- 印度
- 日本
- 泰國
- 越南
- 澳洲
- 其他亞太國家
- 南美洲
- 巴西
- 阿根廷
- 其他南美國家
- 中東
- 土耳其
- 沙烏地阿拉伯
- 阿拉伯聯合大公國
- 其他中東國家
- 非洲
- 南非
- 埃及
- 其他非洲國家
- 北美洲
第6章 競爭情勢
- 市場集中度
- 策略趨勢
- 市佔率分析
- 公司簡介
- Cargill, Incorporated
- SHV Holdings NV(NUTRECO NV)
- BioMar Group A/S
- Charoen Pokphand Foods Public Company Limited
- Archer Daniels Midland Company
- Alltech Inc.
- JAPFA Ltd.
- De Heus Animal Nutrition
- Tongwei Co., Ltd.
- Aller Aqua A/S
- Guangdong HAID Group Co., Ltd.
- INVE Technologies NV
- Avanti Feeds Limited
- Thai Union Group Public Company Limited
- Godrej Agrovet Limited(Godrej Enterprises Group)
- Growel Feeds Private Limited
第7章 市場機會與未來展望
The aquafeed market size for fish feed accounted for 63.7% of the global value in 2025, is driven by the continued dominance of carp, tilapia, and salmon in Asian and Atlantic farm budgets. Crustacean formulas, led by shrimp, are experiencing a 5.4% CAGR from 2026 to 2031, driven by double-digit growth in vannamei harvests in Ecuador and India.
According to Mordor Intelligence, the aquafeed market size was valued at USD 51.30 billion in 2025 and is estimated to reach USD 53.80 billion in 2026. This report is Segmented by Species (Fish Feed, Mollusk Feed, and More), by Ingredient (Cereals and Grains, Oilseeds and Pulses, and More), by Additive Type (Amino Acids, Vitamins and Minerals, and More), by Form (Pellets, Extruded Feed, and More), by Life-Cycle Stage (Starter, Grower, and More), and by Geography (North America, Europe, and More). The Market Forecasts are Provided in Terms of Value (USD).
Global Aquafeed Market Trends and Insights
Rising Global Seafood Consumption
Per-capita seafood intake climbed to 21.4 kilograms in 2025, up from 19.2 kilograms in 2019, and aquaculture already supplies 58% of that demand, underscoring the structural tailwind for formulated feeds. The expanding middle classes in India, Indonesia, and Nigeria are trading up from cereals to fish proteins, driving steady consumption even as economic growth cools. Feed economics reinforce the appeal that fish and shrimp require only 1.2-1.8 kilograms of feed per kilogram of live weight, significantly lower than pork, giving aquaculture an efficiency edge. China alone projects seafood demand to rise 3.8% annually through 2031, absorbing most of its own record output and drawing product from neighbors such as Vietnam and Thailand. Harmonized food-safety rules under the International Organization for Standardization (ISO) 22000 are reducing trade friction and enabling mills to scale for export. These forces combine to lift the aquafeed market across all major regions, while sustaining price discipline despite raw material inflation.
Expansion of Intensive Aquaculture Farming Systems
Land constraints and rising labor costs are prompting a shift from extensive ponds to high-density systems that need nutrient-dense feeds. Offshore cages in Norway now stock 200,000 salmon per unit, double prior norms, while biofloc ponds in India yield four times the shrimp per hectare. Such density raises disease risk, so mills must fine-tune amino acid and energy levels using least-cost formulation models that react to daily ingredient prices. Vietnam's operators have increased their stocking density to 150-200 post-larvae per square meter and consequently purchase feeds with 38-42% protein, plus immunostimulants. Regulators in Europe and the United States are lowering antibiotic residue ceilings, prompting farms to shift toward functional additives rather than drugs. All of these factors increase demand for premium rations and boost the aquafeed market value, even if volume gains moderate.
Disease Outbreaks Causing Abrupt Feed-Demand Swings
Early Mortality Syndrome slashed Thai shrimp harvests by 40% in 2024, resulting in a 180,000 metric tons reduction in feed demand in one quarter and forcing mill shutdowns. In 2025, Tilapia Lake Virus in Ecuador and Colombia cut local feed offtake by 25% and left inventories unsold for months. Resurgent Infectious Salmon Anemia in Chile removed 8 million fish and reduced feed orders by 35,000 metric tons. Shrimp still has only three commercial vaccines versus fifteen for salmon, so crustacean farmers must pay 8-12% more for immunostimulant rations. Such shocks create unpredictable volume gaps that limit the steady expansion of the aquafeed market.
Other drivers and restraints analyzed in the detailed report include:
- Advances in Functional Feed Additives and Precision Nutrition
- Blockchain-Enabled Raw-Material Traceability Mandates
- Stricter Phosphorus-Discharge Caps on Aquaculture Effluents
For complete list of drivers and restraints, kindly check the Table Of Contents.
Segment Analysis
Trout, seabass, and catfish feeds remain price sensitive, but disease-driven shifts toward functional additives are moving buyers into premium tiers. Salmon diets are now being trialed with 25-30% insect protein alongside algae oil to protect omega-3 levels while meeting retailer sustainability codes.
Growth momentum within the crustacean segment continues to rebalance regional ingredient flows, drawing more soybean meal into South America and attracting insect meal to Norwegian and Vietnamese mills. Premium shrimp formulas already command 25% higher prices than generic fish grower pellets, driving up the overall aquafeed market value ahead of volume. Niche gains in mollusk feed remain small but highlight rising water-quality concerns in Chinese oyster farms. Catfish demand is flat as pangasius competes on price in export channels, yet targeted immunostimulant blends are projected to revive margins from 2027 onward.
Oilseeds and pulses held a 29.6% value share in 2025, underscoring the cost advantage of soybean meal, which trades at USD 500 per metric ton, compared to fish meal at USD 1,500. Novel proteins, including insect meal, algae, and single-cell protein, are projected to grow at a CAGR of 6.0% during the 2026-2031 forecast period and account for 9% of total formulation spending by 2031, following recent safety approvals by the European Food Safety Authority. Fish meal and fish oil still account for a significant portion of ingredient budgets, as their functional role in larval and broodstock stages remains irreplaceable. Grain energy sources enable extrusion lines to meet the starch targets necessary for pellet durability.
The rising uptake of black soldier fly larvae in trout and seabass feeds is reducing land and water footprints by more than 90% per kilogram of protein, an advantage that lenders are now incorporating into environmental loan covenants. Single-cell protein from gas fermentation is on track to cost USD 900 per metric ton by 2027, which is well below current insect prices, and pilots in China suggest including levels of up to 40% in tilapia diets. Such gains diversify supply chains and reinforce the outlook for aquafeed market growth, despite periodic spikes in fishmeal prices.
Complete Report Scope:
- By Species
- Fish Feed
- Carp
- Salmon
- Tilapia
- Catfish
- Other Fish Feed
- Mollusk Feed
- Crustacean Feed
- Shrimp
- Other Crustacean Feed
- Other Aquafeed
- Fish Feed
- By Ingredient
- Cereals and Grains
- Oilseeds and Pulses
- Fish Meal and Fish Oil
- Novel Proteins (Insect, Algae, SCP)
- Additives
- Others
- By Additive Type
- Amino Acids
- Vitamins and Minerals
- Probiotics
- Enzymes
- Antioxidants
- Others
- By Form
- Pellets
- Extruded Feed
- Powder
- Liquid
- By Life-cycle Stage
- Starter
- Grower
- Finisher
- Broodstock
- By Geography
- North America
- United States
- Canada
- Mexico
- Rest of North America
- Europe
- Spain
- United Kingdom
- France
- Germany
- Italy
- Russia
- Rest of Europe
- Asia-Pacific
- China
- India
- Japan
- Thailand
- Vietnam
- Australia
- Rest of Asia-Pacific
- South America
- Brazil
- Argentina
- Rest of South America
- Middle East
- Turkey
- Saudi Arabia
- United Arab Emirates
- Rest of Middle East
- Africa
- South Africa
- Egypt
- Rest of Africa
- North America
Geography Analysis
The Asia-Pacific region generated 69.9% of the 2025 aquafeed market value and is projected to grow at a CAGR of 5.5% through 2031. China's 30 million metric tons harvest drives local demand while India's shrimp ponds absorb 850,000 metric tons of crustacean diets. Vietnam relies on exports for 70% of its pangasius and shrimp, making the industry sensitive to European sustainability rules that require soybean traceability. Thailand's recovery from disease outbreaks is underway, yet lower-density stocking has trimmed feed per hectare by up to 20%. Government price caps in Indonesia stabilize farmer costs but limit mill investment in new extrusion lines. Japan serves as a sandbox for single-cell proteins, and Australia's land-based salmon farms require high-energy diets, both contributing to premium-price niches that boost the regional aquafeed market share.
Africa and the Middle East are experiencing growth, as Egypt's tilapia segment consumes 450,000 tons of formulations and Nigeria's catfish sector increases by 10% annually. Saudi Arabia aims to produce 100,000 metric tons of land-based salmon by 2030 and is attracting multinational mills to build regional blends that will avoid 25% import tariffs. Turkey relies heavily on seabass exports and struggles with currency fluctuations that narrow margins, while South Africa plans electricity upgrades that could triple feed demand in Eastern Cape shellfish zones. Regional government backing is key to sustaining aquafeed market growth in these nascent hubs.
Europe and North America grow at a steadier rate. Norway alone consumes 1.8 million metric tons of feed and pushes formulation innovation by testing 20% insect inclusion and 10% algae oil in salmon diets. Scotland's newly licensed offshore cages demand pellets that sink 40-60 meters without nutrient loss. United States recirculating salmon farms in Maine and California are adding 20,000 tons of premium demand and paying almost triple tilapia feed prices. Chile rebounds from disease shocks and Spain's organic seabass segment is climbing 12%, rewarding mills that meet Aquaculture Stewardship Council standards. Together these projects consolidate the developed-world contribution to the aquafeed market size even as Asia keeps the lead.
- Cargill, Incorporated
- SHV Holdings N.V. (NUTRECO N.V.)
- BioMar Group A/S
- Charoen Pokphand Foods Public Company Limited
- Archer Daniels Midland Company
- Alltech Inc.
- JAPFA Ltd.
- De Heus Animal Nutrition
- Tongwei Co., Ltd.
- Aller Aqua A/S
- Guangdong HAID Group Co., Ltd.
- INVE Technologies N.V.
- Avanti Feeds Limited
- Thai Union Group Public Company Limited
- Godrej Agrovet Limited (Godrej Enterprises Group)
- Growel Feeds Private Limited
Additional Benefits:
- The market estimate (ME) sheet in Excel format
- 3 months of analyst support
TABLE OF CONTENTS
1 Introduction
- 1.1 Study Assumptions and Market Definition
- 1.2 Scope of the Study
2 Research Methodology
3 Executive Summary
4 Market Landscape
- 4.1 Market Overview
- 4.2 Market Drivers
- 4.2.1 Rising global seafood consumption
- 4.2.2 Expansion of intensive aquaculture farming systems
- 4.2.3 Advances in functional feed additives and precision nutrition
- 4.2.4 Blockchain-enabled raw-material traceability mandates
- 4.2.5 ESG-linked loan covenants accelerating uptake of alternative proteins
- 4.2.6 AI-driven feeding automation improving feed-conversion ratios
- 4.3 Market Restraints
- 4.3.1 Volatility in fish-meal and fish-oil prices
- 4.3.2 Disease outbreaks causing abrupt feed-demand swings
- 4.3.3 Stricter phosphorus-discharge caps on aquaculture effluents
- 4.3.4 Novel-protein supply diverted to premium pet-food segment
- 4.4 Regulatory Landscape
- 4.5 Technological Outlook
- 4.6 Porter's Five Forces Analysis
- 4.6.1 Threat of New Entrants
- 4.6.2 Bargaining Power of Suppliers
- 4.6.3 Bargaining Power of Buyers
- 4.6.4 Threat of Substitutes
- 4.6.5 Intensity of Competitive Rivalry
5 Market Size and Growth Forecasts (Value)
- 5.1 By Species
- 5.1.1 Fish Feed
- 5.1.1.1 Carp
- 5.1.1.2 Salmon
- 5.1.1.3 Tilapia
- 5.1.1.4 Catfish
- 5.1.1.5 Other Fish Feed
- 5.1.2 Mollusk Feed
- 5.1.3 Crustacean Feed
- 5.1.3.1 Shrimp
- 5.1.3.2 Other Crustacean Feed
- 5.1.4 Other Aquafeed
- 5.1.1 Fish Feed
- 5.2 By Ingredient
- 5.2.1 Cereals and Grains
- 5.2.2 Oilseeds and Pulses
- 5.2.3 Fish Meal and Fish Oil
- 5.2.4 Novel Proteins (Insect, Algae, SCP)
- 5.2.5 Additives
- 5.2.6 Others
- 5.3 By Additive Type
- 5.3.1 Amino Acids
- 5.3.2 Vitamins and Minerals
- 5.3.3 Probiotics
- 5.3.4 Enzymes
- 5.3.5 Antioxidants
- 5.3.6 Others
- 5.4 By Form
- 5.4.1 Pellets
- 5.4.2 Extruded Feed
- 5.4.3 Powder
- 5.4.4 Liquid
- 5.5 By Life-cycle Stage
- 5.5.1 Starter
- 5.5.2 Grower
- 5.5.3 Finisher
- 5.5.4 Broodstock
- 5.6 By Geography
- 5.6.1 North America
- 5.6.1.1 United States
- 5.6.1.2 Canada
- 5.6.1.3 Mexico
- 5.6.1.4 Rest of North America
- 5.6.2 Europe
- 5.6.2.1 Spain
- 5.6.2.2 United Kingdom
- 5.6.2.3 France
- 5.6.2.4 Germany
- 5.6.2.5 Italy
- 5.6.2.6 Russia
- 5.6.2.7 Rest of Europe
- 5.6.3 Asia-Pacific
- 5.6.3.1 China
- 5.6.3.2 India
- 5.6.3.3 Japan
- 5.6.3.4 Thailand
- 5.6.3.5 Vietnam
- 5.6.3.6 Australia
- 5.6.3.7 Rest of Asia-Pacific
- 5.6.4 South America
- 5.6.4.1 Brazil
- 5.6.4.2 Argentina
- 5.6.4.3 Rest of South America
- 5.6.5 Middle East
- 5.6.5.1 Turkey
- 5.6.5.2 Saudi Arabia
- 5.6.5.3 United Arab Emirates
- 5.6.5.4 Rest of Middle East
- 5.6.6 Africa
- 5.6.6.1 South Africa
- 5.6.6.2 Egypt
- 5.6.6.3 Rest of Africa
- 5.6.1 North America
6 Competitive Landscape
- 6.1 Market Concentration
- 6.2 Strategic Moves
- 6.3 Market Share Analysis
- 6.4 Company Profiles (Includes Global Level Overview, Market Level Overview, Core Segments, Financials as Available, Strategic Information, Market Rank/Share for Key Companies, Products and Services, and Recent Developments)
- 6.4.1 Cargill, Incorporated
- 6.4.2 SHV Holdings N.V. (NUTRECO N.V.)
- 6.4.3 BioMar Group A/S
- 6.4.4 Charoen Pokphand Foods Public Company Limited
- 6.4.5 Archer Daniels Midland Company
- 6.4.6 Alltech Inc.
- 6.4.7 JAPFA Ltd.
- 6.4.8 De Heus Animal Nutrition
- 6.4.9 Tongwei Co., Ltd.
- 6.4.10 Aller Aqua A/S
- 6.4.11 Guangdong HAID Group Co., Ltd.
- 6.4.12 INVE Technologies N.V.
- 6.4.13 Avanti Feeds Limited
- 6.4.14 Thai Union Group Public Company Limited
- 6.4.15 Godrej Agrovet Limited (Godrej Enterprises Group)
- 6.4.16 Growel Feeds Private Limited
7 Market Opportunities and Future Outlook

 中國水產飼料:市場佔有率分析、產業趨勢與統計及成長預測(2026-2031年)亞太地區水產飼料:市場佔有率分析、產業趨勢與統計、成長預測(2026-2031)歐洲水產飼料:市場佔有率分析、產業趨勢與統計及成長預測(2026-2031)
 水產養殖飼料市場:2026-2032年全球市場預測(依飼料種類、食材種類、原料來源種類、目標魚類、水產養殖系統、水產養殖環境、飼料配方、最終使用者和分銷管道分類)微藻類水產飼料:市場佔有率分析、行業趨勢和統計數據以及成長預測(2026-2031 年)
 水產飼料市場報告:按魚類品種、原料、添加劑、產品形式和地區分類(2026-2034 年)
 水生幼蟲飼料市場規模、佔有率和成長分析:按類型、應用、配方/形式、配銷通路、物種、地區和行業預測,2026-2033年
 水產養殖飼料酵素市場規模、佔有率和成長分析:按酵素類型、酵素形態、水生動物和地區分類-2026-2033年產業預測
 水產飼料市場規模、佔有率、成長和全球產業分析:按類型、應用和地區分類,並對 2026-2034 年進行洞察和預測。全球飼料市場規模、佔有率、趨勢和成長分析報告(2026-2034年)