

 |
市場調查報告書
商品編碼
2121209
金屬罐:市場佔有率分析、產業趨勢與統計、成長預測(2026-2031)Metal Cans - Market Share Analysis, Industry Trends & Statistics, Growth Forecasts (2026 - 2031) |
||||||

※ 本網頁內容可能與最新版本有所差異。詳細情況請與我們聯繫。
據 Mordor Intelligence 稱,全球金屬罐市場預計到 2026 年價值 884.5 億美元,高於 2025 年的 854.4 億美元,預計到 2031 年將達到 1050.6 億美元。
預計從 2026 年到 2031 年,其複合年成長率將達到 3.52%。
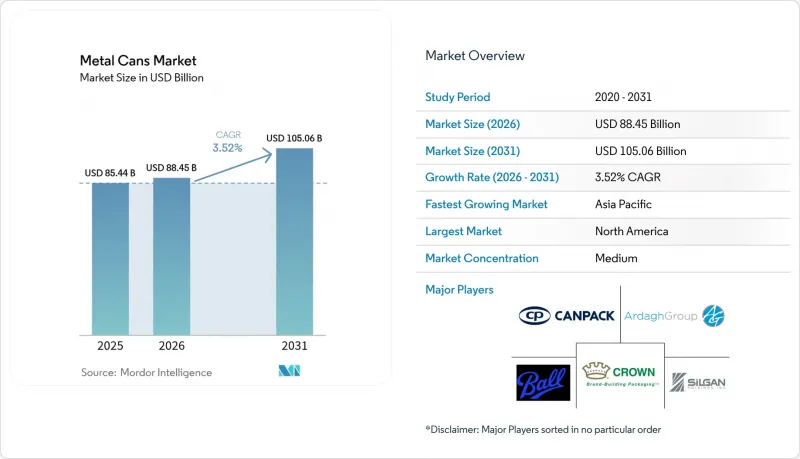
本報告按材料類型(鋁、鋼)、罐體結構(兩片式、三片式等)、容量/尺寸(250毫升以下、250-500毫升等)、製造程序(拉拔/壓扁、拉拔/再拉拔等)、終端用戶行業(食品、飲料、個人護理/化妝品等)和地區(北美等)細分。市場預測以美元計價。
全球金屬罐市場趨勢與洞察
鋁價波動正在加速輕質材料的採用。
面對鋁價的不可預測波動,製造商並沒有犧牲利潤率,反而選擇減少材料用量。將於2024年實現商業化的「ReAl Gen 2」技術,可在維持罐體頂部承重強度的同時,將罐壁厚度減少高達15%,從而直接抵消原料價格波動的影響。更輕的罐體還能減少物流過程中的排放,符合企業實現淨零排放的藍圖。高階品牌正積極承擔採用這項技術帶來的額外成本,因為其美觀性和永續性足以支撐更高的商店價格。專利趨勢表明,設計師們正在對精細合金配方進行微調,以提高強度重量比並實現高速衝擊擠壓。隨著生產線的不斷轉型,金屬罐市場正經歷材料強度降低和經濟韌性增強的良性循環。
全球DRS計劃延長儲值週期。
強制性押金返還系統 (DRS) 完善了飲料容器的循環利用,使可無限循環利用的鋁材獲得了系統性的優勢。修訂後的歐洲包裝和包裝廢棄物法規將於 2024 年生效,其中設定了雄心勃勃的特定材料回收目標,而鋁材則完全可以輕鬆實現這些目標。新加坡和德國的回收率超過 90%,透過提供穩定的再生原料供應,鋁材能夠保護製造商免受原生原料供應波動帶來的風險。這項循環利用減少了生命週期排放,並降低了生產商的遵循成本。因此,品牌所有者正在鼓勵在新的飲料細分市場中轉向使用罐裝。隨著基礎設施的完善,押金返還系統的經濟效益使得金屬罐市場相比 PET 和軟包裝更具吸引力。
PET和軟包裝在新興市場的成本優勢
在收入水準仍然較低的地區, 寶特瓶和包裝袋的運費比罐裝飲料便宜15-25%,這減緩了金屬罐在印度、巴西和東南亞部分地區的普及速度。 PET樹脂的本地化生產和輕量化的物流運輸也使得商店價格保持在較低水準。然而,印度將於2024年生效的新的生產者責任召回(EPR)法規將使廢棄產品的處置責任貨幣化,從而逐步削弱塑膠的價格優勢,零售商也開始考慮為其高階子品牌使用鋁製容器。
細分市場分析
預計到2025年,鋁將佔據金屬罐市場70.56%的主導佔有率,並在2031年之前保持4.35%的複合年成長率。此主導地位得益於閉合迴路回收系統,與原生提煉相比,該系統可減少95%的能源消耗,從而降低品牌所有者的範圍3排放。在飲料、個人護理和製藥行業,負責人正利用鋁的印刷適性和耐腐蝕性來打造差異化的高階產品。同時,隨著鋼鐵製造商在日益成長的脫碳壓力下面臨越來越重的碳排放稅負擔,鋁的優勢也日益凸顯。
在某些領域,鋼材仍然是至關重要的材料,因為在這些領域,物理強度比增加重量的缺點更為重要——主要體現在罐裝肉類和已調理食品的生產中。然而,持續不斷的脫碳成本正在削弱其長期的價格競爭力。生產商正透過在馬口鐵中添加鉻來降低厚度,但替代的風險仍然存在。對投資者而言,金屬罐市場呈現明顯的材料兩極化:鋁材引領成長,而鋼材則提供穩定性。
2025年,兩片式罐仍將維持54.06%的市場佔有率,這得益於高效的拉拔和壓制生產線每年可生產數十億個飲料罐。這種罐型在重量、成本和堆疊強度之間取得了平衡,凸顯了其作為金屬罐市場規模基礎的地位。在創新方面,受個人護理品牌對無縫罐體和先進閥門的需求驅動,一體式氣霧罐設計正以4.78%的複合年成長率快速成長。
衝擊擠壓成型的單體罐體可實現可重複填充的墨盒系統和超輕罐身,從而為除臭劑和發用噴霧開發出環保高階的價格區間。三片式焊接罐體雖然市場佔有率正在萎縮,但在大批量食品服務和特種產品領域仍保持著一定的市場需求,因為在這些領域,客製化化的罐體直徑和瓶頸形狀比重量更為重要。總而言之,罐體結構的多樣性使加工商能夠滿足各種產品的黏度、填充壓力和保存期限要求。
區域分析
到2025年,北美將以39.72%的市佔率引領全球金屬罐市場。成熟的軟性飲料消費、高效的挨家挨戶回收以及生產者責任延伸(EPR)法規支撐著穩定的金屬罐需求。區域鋁回收率維持在75%左右,確保了供應穩定,同時減少了對新金屬的依賴。近期宣布的在美國和墨西哥投資超過2億美元用於擴大新產能的計劃,顯示了對市場長期穩定成長的信心。
預計到2031年,亞太地區的複合年成長率將達到5.88%,成為全球成長最快的地區。由於都市區化、中產階級收入的成長以及即飲飲料創新技術的蓬勃發展,罐裝飲料的銷售持續成長。日本的押金制度預計到2024年將回收93%的鋁罐,為鄰國的循環經濟樹立了標竿。中國從進口依賴型經濟轉型為區域出口中心,體現了其向國內製造業戰略的轉變,以及對全球供應鏈日益增強的影響力。
在歐洲,機會與挑戰並存。嚴格的雙酚A(BPA)法規要求對內襯材料進行成本高昂的改造,但這些法規也提高了永續性,並加速了從鋼罐向鋁罐的轉變。 「綠色新政」的循環經濟目標將提高回收溢價,雖然這會帶來短期合規負擔,但最終將支撐金屬易拉罐市場。南美、中東和非洲是需求的前沿地區,但基礎設施不足和價格敏感度阻礙了易拉罐的普及。然而,生產者責任延伸(EPR)框架的逐步完善和數位化有望在預測期內提高易拉罐的普及率。
其他好處:
- Excel格式的市場預測(ME)表
- 3個月的分析師支持
目錄
第1章:引言
- 研究假設和市場定義
- 調查範圍
第2章:調查方法
第3章執行摘要
第4章 市場狀況
- 市場概覽
- 產業價值鏈分析
- 波特五力分析
- 宏觀經濟因素對市場的影響
- 市場促進因素
- 鋁價波動正在加速輕量化設計的普及。
- 世界各地的DRS計畫正在擴大儲值週期。
- 即飲飲料新品上市數量增加
- 為減少食物廢棄物,人們正在努力開發可在室溫下儲存的產品。
- 面向個人護理領域「家庭水療」趨勢的工藝風格氣霧劑包裝。
- 智慧列印(QR/NFC)可實現供應鏈的可追溯性。
- 市場限制因素
- PET和軟包裝在新興市場的成本優勢
- 歐盟關於環氧樹脂襯裡中雙酚A滲出的規定
- 鋼鐵廠脫碳的成本推高了原物料價格。 †
- 電子商務向「使用自有貨櫃出貨」轉型
第5章 市場規模與成長預測
- 材料類型
- 鋁
- 鋼
- 透過可結構
- 兩件套
- 3 件
- 單體氣霧劑
- 按生產能力/規模
- 250毫升或以下
- 250~500 ml
- 500~1,000 ml
- 超過1000毫升
- 透過製造程序
- 無人機與鋼鐵(D&I)
- 繪製與重繪 (DRD)
- 衝擊擠壓
- 按最終用戶行業分類
- 食物
- 飲料
- 個人護理化妝品
- 製藥
- 油漆和工業化學品
- 汽車用液體和潤滑劑
- 其他終端用戶產業
- 按地區
- 北美洲
- 美國
- 加拿大
- 墨西哥
- 南美洲
- 巴西
- 阿根廷
- 智利
- 其他南美國家
- 歐洲
- 英國
- 德國
- 法國
- 西班牙
- 義大利
- 其他歐洲國家
- 亞太地區
- 中國
- 印度
- 日本
- 澳洲
- 韓國
- 越南
- 其他亞太國家
- 中東和非洲
- 中東
- 沙烏地阿拉伯
- 阿拉伯聯合大公國
- 土耳其
- 其他中東國家
- 非洲
- 南非
- 奈及利亞
- 埃及
- 其他非洲國家
- 中東
- 北美洲
第6章 競爭情勢
- 市場集中度
- 策略趨勢
- 市佔率分析
- 公司簡介
- Ball Corporation
- Crown Holdings Inc.
- Ardagh Group SA
- Silgan Holdings Inc.
- CAN-PACK SA
- Toyo Seikan Group Holdings Ltd.
- CPMC Holdings Ltd.
- Showa Denko KK
- Mauser Packaging Solutions LLC
- DS Containers Inc.
- CCL Container Inc.
- Independent Can Company
- Hindustan Tin Works Ltd.
- Saudi Arabian Packaging Industry Co.(SAPIN)
- Kian Joo Can Factory Berhad
- Colep Packaging SA
- Can-One Berhad
- Greif Metal Packaging Division
- Massilly Holding SAS
- Universal Can Corp.
- Pacific Can China Holdings Ltd.
第7章 市場機會與未來展望
According to Mordor Intelligence, the global metal cans market size in 2026 is estimated at USD 88.45 billion, growing from 2025 value of USD 85.44 billion with 2031 projections showing USD 105.06 billion, growing at 3.52% CAGR over 2026-2031.
This report is Segmented by Material Type (Aluminium, and Steel), Can Structure (Two-Piece, Three-Piece, and More), Capacity/Size (<=250ml, 250-500ml, and More), Manufacturing Process (Drawn and Ironed, Drawn and Redrawn, and More), End-User Industry (Food, Beverage, Personal Care and Cosmetics, and More), and Geography (North America, and More). The Market Forecasts are Provided in Terms of Value (USD).
Global Metal Cans Market Trends and Insights
Aluminum Price Volatility Accelerates Lightweighting Adoption
Manufacturers are answering unpredictable aluminum costs by cutting material use instead of sacrificing margins. ReAl Gen 2, commercialized in 2024, reduces can wall thickness up to 15% while preserving top-load strength, directly offsetting commodity swings. Lighter cans also ease logistics emissions, aligning with corporate net-zero roadmaps. Premium brands willingly absorb the incremental technology cost because the aesthetic and sustainability credentials support higher shelf prices. Patent activity shows designers fine-tuning micro-alloy recipes that raise strength-to-weight ratios and enable high-speed impact extrusion. As more lines convert, the metal cans market enjoys a reinforcing cycle of lower material intensity and enhanced economic resilience.
Global DRS Programs Expanding Refill-Deposit Loops
Mandatory deposit-return systems are closing the loop on beverage containers and systematically advantaging infinitely recyclable aluminum. Europe's updated Packaging and Packaging Waste Regulation, in force since 2024, sets aggressive material-specific targets that aluminum readily meets. Singapore and Germany post return rates above 90%, providing reliable secondary feedstock that shields manufacturers from volatile virgin supply. These loops shrink lifecycle emissions and reduce producer compliance fees, which in turn encourage brand owners to pivot toward cans in new beverage sub-segments. As infrastructure matures, DRS economics further elevate the attractiveness of the metal cans market relative to PET and flexibles.
PET and Flexibles Cost Advantage in Emerging Markets
Where incomes stay modest, PET bottles and pouches undercut cans by 15-25% on a delivered-cost basis, slowing metal penetration in India, Brazil, and parts of Southeast Asia. PET's local resin output and lightweight logistics keep shelf prices low. Yet new Indian EPR rules effective 2024 have started to erode plastics' price edge by monetizing end-of-life liabilities, encouraging retailers to trial aluminum formats for aspirational sub-brands.
Other drivers and restraints analyzed in the detailed report include:
- Growth in RTD Beverage Launches
- Food-Waste Reduction Initiatives Driving Shelf-Stable Formats
- EU BPA-Migration Limits on Epoxy Liners
For complete list of drivers and restraints, kindly check the Table Of Contents.
Segment Analysis
Aluminum captured a commanding 70.56% metal cans market share in 2025 and is on course for a 4.35% CAGR through 2031. That dominance rests on closed-loop recycling systems that require 95% less energy than primary smelting, lowering scope 3 emissions for brand owners. Across beverages, personal care, and pharmaceuticals, marketers leverage aluminum's printable surface and corrosion resistance to differentiate premium SKUs. In parallel, decarbonization pressures elevate aluminum versus steel, whose mills face rising carbon fees.
Steel remains essential where physical robustness overrides weight penalties-chiefly in canned meats and heat-processed meals. Yet continuing decarbonization costs are eroding its long-term price competitiveness. Producers respond by alloying tinplate with chromium to trim gauge, but substitution risk persists. For investors, the metal cans market reflects a clear material bifurcation: aluminum for growth, steel for stability.
Two-piece cans preserved 54.06% share in 2025 thanks to efficient drawn-and-ironed lines that churn out billions of beverage units annually. These formats balance weight, cost, and stacking strength, underscoring their role as the backbone of the metal cans market size. On the innovation front, monobloc aerosol designs are expanding at a 4.78% CAGR, helped by personal-care brands seeking seamless shapes and advanced valves.
Impact-extruded monoblocs enable refillable cartridge systems and ultralight shells, unlocking eco-premium price points in deodorants and hair mists. Three-piece welded cans, while aging, sustain niche demand in large-volume foodservice and specialty products where customized diameters or necked ends matter more than weight. Overall, structural variety equips converters to serve diverse product viscosities, filling pressures, and shelf-life requirements.
Complete Report Scope:
- By Material Type
- Aluminium
- Steel
- By Can Structure
- Two-Piece
- Three-Piece
- Monobloc Aerosol
- By Capacity / Size
- <=250 ml
- 250-500 ml
- 500-1,000 ml
- >1,000 ml
- By Manufacturing Process
- Drawn and Ironed (D&I)
- Drawn and Redrawn (DRD)
- Impact Extrusion
- By End-User Industry
- Food
- Beverage
- Personal Care and Cosmetics
- Pharmaceuticals
- Paints and Industrial Chemicals
- Automotive Fluids and Lubricants
- Other End-User Industry
- By Geography
- North America
- United States
- Canada
- Mexico
- South America
- Brazil
- Argentina
- Chile
- Rest of South America
- Europe
- United Kingdom
- Germany
- France
- Spain
- Italy
- Rest of Europe
- Asia-Pacific
- China
- India
- Japan
- Australia
- South Korea
- Vietnam
- Rest of Asia-Pacific
- Middle East and Africa
- Middle East
- Saudi Arabia
- United Arab Emirates
- Turkey
- Rest of Middle East
- Africa
- South Africa
- Nigeria
- Egypt
- Rest of Africa
- Middle East
- North America
Geography Analysis
North America led the global metal cans market with 39.72% revenue share in 2025. Mature soft-drink consumption, highly efficient curbside collection, and EPR statutes underpin stable can demand. Regional aluminum recycling rates hover near 75%, ensuring supply security while muting virgin-metal exposure. Recent announcements exceeding USD 200 million for new capacity in the United States and Mexico signal long-term confidence in steady, if incremental, growth.
Asia-Pacific is projected to log a 5.88% CAGR to 2031, the fastest worldwide. Urban migration, rising middle-class incomes, and surging RTD innovations keep can volumes expanding. Japan's deposit-scheme framework recovered 93% of aluminum cans in 2024, setting a circular-economy benchmark for neighbors. China's move from import dependence to regional export hub illustrates the strategic shift toward indigenous manufacturing and broader influence over global supply networks.
Europe balances opportunity and complexity. Stringent BPA rules force costly liner shifts, yet the same regulations elevate cans' sustainability credentials and accelerate steel-to-aluminum substitution. The Green Deal's circularity targets amplify recycling premiums, ultimately supporting the metal cans market despite short-term compliance drag. South America and the Middle East and Africa represent frontier demand where infrastructure gaps and price sensitivity slow adoption, but gradual EPR frameworks and digitization could lift can penetration over the forecast horizon.
- Ball Corporation
- Crown Holdings Inc.
- Ardagh Group S.A.
- Silgan Holdings Inc.
- CAN-PACK S.A.
- Toyo Seikan Group Holdings Ltd.
- CPMC Holdings Ltd.
- Showa Denko K.K.
- Mauser Packaging Solutions LLC
- DS Containers Inc.
- CCL Container Inc.
- Independent Can Company
- Hindustan Tin Works Ltd.
- Saudi Arabian Packaging Industry Co. (SAPIN)
- Kian Joo Can Factory Berhad
- Colep Packaging S.A.
- Can-One Berhad
- Greif Metal Packaging Division
- Massilly Holding SAS
- Universal Can Corp.
- Pacific Can China Holdings Ltd.
Additional Benefits:
- The market estimate (ME) sheet in Excel format
- 3 months of analyst support
TABLE OF CONTENTS
1 INTRODUCTION
- 1.1 Study Assumptions and Market Definition
- 1.2 Scope of the Study
2 RESEARCH METHODOLOGY
3 EXECUTIVE SUMMARY
4 MARKET LANDSCAPE
- 4.1 Market Overview
- 4.2 Industry Value Chain Analysis
- 4.3 Porter's Five Forces Analysis
- 4.3.1 Bargaining Power of Suppliers
- 4.3.2 Bargaining Power of Buyers/Consumers
- 4.3.3 Threat of New Entrants
- 4.3.4 Threat of Substitute Products
- 4.3.5 Intensity of Competitive Rivalry
- 4.4 Impact of Macroeconomic Factors on the Market
- 4.5 Market Drivers
- 4.5.1 Aluminum price volatility accelerates lightweighting adoption
- 4.5.2 Global DRS programs expanding refill-deposit loops
- 4.5.3 Growth in RTD beverage launches
- 4.5.4 Food-waste reduction initiatives driving shelf-stable formats
- 4.5.5 Craft aerosol packaging for personal-care "at-home spa" trend†
- 4.5.6 Smart-printing (QR/NFC) enabling supply-chain traceability
- 4.6 Market Restraints
- 4.6.1 PET and flexibles cost advantage in emerging markets
- 4.6.2 EU BPA-migration limits on epoxy liners
- 4.6.3 Steel mill decarbonisation costs inflating input prices†
- 4.6.4 E-commerce shift to "ship-in-own-container" formats
5 MARKET SIZE AND GROWTH FORECASTS
- 5.1 By Material Type
- 5.1.1 Aluminium
- 5.1.2 Steel
- 5.2 By Can Structure
- 5.2.1 Two-Piece
- 5.2.2 Three-Piece
- 5.2.3 Monobloc Aerosol
- 5.3 By Capacity / Size
- 5.3.1 <=250 ml
- 5.3.2 250-500 ml
- 5.3.3 500-1,000 ml
- 5.3.4 >1,000 ml
- 5.4 By Manufacturing Process
- 5.4.1 Drawn and Ironed (D&I)
- 5.4.2 Drawn and Redrawn (DRD)
- 5.4.3 Impact Extrusion
- 5.5 By End-User Industry
- 5.5.1 Food
- 5.5.2 Beverage
- 5.5.3 Personal Care and Cosmetics
- 5.5.4 Pharmaceuticals
- 5.5.5 Paints and Industrial Chemicals
- 5.5.6 Automotive Fluids and Lubricants
- 5.5.7 Other End-User Industry
- 5.6 By Geography
- 5.6.1 North America
- 5.6.1.1 United States
- 5.6.1.2 Canada
- 5.6.1.3 Mexico
- 5.6.2 South America
- 5.6.2.1 Brazil
- 5.6.2.2 Argentina
- 5.6.2.3 Chile
- 5.6.2.4 Rest of South America
- 5.6.3 Europe
- 5.6.3.1 United Kingdom
- 5.6.3.2 Germany
- 5.6.3.3 France
- 5.6.3.4 Spain
- 5.6.3.5 Italy
- 5.6.3.6 Rest of Europe
- 5.6.4 Asia-Pacific
- 5.6.4.1 China
- 5.6.4.2 India
- 5.6.4.3 Japan
- 5.6.4.4 Australia
- 5.6.4.5 South Korea
- 5.6.4.6 Vietnam
- 5.6.4.7 Rest of Asia-Pacific
- 5.6.5 Middle East and Africa
- 5.6.5.1 Middle East
- 5.6.5.1.1 Saudi Arabia
- 5.6.5.1.2 United Arab Emirates
- 5.6.5.1.3 Turkey
- 5.6.5.1.4 Rest of Middle East
- 5.6.5.2 Africa
- 5.6.5.2.1 South Africa
- 5.6.5.2.2 Nigeria
- 5.6.5.2.3 Egypt
- 5.6.5.2.4 Rest of Africa
- 5.6.5.1 Middle East
- 5.6.1 North America
6 COMPETITIVE LANDSCAPE
- 6.1 Market Concentration
- 6.2 Strategic Moves
- 6.3 Market Share Analysis
- 6.4 Company Profiles (includes Global Level Overview, Market Level Overview, Core Segments, Financials as available, Strategic Information, Market Rank/Share, Products and Services, Recent Developments)
- 6.4.1 Ball Corporation
- 6.4.2 Crown Holdings Inc.
- 6.4.3 Ardagh Group S.A.
- 6.4.4 Silgan Holdings Inc.
- 6.4.5 CAN-PACK S.A.
- 6.4.6 Toyo Seikan Group Holdings Ltd.
- 6.4.7 CPMC Holdings Ltd.
- 6.4.8 Showa Denko K.K.
- 6.4.9 Mauser Packaging Solutions LLC
- 6.4.10 DS Containers Inc.
- 6.4.11 CCL Container Inc.
- 6.4.12 Independent Can Company
- 6.4.13 Hindustan Tin Works Ltd.
- 6.4.14 Saudi Arabian Packaging Industry Co. (SAPIN)
- 6.4.15 Kian Joo Can Factory Berhad
- 6.4.16 Colep Packaging S.A.
- 6.4.17 Can-One Berhad
- 6.4.18 Greif Metal Packaging Division
- 6.4.19 Massilly Holding SAS
- 6.4.20 Universal Can Corp.
- 6.4.21 Pacific Can China Holdings Ltd.
7 MARKET OPPORTUNITIES AND FUTURE OUTLOOK
- 7.1 White-space and Unmet-Need Assessment

 印度金屬罐市場:市場佔有率分析、產業趨勢與統計、成長預測(2026-2031)歐洲金屬罐:市場佔有率分析、產業趨勢與統計、成長預測(2026-2031)中東和非洲金屬罐市場:市場佔有率分析、行業趨勢和統計數據以及成長預測(2026-2031 年)
 金屬罐和玻璃瓶市場:2026-2032年全球市場預測(按包裝類型、材料、蓋子類型、容量、最終用戶和分銷管道分類)
 金屬罐市場報告:趨勢、預測及競爭分析(至2035年)
 金屬罐市場規模、佔有率、趨勢和預測:按材料類型、製造方法、罐型和地區分類,2026-2034年金屬罐、桶、鼓和桶市場:依材質、產品類型、容量、終端用戶產業和銷售管道分類-2026-2032年全球市場預測北美金屬罐市場:市場佔有率分析、產業趨勢與統計及成長預測(2026-2031 年)
 金屬罐市場規模、佔有率和趨勢分析報告:按材料、產品、蓋類型、應用、地區和細分市場預測(2026-2033 年)美國金屬罐:市場佔有率分析、產業趨勢與統計、成長預測(2026-2031)