


 |
市場調查報告書
商品編碼
2119066
IT硬體訂閱(DaaS - 設備即服務):市場佔有率分析、產業趨勢與統計、成長預測(2026-2031年)IT Hardware Subscription and Device-as-a-Service (DaaS) - Market Share Analysis, Industry Trends & Statistics, Growth Forecasts (2026 - 2031) |
||||||

※ 本網頁內容可能與最新版本有所差異。詳細情況請與我們聯繫。
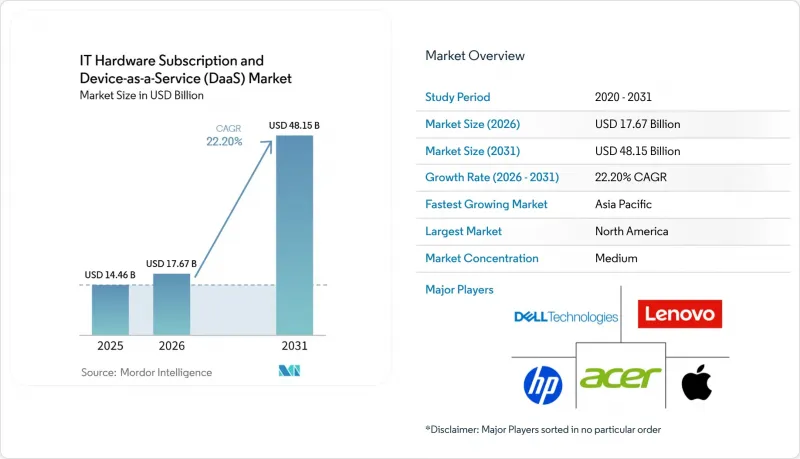
據 Mordor Intelligence 稱,IT 硬體訂閱/DaaS(設備即服務)市場預計將從 2025 年的 144.6 億美元成長到 2026 年的 176.7 億美元,到 2031 年達到 481.5 億美元,預計 2026 年至 2031 年的複合年成長率為 2.2%。
本報告按設備類型(筆記型電腦、桌上型工作站等)、服務類型(僅硬體訂閱、硬體+軟體支援等)、最終用戶產業(IT和電信、醫療保健等)、組織規模(大型企業等)和地區進行細分。市場預測以美元計價。
全球IT硬體訂閱與DaaS(設備即服務)市場趨勢與洞察
混合辦公模式的採用率正在迅速提高。
混合辦公模式正從臨時解決方案轉變為標準工作方式,預計到2025年,96%的組織將實施分散式辦公策略。目前,超過一半的美國知識工作者每周至少遠距辦公一次,這持續推動了對快速設備交付、鏡像和檢索的需求成長。設備即服務 (DaaS) 平台可自動執行這些工作流程,將平均上線時間從幾天縮短為幾小時。 Gartner 預測,到2028年,託管裝置生命週期管理模式的採用率將達到70%,凸顯了此模式的日益普及。堅持資本所有權模式的公司將面臨不斷上漲的IT人事費用和更長的響應時間,在無縫遠端辦公技術已成為常態的時代,這使其在吸引人才方面處於劣勢。
傾向於採用基於營運支出(OPEX)的IT預算
由於宏觀經濟環境波動,財務主管越來越傾向於可預測的每月支出。 2026 年第一季的一項調查顯示,68% 的財務長預計 IT 成本將上升,但他們不願意批准大額資本支出。訂閱協議將不定期採購轉化為穩定的支出,縮短核准週期,並提高現金流的可見度。Capgemini SA顧問公司的研究表明,按需技術在整體 IT 預算中的佔比預計將從 2025 年的 29% 上升到 2027 年的 41%。中小企業將從中受益最多,因為它們可以更頻繁地更新硬體,而無需進行季度資本支出審查,同時也避免信貸限制。
對數據主權的擔憂
印度的《數位個人資料保護法》和歐盟的《一般資料保護規範》(GDPR) 等法律規定,某些用戶遙測和身分驗證資訊必須保存在境內。資料即服務 (DaaS) 供應商必須維護區域資料中心,這會增加成本並延緩部署進度。如果供應商無法提供可在所有司法管轄區無縫運作的統一平台,跨國公司將面臨嚴峻挑戰。這種整合不足往往會導致管理系統碎片化,從而造成效率低下和營運複雜化。此外,高度監管市場中更嚴格的合規要求也會增加管理成本。
細分市場分析
預計到2025年,筆記型電腦市佔率將佔總銷售額的41.8%,凸顯其在IT硬體訂閱和DaaS(設備即服務)市場中作為生產力基礎的關鍵作用。同時,智慧型手機和手持終端機預計到2031年將以24.8%的複合年成長率成長,這反映了5G在物流和零售業的現場應用不斷擴展,以及堅固耐用型設備的日益普及。隨著企業尋求透過單一主機管理的整合式行動解決方案,配備掃描器和RFID讀取器的堅固耐用型手持終端機正在取代傳統的PDA。平板電腦在教育機構和醫院的臨床工作流程中仍然有需求,但其與企業軟體的兼容性有限,阻礙了其更廣泛的應用。桌上型電腦和工作站繼續在工程、設計和交易場所使用,因為這些場所對高運算密度和多顯示器配置的需求仍然至關重要。
雖然周邊設備和配件在IT硬體訂閱/DaaS(設備即服務)市場中所佔佔有率較小,但現在它們已與大多數合約捆綁在一起。惠普計劃在2025年擴大翻新周邊設備的供應範圍,顯示企業正在採用翻新顯示器和擴充座來實現其永續發展目標。不同行業的設備偏好各不相同:開發人員偏好高階筆記型電腦,醫療產業優先考慮抗菌片劑,而零售業則力求使用堅固耐用的智慧型手機。隨著買家不斷調整配置以滿足新工作流程的需求,那些允許中期更換並支援混合環境設備組合的供應商將迎來快速成長。
涵蓋整個生命週期的管理服務預計到2025年將佔總營收的37.2%,複合年成長率(CAGR)為25.6%,是整個IT硬體訂閱/DaaS(設備即服務)市場中成長最快的領域。包含採購、部署、監控、維修、翻新和認證處置的合約建立了單一供應商責任制。根據Forrester 2026年的一項研究,為期三年的合約預計每台設備可節省高達1000歐元(1130美元)的成本,並減少6.5小時的IT人事費用。僅硬體訂閱仍受到自行管理內部鏡像和安全營運的政府機構的青睞。包含作業系統授權和終端安全服務的混合方案則更受需要承包支援的中小型企業的青睞。
隨著環境、社會和管治(ESG) 資訊揭露的日益增多,買家的興趣正轉向聯想 TruScale DaaS for Sustainability 等服務,該服務整合了二氧化碳追蹤儀錶板和碳抵消功能。如今,結合硬體和託管服務的方案還包括人工智慧驅動的分析功能,可以預測組件故障,從而進一步減少停機時間。服務選擇正成為衡量 IT 成熟度的指標。早期採用者選擇外包整個生命週期,而較成熟的公司則會精心挑選並採用與自身內部技能互補的各個模組。
區域分析
2025年,北美在IT硬體訂閱/DaaS(設備即服務)市場總收入中佔34.7%。美國企業,尤其是科技、金融和醫療保健行業的企業,主導了大規模採用,以支援混合辦公模式並滿足嚴格的合規要求。 2026年的一項調查顯示,58%的美國知識工作者每周至少有一天會遠距辦公,這將持續推動對高效設備配置的需求。加拿大緊隨其後,教育和公共部門正在採用靈活的季節性設備解決方案。區域服務供應商透過提供人工智慧驅動的支援系統來脫穎而出,這些系統能夠預測硬體故障並自動購買替換零件,這反映了市場的成熟度和競爭格局。
在歐洲,有關「維修權」、循環經濟承諾以及雄心勃勃的碳減排目標的法規正在推動市場成長。德國、英國和法國等主要市場引領著這一趨勢,它們通常要求使用碳中和硬體並提供詳細的監管鏈文件。聯想的碳排放追蹤入口網站在該地區越來越受歡迎,但遵守GDPR(一般資料保護規則)需要在地化的資料中心,這增加了供應商的營運成本。同時,在俄羅斯,限制西方硬體進口的製裁造成了嚴重的限制,導致市場需求轉向那些設備即服務(DaaS)能力相對落後的本土製造商。
亞太地區正崛起為成長最快的市場,預計到2031年,IT硬體訂閱和DaaS(設備即服務)領域的複合年成長率將達到24.2%。儘管中國傾向於選擇本土供應商,這給外國公司帶來了挑戰,但對數位政府措施的大量投資正在擴大整體市場機會。在印度,資料保護法的推出使跨境資料流動變得更加複雜,但同時也使符合本地託管要求的本地供應商受益。日本和韓國正在利用先進的5G基礎設施,透過訂閱模式為對延遲敏感的邊緣工作負載提供支援。在南美洲,巴西引領市場,但外匯波動帶來了定價挑戰。同時,在中東,沙烏地阿拉伯和阿拉伯聯合大公國的智慧城市專案正在推動對高價值多設備合約的需求。雖然非洲仍處於早期階段,但肯亞和奈及利亞等國以智慧型手機為中心的訂閱模式凸顯了潛在的成長機遇,因為行動寬頻基礎設施正在不斷擴展。
其他好處:
- Excel格式的市場預測(ME)表
- 3個月的分析師支持
目錄
第1章:引言
- 市場分析與定義的前提條件
- 分析範圍
第2章 分析方法
第3章執行摘要
第4章 市場狀況
- 市場概覽
- 市場促進因素
- 企業採用混合辦公模式的現象正快速增加。
- 在IT預算中,營運支出(OPEX)比資本支出(CAPEX)越來越受到青睞。
- 安全性和合規性要求驅動的設備快速更新周期
- 5G邊緣設備的擴展需要靈活的資金籌措模式。
- 將人工智慧驅動的預測性維護整合到設備管理中
- 提供一系列碳中和硬體訂閱服務。
- 市場限制因素
- 跨境設備管理中的資料主權問題
- 大型企業對供應商鎖定問題的擔憂
- 通貨膨脹導致硬體成本波動,進而影響訂閱價格。
- 新興經濟體中合作夥伴生態系統有限
- 產業價值鏈分析
- 監理情勢
- 技術展望
- 宏觀經濟因素對市場的影響
- 波特五力分析
第5章:預測市場規模與成長率
- 依設備類型
- 筆記型電腦
- 桌面工作站
- 藥片
- 智慧型手機和手持終端機
- 周邊設備和配件
- 按服務類型
- 僅硬體訂閱
- 硬體和軟體支持
- 硬體 + 託管服務
- 全生命週期管理服務
- 按最終用戶行業分類
- IT/通訊
- 銀行、金融服務和保險業 (BFSI)
- 醫療保健
- 教育
- 政府/公共部門
- 零售與電子商務
- 製造業
- 其他終端用戶產業
- 按組織規模
- 大公司
- 小型企業
- 按地區
- 北美洲
- 美國
- 加拿大
- 墨西哥
- 南美洲
- 巴西
- 阿根廷
- 其他南美國家
- 歐洲
- 德國
- 英國
- 法國
- 俄羅斯
- 其他歐洲國家
- 亞太地區
- 中國
- 日本
- 印度
- 韓國
- 其他亞太國家
- 中東
- 沙烏地阿拉伯
- 阿拉伯聯合大公國
- 其他中東國家
- 非洲
- 南非
- 奈及利亞
- 其他非洲國家
- 北美洲
第6章 競爭情勢
- 市場集中度
- 策略趨勢
- 市佔率分析
- 公司簡介
- HP Inc.
- Dell Technologies Inc.
- Lenovo Group Limited
- Apple Inc.
- Acer Inc.
- ASUSTeK Computer Inc.
- Samsung Electronics Co., Ltd.
- Microsoft Corporation
- Fujitsu Limited
- Panasonic Holdings Corporation
- Dynabook Inc.
- Toshiba Corporation
- LG Electronics Inc.
- Huawei Technologies Co., Ltd.
- Xiaomi Corporation
- Getac Technology Corporation
- Compal Electronics, Inc.
- Wistron Corporation
- Inventec Corporation
- Pegatron Corporation
第7章 市場機會與未來展望
According to Mordor Intelligence, the IT hardware subscription and device-as-a-service market size is expected to increase from USD 14.46 billion in 2025 to USD 17.67 billion in 2026 and reach USD 48.15 billion by 2031, growing at a CAGR of 22.2% over 2026-2031.
This report is Segmented by Device Type (Laptops and Notebooks Desktops and Workstations, and More), Service Type (Hardware-Only Subscription, Hardware Plus Software Support, and More), End-User Industry (IT and Telecom, Healthcare, and More), Organization Size (Large Enterprises, and More), and Geography. The Market Forecasts are Provided in Terms of Value (USD).
Global IT Hardware Subscription and Device-as-a-Service (DaaS) Market Trends and Insights
Surge in Hybrid Work Adoption
Hybrid work has shifted from contingency to norm, with 96% of organizations embedding distributed policies by 2025. More than half of the United States' knowledge workers now operate remotely at least once per week, driving persistent demand for rapid device shipping, imaging, and retrieval. Device-as-a-service platforms automate these workflows, reducing the average onboarding time from days to hours. Gartner projects managed device lifecycle penetration will climb to 70% by 2028, underscoring how permanent the model has become. Firms that cling to capital-ownership models face rising IT labor overhead and longer response times, handicapping talent attraction in an era where seamless remote technology is the baseline.
Preference for OPEX-Based IT Budgets
Volatile macro conditions have prompted finance chiefs to favor predictable monthly outlays. A Q1 2026 survey showed 68% of CFOs expect IT costs to rise, but are reluctant to approve large capital allotments. Subscription contracts convert lumpy purchases into smooth expenses, quickening approval cycles and improving cash flow visibility. Capgemini research indicates that on-demand technology's share of total IT budgets should climb from 29% in 2025 to 41% by 2027. Smaller firms benefit most, sidestepping credit constraints while refreshing hardware more frequently without multi-quarter capital reviews.
Data Sovereignty Concerns
Laws such as India's Digital Personal Data Protection Act and the European Union's GDPR mandate that certain user telemetry and credentials remain inside national borders.DaaS vendors must maintain regional data centers, which increases costs and delays rollout schedules. Multinational corporations face significant challenges when providers fail to deliver unified platforms that operate seamlessly across all jurisdictions. This lack of integration often results in fragmented management systems, leading to inefficiencies and operational complexities. Additionally, the increased compliance requirements in heavily regulated markets contribute to higher administrative costs.
Other drivers and restraints analyzed in the detailed report include:
- Security-Driven Rapid Refresh Cycles
- Expansion of 5G-Edge Devices
- Vendor Lock-In Anxiety
For complete list of drivers and restraints, kindly check the Table Of Contents.
Segment Analysis
The laptops cohort accounted for 41.8% of 2025 revenue, underscoring its role as the default productivity anchor in the IT hardware subscription and device-as-a-service market. However, smartphones and handhelds are expected to post a 24.8% CAGR to 2031, reflecting expanding 5G field applications and ruggedized use cases in logistics and retail. Rugged handhelds equipped with scanners and RFID readers are displacing legacy PDAs as enterprises seek unified mobility stacks managed through a single console. Tablets maintain traction in education and bedside clinical workflows, though limited enterprise software compatibility curbs broader uptake. Desktops and workstations persist in engineering, design, and trading floors where high compute density and multi-monitor arrays remain essential.
Peripherals and accessories, while a smaller slice of the IT hardware subscription and device-as-a-service market, are now bundled into most contracts. HP's 2025 refurbished-peripheral expansion shows enterprises will accept remanufactured monitors and docks to hit sustainability targets.Device preferences are fragmenting along vertical lines. Developers favor high-end laptops, healthcare leans on antimicrobial tablets, and retail pushes rugged smartphones. Providers that allow mid-term swaps and support mixed fleets will capture disproportionate growth as buyers fine-tune configurations to emerging workflow demands.
Full lifecycle management services represented 37.2% of 2025 revenue and are on pace for a 25.6% CAGR, the fastest within the IT hardware subscription and device-as-a-service market size. Contracts covering procurement, deployment, monitoring, repair, refresh, and certified disposal deliver single-vendor accountability. A 2026 Forrester study quantified savings at up to EUR 1,000 (USD 1,130) per device plus 6.5 hours of IT labor across a three-year term. Hardware-only subscriptions remain popular in government contexts where agencies keep imaging and security tasks in-house. Hybrid bundles that include operating system licenses and endpoint security resonate with SMEs needing turnkey support.
Environmental, social, and governance disclosure is steering buyers toward offerings such as Lenovo's TruScale DaaS for Sustainability, which embeds CO2 tracking dashboards and carbon offsets. Hardware plus managed service tiers now package AI-driven analytics that forecast component failures, further reducing downtime. Service selection is becoming a proxy for IT maturity. Early adopters delegate the end-to-end lifecycle, whereas sophisticated enterprises cherry-pick discrete modules that complement internal skill sets.
Complete Report Scope:
- By Device Type
- Laptops and Notebooks
- Desktops and Workstations
- Tablets
- Smartphones and Handhelds
- Peripherals and Accessories
- By Service Type
- Hardware-Only Subscription
- Hardware plus Software Support
- Hardware plus Managed Services
- Full Lifecycle Management Services
- By End User Industry
- IT and Telecom
- Banking, Financial Services and Insurance
- Healthcare
- Education
- Government and Public Sector
- Retail and E-Commerce
- Manufacturing
- Rest of End User Industries
- By Organization Size
- Large Enterprises
- Small and Medium Enterprises
- By Geography
- North America
- United States
- Canada
- Mexico
- South America
- Brazil
- Argentina
- Rest of South America
- Europe
- Germany
- United Kingdom
- France
- Russia
- Rest of Europe
- Asia-Pacific
- China
- Japan
- India
- South Korea
- Rest of Asia-Pacific
- Middle East
- Saudi Arabia
- United Arab Emirates
- Rest of Middle East
- Africa
- South Africa
- Nigeria
- Rest of Africa
- North America
Geography Analysis
North America accounted for 34.7% of the total revenue in the IT hardware subscription and device-as-a-service market in 2025. Enterprises in the United States, particularly in the technology, finance, and healthcare sectors, spearheaded large-scale deployments to support hybrid work models and comply with stringent compliance requirements. A 2026 survey revealed that 58% of US knowledge workers worked remotely at least one day per week, driving sustained demand for efficient device provisioning. Similarly, Canada followed this trend, with the education and public sectors adopting flexible, seasonal fleet solutions. Regional service providers are increasingly differentiating themselves by offering AI-driven support systems that predict hardware failures and automatically dispatch replacement parts, reflecting a maturing and competitive market landscape.
In Europe, market growth is driven by right-to-repair regulations, circular economy initiatives, and ambitious carbon-reduction goals. Key markets such as Germany, the United Kingdom, and France are leading adoption, often requiring carbon-neutral hardware and detailed chain-of-custody documentation. Lenovo's carbon-tracking portal has gained traction in the region, while GDPR compliance necessitates localized data centers, increasing operational costs for vendors. Meanwhile, Russia faces significant constraints due to sanctions limiting access to Western hardware imports, redirecting demand to domestic manufacturers with less advanced device-as-a-service capabilities.
The Asia-Pacific region is emerging as the fastest-growing market, projected to achieve a 24.2% CAGR through 2031 in the IT hardware subscription and device-as-a-service segment. China's preference for domestic suppliers poses challenges for foreign companies, although substantial investments in digital government initiatives are expanding the overall market opportunity. In India, the introduction of data-protection laws complicates cross-border data flows but simultaneously benefits regional providers that comply with local hosting requirements. Japan and South Korea are leveraging their advanced 5G infrastructure to support latency-sensitive edge workloads, financed through subscription-based models. In South America, Brazil leads the market, although currency fluctuations present pricing challenges. Meanwhile, in the Middle East, smart-city projects in Saudi Arabia and the United Arab Emirates are driving demand for high-value, multi-device contracts. Africa remains in the early stages of adoption, but smartphone-centric subscription models in countries like Kenya and Nigeria highlight potential growth opportunities as mobile broadband infrastructure continues to expand.
- HP Inc.
- Dell Technologies Inc.
- Lenovo Group Limited
- Apple Inc.
- Acer Inc.
- ASUSTeK Computer Inc.
- Samsung Electronics Co., Ltd.
- Microsoft Corporation
- Fujitsu Limited
- Panasonic Holdings Corporation
- Dynabook Inc.
- Toshiba Corporation
- LG Electronics Inc.
- Huawei Technologies Co., Ltd.
- Xiaomi Corporation
- Getac Technology Corporation
- Compal Electronics, Inc.
- Wistron Corporation
- Inventec Corporation
- Pegatron Corporation
Additional Benefits:
- The market estimate (ME) sheet in Excel format
- 3 months of analyst support
TABLE OF CONTENTS
1 INTRODUCTION
- 1.1 Study Assumptions and Market Definition
- 1.2 Scope of the Study
2 RESEARCH METHODOLOGY
3 EXECUTIVE SUMMARY
4 MARKET LANDSCAPE
- 4.1 Market Overview
- 4.2 Market Drivers
- 4.2.1 Surge in Hybrid Work Adoption among Enterprises
- 4.2.2 Rising Preference for OPEX over CAPEX in IT Budgeting
- 4.2.3 Rapid Device Refresh Cycles due to Security and Compliance Needs
- 4.2.4 Expansion of 5G-Enabled Edge Devices Requiring Flexible Financing Models
- 4.2.5 Integration of AI-Driven Predictive Maintenance in Device Management
- 4.2.6 Bundling of Carbon-Neutral Hardware Subscription Offerings
- 4.3 Market Restraints
- 4.3.1 Data Sovereignty Concerns in Cross-Border Device Management
- 4.3.2 Vendor Lock-In Fears among Large Enterprises
- 4.3.3 Inflation-Driven Hardware Cost Volatility Affecting Subscription Pricing
- 4.3.4 Limited Partner Ecosystems in Emerging Economies
- 4.4 Industry Value Chain Analysis
- 4.5 Regulatory Landscape
- 4.6 Technological Outlook
- 4.7 Impact of Macroeconomic Factors on the Market
- 4.8 Porter's Five Forces Analysis
- 4.8.1 Threat of New Entrants
- 4.8.2 Bargaining Power of Suppliers
- 4.8.3 Bargaining Power of Buyers
- 4.8.4 Threat of Substitutes
- 4.8.5 Competitive Rivalry
5 MARKET SIZE AND GROWTH FORECASTS (VALUE)
- 5.1 By Device Type
- 5.1.1 Laptops and Notebooks
- 5.1.2 Desktops and Workstations
- 5.1.3 Tablets
- 5.1.4 Smartphones and Handhelds
- 5.1.5 Peripherals and Accessories
- 5.2 By Service Type
- 5.2.1 Hardware-Only Subscription
- 5.2.2 Hardware plus Software Support
- 5.2.3 Hardware plus Managed Services
- 5.2.4 Full Lifecycle Management Services
- 5.3 By End User Industry
- 5.3.1 IT and Telecom
- 5.3.2 Banking, Financial Services and Insurance
- 5.3.3 Healthcare
- 5.3.4 Education
- 5.3.5 Government and Public Sector
- 5.3.6 Retail and E-Commerce
- 5.3.7 Manufacturing
- 5.3.8 Rest of End User Industries
- 5.4 By Organization Size
- 5.4.1 Large Enterprises
- 5.4.2 Small and Medium Enterprises
- 5.5 By Geography
- 5.5.1 North America
- 5.5.1.1 United States
- 5.5.1.2 Canada
- 5.5.1.3 Mexico
- 5.5.2 South America
- 5.5.2.1 Brazil
- 5.5.2.2 Argentina
- 5.5.2.3 Rest of South America
- 5.5.3 Europe
- 5.5.3.1 Germany
- 5.5.3.2 United Kingdom
- 5.5.3.3 France
- 5.5.3.4 Russia
- 5.5.3.5 Rest of Europe
- 5.5.4 Asia-Pacific
- 5.5.4.1 China
- 5.5.4.2 Japan
- 5.5.4.3 India
- 5.5.4.4 South Korea
- 5.5.4.5 Rest of Asia-Pacific
- 5.5.5 Middle East
- 5.5.5.1 Saudi Arabia
- 5.5.5.2 United Arab Emirates
- 5.5.5.3 Rest of Middle East
- 5.5.6 Africa
- 5.5.6.1 South Africa
- 5.5.6.2 Nigeria
- 5.5.6.3 Rest of Africa
- 5.5.1 North America
6 COMPETITIVE LANDSCAPE
- 6.1 Market Concentration
- 6.2 Strategic Moves
- 6.3 Market Share Analysis
- 6.4 Company Profiles (includes Global level Overview, Market level overview, Core Segments, Financials as available, Strategic Information, Market Rank/Share for key companies, Products and Services, and Recent Developments)
- 6.4.1 HP Inc.
- 6.4.2 Dell Technologies Inc.
- 6.4.3 Lenovo Group Limited
- 6.4.4 Apple Inc.
- 6.4.5 Acer Inc.
- 6.4.6 ASUSTeK Computer Inc.
- 6.4.7 Samsung Electronics Co., Ltd.
- 6.4.8 Microsoft Corporation
- 6.4.9 Fujitsu Limited
- 6.4.10 Panasonic Holdings Corporation
- 6.4.11 Dynabook Inc.
- 6.4.12 Toshiba Corporation
- 6.4.13 LG Electronics Inc.
- 6.4.14 Huawei Technologies Co., Ltd.
- 6.4.15 Xiaomi Corporation
- 6.4.16 Getac Technology Corporation
- 6.4.17 Compal Electronics, Inc.
- 6.4.18 Wistron Corporation
- 6.4.19 Inventec Corporation
- 6.4.20 Pegatron Corporation
7 MARKET OPPORTUNITIES AND FUTURE OUTLOOK
- 7.1 White-Space and Unmet-Need Assessment

 印度IT硬體市場:市場佔有率分析、產業趨勢與統計及成長預測(2026-2031年)永續IT硬體:市場佔有率分析、產業趨勢與統計及成長預測(2026-2031年)IT硬體更新周期最佳化軟體:市場佔有率分析、產業趨勢與統計、成長預測(2026-2031年)IT設備分銷:市場佔有率分析、產業趨勢與統計、成長預測(2026-2031年)
 2026年全球可解釋人工智慧儀表板顯示市場報告2026年全球硬體儲存市場報告
 全球硬檢驗市場全球硬體儲存市場
 硬體儲存市場規模、佔有率、成長分析,按硬體儲存解決方案類型、儲存容量、使用環境、地區 - 產業預測,2025-2032