


 |
市場調查報告書
商品編碼
2073002
IT硬體更新周期最佳化軟體:市場佔有率分析、產業趨勢與統計、成長預測(2026-2031年)IT Hardware Refresh Cycle Optimization Software - Market Share Analysis, Industry Trends & Statistics, Growth Forecasts (2026 - 2031) |
||||||

※ 本網頁內容可能與最新版本有所差異。詳細情況請與我們聯繫。
根據 Mordor Intelligence 預測,IT 硬體更新週期最佳化軟體市場規模將從 2025 年的 12.4 億美元和 2026 年的 14.3 億美元成長到 2031 年的 31.8 億美元,2026 年至 2031 年的年複合成長率(CAGR)%為 17.33%。
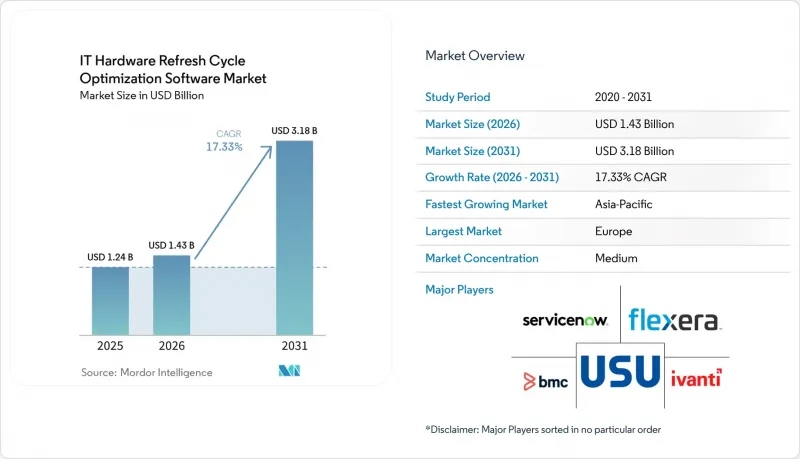
本報告按部署模式(雲端、本地部署、混合部署)、企業規模(大型企業、中小企業)、應用領域(硬體生命週期分析和資產效能管理等)、最終用戶(IT與電信、銀行、金融服務和保險、工業製造等)以及地區進行細分。市場預測以美元計價。
全球IT硬體更新周期最佳化軟體市場趨勢與洞察
企業硬體升級的積壓訂單越來越多。
由於硬體支出從2022年延後到2024年,許多公司擁有比以往更多接近使用壽命末期的設備,為IT硬體更新周期最佳化軟體市場帶來了持續的需求。問題不僅僅在於設備過時。更換的延遲導致資產管理記錄不明朗,IT團隊難以確定哪些設備仍在運作中、可維修或已準備好重新部署。在IT硬體更新周期最佳化軟體市場,這種情況促使人們對能夠整理發現資料、對設備狀態進行分類並根據更清晰的規則確定更換時機的軟體產生了濃厚的興趣。因此,市場正在從偶爾的更換項目轉向持續的生命週期管理,這使得供應商有空間銷售更廣泛的平台,而不是功能有限的工具。這一趨勢意味著IT硬體更新周期最佳化軟體市場與營運規格以及硬體需求密切相關。
Windows 和終端作業系統停止支援的浪潮
微軟於2025年10月14日停止了對Windows 10的支持,這促使許多組織以更系統化的方式審查其大規模終端資產。作業系統停止支援的截止日期對IT硬體更新周期最佳化軟體市場至關重要,因為企業必須確定哪些裝置可以遷移到Windows 11,哪些裝置需要更換。這個審核過程經常發現序號缺失、記錄過時和未管理的設備,從而提升了資產發現、生命週期評估和更換計劃功能在IT硬體更新周期最佳化軟體市場中的價值。微軟也開始提供付費的“擴展安全更新”,使用戶能夠輕鬆比較延遲更新的成本與更新規劃工具和設備升級的成本。隨著對Microsoft Office 2021和LTSC 2021的支援計畫於2026年10月結束,IT硬體更新週期最佳化軟體市場將繼續受益於即將到來的合規週期(該週期已經開始)。
ITSM、EAM 和採購系統整合的複雜性。
IT硬體更新周期最佳化軟體市場仍面臨許多挑戰。這些挑戰包括複雜的系統環境,這些環境融合了傳統的服務工具、採購模組和獨立的資產資料庫。 70%的組織認為與傳統IT服務管理(ITSM)系統的互通性是採用該軟體的主要障礙,凸顯了這個問題的普遍性。實際上,這意味著即使是那些尋求更佳更新計劃的買家,如果資產資訊、合約數據和服務記錄不一致,也可能被延誤。因此,能夠提供強大連接器並促進向混合環境平穩過渡的供應商在IT硬體更新周期最佳化軟體市場中具有顯著優勢。在實現此類連線變得更加便捷之前,部署所需的工作量可能會繼續拖延一些大型客戶的採購。
細分市場分析
到2025年,基於雲端的部署將佔總收入的65.74%,而這種模式在IT硬體更新周期最佳化軟體市場中繼續佔據核心地位。這種主導地位源自於其易於部署、初始基礎設施成本低,以及能夠從單一環境監控分散式員工的設備資產。在IT硬體更新周期最佳化軟體市場,當電子表格追蹤或獨立工具無法提供足夠的可見度時,基於雲端的交付方式幫助買家快速回應。對於需要擴展混合辦公模式並集中管理跨多個地點資產的組織而言,這一細分市場仍然特別重要。
預計到2031年,混合部署將以18.05%的複合年成長率成長,並且在傳統基礎設施仍發揮重要作用的環境中,混合部署有望成為普及速度最快的選擇。 ISO/IEC TS 19770-10:2025支援在混合環境中實施結構化的IT資產管理(ITAM),這與將雲端分析與本地發現和控制相結合的混合架構的吸引力相契合。許多大型採購商在尋求雲端規劃工具的同時,也希望保留一些本地發現和記錄系統,以滿足管理、安全或資料保留要求。因此,混合部署在「IT硬體更新周期最佳化軟體市場」中提供了一種切實可行的折衷方案,尤其是在完全遷移會造成不必要中斷的情況下。
到2025年,大型企業將佔據IT硬體更新周期最佳化軟體市場64.12%的佔有率,這反映了它們龐大的資產組合以及對跨區域管治的更高需求。這些採購公司通常擁有更成熟的服務管理環境,並且歷來都是生命週期最佳化軟體的早期採用者。在IT硬體更新周期最佳化軟體市場,大型客戶傾向於選擇能夠連接髮現、服務記錄和批准工作流程的整合平台。它們的規模意味著供應商需要支付更高的合約金額,同時也意味著它們對整合深度和流程契合度有著更高的期望。
預計到2031年,中小企業(SME)的複合年成長率將達到18.21%,這表明IT硬體更新周期最佳化軟體市場的進入門檻正在降低。 SaaS產品和簡化的上線流程使得小規模企業無需組建大規模的內部IT資產管理(ITAM)團隊即可輕鬆實施系統化的更新計劃。 Freshworks也在Freshservice中新增了嵌入式的發現和依賴關係映射功能,為小規模企業提供了他們最需要的更簡單、更全面的視覺性。因此,IT硬體更新周期最佳化軟體產業正在向那些先前依賴手動清單、本地電子表格或臨時更新決策的用戶敞開大門。
區域分析
到2025年,歐洲將佔據34.56%的市場佔有率,成為IT硬體更新周期最佳化軟體市場最大的地區。該地區的需求主要來自那些需要在受監管的營運環境中獲取資產、維修方案和處置流程等相關文件資訊的組織。歐盟的「維修權指令」要求成員國在2026年7月31日前將該指令納入本國法律,這進一步提升了硬體項目中「維修或更換」決策的重要性。將於2025年1月1日生效的《巴塞爾電子廢棄物公約》修正案將更加強調對報廢設備的受控處置以及跨境轉移的透明度。隨著硬體更新與IT硬體更新周期最佳化軟體市場中文件品質和完善的資產管理之間的聯繫日益緊密,這些政策因素共同促成了歐洲的領先地位。
北美仍然是IT硬體更新周期最佳化軟體市場的第二大區域,因為許多大型企業已經在該地區運行成熟的服務和資產管理程式。 Windows 10停止支援對大規模終端環境產生了顯著影響,使得系統化的庫存審查和更新計劃對許多買家而言變得更加緊迫。此外,該地區還聚集了許多主要平台供應商,他們向成熟的企業客戶銷售更廣泛的服務、安全和資產管理工作流程。這些因素共同作用,使得北美成為IT硬體更新周期最佳化軟體市場產品方向和收入基礎的關鍵驅動力。
預計到2031年,亞太地區將以18.34%的複合年成長率成長,成為IT硬體更新周期最佳化軟體市場成長最快的區域。這一成長主要得益於持續的數位轉型、資料中心擴張以及與製造業轉型和區域基礎設施發展計畫相關的企業新投資。隨著新型設備資產類別需要在其生命週期早期進行系統性追蹤,而非僅僅在資產管理變得困難之後才進行追蹤,亞太地區的IT硬體更新周期最佳化軟體市場正在蓬勃發展。雖然南美和中東及非洲地區仍處於起步階段,但跨國公司的營運標準正在推動部分國家的需求成長。隨著生命週期管治日趨規範化,對人工記錄的依賴性降低,預計這些地區的市場應用也將持續擴大。
其他好處:
- Excel格式的市場預測(ME)表
- 3個月的分析師支持
目錄
第1章:引言
- 研究假設和市場定義
- 調查範圍
第2章:調查方法
第3章執行摘要
第4章 市場狀況
- 市場概覽
- 市場促進因素
- 企業硬體升級請求待處理數量增加
- Windows 和終端作業系統停止支援的浪潮
- 從被動庫存管理向預測性生命週期最佳化轉型
- 因軟體和硬體不合規而面臨的審計壓力。
- 人工智慧驅動的故障預測和更換時機確定
- 與永續性相關的資產更新和電子廢棄物減量目標
- 市場限制因素
- ITSM、EAM 和採購系統整合的複雜性。
- 資產發現和使用記錄中的數據品質較差。
- 中型企業和公共部門採購負責人的預算延期
- 對政策主導更新決策的抵制
- 產業價值鏈分析
- 監理情勢
- 技術展望
- 波特五力分析
第5章 市場規模與成長預測
- 按部署模式
- 雲
- 現場
- 混合
- 按公司規模
- 大公司
- 小型企業
- 透過使用
- 硬體生命週期分析與資產效能管理
- 更新規劃和最佳化
- 最佳化採購、搬遷和重新分配
- 最佳化保固和支援協議
- 審計、合規和資產管治
- 最終用戶
- 資訊科技/通訊
- BFSI
- 工業製造
- 能源公用事業
- 石油和天然氣
- 零售與電子商務
- 建築和基礎設施
- 政府/公共部門
- 其他最終用戶
- 按地區
- 北美洲
- 美國
- 加拿大
- 墨西哥
- 南美洲
- 巴西
- 阿根廷
- 其他南美國家
- 歐洲
- 德國
- 英國
- 法國
- 義大利
- 西班牙
- 俄羅斯
- 其他歐洲國家
- 亞太地區
- 中國
- 印度
- 日本
- 韓國
- 澳洲
- 其他亞太國家
- 中東和非洲
- 中東
- 沙烏地阿拉伯
- 阿拉伯聯合大公國
- 土耳其
- 其他中東國家
- 非洲
- 南非
- 埃及
- 其他非洲國家
- 中東
- 北美洲
第6章 競爭情勢
- 市場集中度
- 策略趨勢
- 市佔率分析
- 公司簡介
- ServiceNow, Inc.
- Flexera Software LLC
- Ivanti, Inc.
- BMC Software, Inc.
- USU Software AG
- Snow Software AB
- Lansweeper NV
- Freshworks Inc.
- Zoho Corporation Private Limited
- Asset Panda LLC
- InvGate SRL
- SysAid Technologies Ltd.
- Matrix42 AG
- OpenText Corporation
- Axonius, Inc.
- 4me, Inc.
- TOPdesk Nederland BV
- Oomnitza, Inc.
- Aspera GmbH
- Streamline, Inc.
- Device42, Inc.
- Cherwell Software, LLC
第7章 市場機會與未來展望
According to Mordor Intelligence, the IT hardware refresh cycle optimization software market size is projected to expand from USD 1.24 billion in 2025 and USD 1.43 billion in 2026 to USD 3.18 billion by 2031, registering a CAGR of 17.33% between 2026 and 2031.
This report is Segmented by Deployment Model (Cloud, On-Premise, and Hybrid), Enterprise Size (Large Enterprises, and Small and Medium Enterprises), Application (Hardware Lifecycle Analytics and Asset Performance Management, and More), End User (IT and Telecom, BFSI, Industrial Manufacturing, and More), and Geography. The Market Forecasts are Provided in Terms of Value (USD).
Global IT Hardware Refresh Cycle Optimization Software Market Trends and Insights
Growth of Enterprise Hardware Refresh Backlogs
Deferred hardware spending from 2022 to 2024 left many enterprises with a larger-than-usual set of devices nearing the end of life, creating a durable demand pool for the IT Hardware Refresh Cycle Optimization Software Market. The issue is not only the age of devices; delayed replacements also weakened asset records and made it harder for IT teams to know what was still active, repairable, or ready for redeployment. In the IT Hardware Refresh Cycle Optimization Software Market, this has raised interest in software that can clean discovery data, classify device condition, and support replacement timing with clearer rules. The result is a shift away from occasional refresh projects toward continuous lifecycle oversight, which gives vendors more room to sell broader platforms rather than narrow tools. That pattern keeps the IT Hardware Refresh Cycle Optimization Software Market tied to operating discipline as much as to hardware demand.
Windows and Endpoint Operating System End-Of-Support Waves
Microsoft ended support for Windows 10 on October 14, 2025, prompting many organizations to review their large endpoint estates in a more structured way. In the IT Hardware Refresh Cycle Optimization Software Market, the operating system deadline mattered because it forced companies to identify devices that could move to Windows 11 and those that needed replacement. That audit process often uncovered missing serial numbers, stale records, and unmanaged devices, thereby increasing the value of discovery, lifecycle scoring, and replacement planning functions within the IT Hardware Refresh Cycle Optimization Software Market. Microsoft also set out a paid Extended Security Updates path, which made the cost of delaying change easier for buyers to compare against refresh planning tools and device upgrades. With Microsoft Office 2021 and LTSC 2021 support due to expire in October 2026, the IT Hardware Refresh Cycle Optimization Software Market continues to benefit from a follow-on compliance cycle already in motion.
Integration Complexity Across ITSM, EAM, and Procurement Stacks
The IT Hardware Refresh Cycle Optimization Software Market still faces a significant barrier: complex system environments that combine legacy service tools, procurement modules, and separate asset databases. Seventy percent of organizations cite interoperability with legacy ITSM systems as the main implementation barrier, underscoring how common this issue remains. In practice, that means even buyers who want better refresh planning may move slowly if discovery data, contract data, and service records do not align. The IT Hardware Refresh Cycle Optimization Software Market, therefore, favors vendors that can offer strong connectors and a cleaner path into mixed environments. Until those connections become easier to deploy, implementation effort will continue to slow some purchases in large accounts.
Other drivers and restraints analyzed in the detailed report include:
- Shift From Reactive Inventory to Predictive Lifecycle Optimization
- Audit Pressure From Software And Hardware Compliance Gaps
- Data Quality Gaps In Asset Discovery And Utilization Records
For complete list of drivers and restraints, kindly check the Table Of Contents.
Segment Analysis
Cloud-based deployment accounted for 65.74% of revenue in 2025, keeping this model at the center of the IT Hardware Refresh Cycle Optimization Software Market. That lead came from an easier rollout, lower upfront infrastructure costs, and the ability to monitor device estates across dispersed workforces from a single environment. In the IT Hardware Refresh Cycle Optimization Software Market, cloud delivery also helped buyers move faster when spreadsheet tracking or isolated tools no longer gave enough visibility. The segment remained especially relevant for organizations that had expanded hybrid work and needed a single view of assets across multiple locations.
Hybrid deployment is projected to grow at a 18.05% CAGR through 2031, making it the faster-moving option where legacy infrastructure still matters. ISO/IEC TS 19770-10:2025 supports structured ITAM implementation across mixed environments, and that aligns with the appeal of hybrid architectures that combine cloud analytics with local discovery and control. Many large buyers want cloud-side planning tools while keeping some discovery or record systems on premises for control, security, or residency needs. That makes hybrid a practical middle ground in the IT Hardware Refresh Cycle Optimization Software Market, especially where full migration would add unnecessary disruption.
Large enterprises captured 64.12% of the IT Hardware Refresh Cycle Optimization Software market share in 2025, reflecting the depth of their asset estates and the greater need for multi-region governance. These buyers usually have more mature service management environments, which have historically made them early adopters of lifecycle optimization software. In the IT Hardware Refresh Cycle Optimization Software Market, large accounts also tend to prefer integrated platforms that connect discovery, service records, and approval workflows. Their scale gives vendors larger contract values, but it also raises expectations around integration depth and process fit.
Small and medium enterprises are forecast to grow at a 18.21% CAGR through 2031, indicating that access barriers are starting to come down in the IT Hardware Refresh Cycle Optimization Software Market. SaaS delivery and simplified onboarding have made it easier for smaller firms to adopt structured refresh planning without building a large internal ITAM team. Freshworks has also expanded Freshservice with embedded discovery and dependency mapping, which supports the kind of simpler, broader visibility that smaller organizations often need first. As a result, the IT Hardware Refresh Cycle Optimization Software industry is opening to buyers that once relied on manual lists, local spreadsheets, or ad hoc replacement decisions.
Complete Report Scope:
- By Deployment Model
- Cloud
- On-Premise
- Hybrid
- By Enterprise Size
- Large Enterprises
- Small and Medium Enterprises
- By Application
- Hardware Lifecycle Analytics and Asset Performance Management
- Refresh Planning and Replacement Optimization
- Procurement, Redeployment and Reallocation Optimization
- Warranty and Support Contract Optimization
- Audit, Compliance and Asset Governance
- By End User
- IT and Telecom
- BFSI
- Industrial Manufacturing
- Energy and Utilities
- Oil and Gas
- Retail and E-Commerce
- Construction and Infrastructure
- Government and Public Sector
- Other End Users
- By Geography
- North America
- United States
- Canada
- Mexico
- South America
- Brazil
- Argentina
- Rest of South America
- Europe
- Germany
- United Kingdom
- France
- Italy
- Spain
- Russia
- Rest of Europe
- Asia-Pacific
- China
- India
- Japan
- South Korea
- Australia
- Rest of Asia-Pacific
- Middle East and Africa
- Middle East
- Saudi Arabia
- United Arab Emirates
- Turkey
- Rest of Middle East
- Africa
- South Africa
- Egypt
- Rest of Africa
- Middle East
- North America
Geography Analysis
Europe held a 34.56% share in 2025, making it the largest region in the IT Hardware Refresh Cycle Optimization Software Market. The region's demand base is supported by organizations that need a documented view of assets, repair options, and disposition steps across regulated operating environments. The European Union's Right to Repair Directive requires member states to adopt the rules into national law by July 31, 2026, thereby extending the relevance of repair-versus-replace decisions within hardware programs. The Basel Convention's e-waste amendments, effective from January 1, 2025, add further weight to controlled end-of-life handling and clearer movement of used equipment across borders. In the IT Hardware Refresh Cycle Optimization Software Market, these policy conditions help keep Europe at the forefront, as hardware refresh is increasingly linked to documentation quality and asset management discipline.
North America remained the second-largest region in the IT Hardware Refresh Cycle Optimization Software Market because many large enterprises there already run mature service and asset management programs. The Windows 10 end-of-support deadline had a clear effect on large endpoint estates, making structured inventory review and replacement planning more urgent for many buyers. The region also benefits from the presence of major platform vendors that sell broader service, security, and asset workflows into established enterprise accounts. That combination keeps North America closely tied to the product direction and revenue base of the IT Hardware Refresh Cycle Optimization Software Market.
Asia-Pacific is set to grow at an 18.34% CAGR through 2031, making it the fastest-growing regional block in the IT Hardware Refresh Cycle Optimization Software Market. Growth in the region is supported by ongoing digitization, data-center build-out, and new enterprise investment linked to manufacturing shifts and local infrastructure programs. The IT Hardware Refresh Cycle Optimization Software market in Asia-Pacific is growing as new device estates require structured tracking earlier in their life cycles, not only after assets become hard to manage. South America, the Middle East, and Africa remain at an earlier stage, though multinational operating standards are helping create demand in selected countries. Over time, those regions should see wider adoption as lifecycle governance becomes more formal and less reliant on manual recordkeeping.
- ServiceNow, Inc.
- Flexera Software LLC
- Ivanti, Inc.
- BMC Software, Inc.
- USU Software AG
- Snow Software AB
- Lansweeper NV
- Freshworks Inc.
- Zoho Corporation Private Limited
- Asset Panda LLC
- InvGate S.R.L.
- SysAid Technologies Ltd.
- Matrix42 AG
- OpenText Corporation
- Axonius, Inc.
- 4me, Inc.
- TOPdesk Nederland B.V.
- Oomnitza, Inc.
- Aspera GmbH
- Streamline, Inc.
- Device42, Inc.
- Cherwell Software, LLC
Additional Benefits:
- The market estimate (ME) sheet in Excel format
- 3 months of analyst support
TABLE OF CONTENTS
1 INTRODUCTION
- 1.1 Study Assumptions and Market Definition
- 1.2 Scope of the Study
2 RESEARCH METHODOLOGY
3 EXECUTIVE SUMMARY
4 MARKET LANDSCAPE
- 4.1 Market Overview
- 4.2 Market Drivers
- 4.2.1 Growth of Enterprise Hardware Refresh Backlogs
- 4.2.2 Windows and Endpoint Operating System End-of-Support Waves
- 4.2.3 Shift From Reactive Inventory to Predictive Lifecycle Optimization
- 4.2.4 Audit Pressure From Software and Hardware Compliance Gaps
- 4.2.5 AI-Based Failure Prediction and Replacement Timing
- 4.2.6 Sustainability-Linked Asset Renewal and E-Waste Reduction Goals
- 4.3 Market Restraints
- 4.3.1 Integration Complexity Across ITSM, EAM, and Procurement Stacks
- 4.3.2 Data Quality Gaps in Asset Discovery and Utilization Records
- 4.3.3 Budget Deferral in Mid-Market and Public Sector Buyers
- 4.3.4 Resistance to Policy-Driven Replacement Decisions
- 4.4 Industry Value-Chain Analysis
- 4.5 Regulatory Landscape
- 4.6 Technological Outlook
- 4.7 Porter's Five Forces Analysis
- 4.7.1 Bargaining Power of Buyers
- 4.7.2 Bargaining Power of Suppliers
- 4.7.3 Threat of New Entrants
- 4.7.4 Threat of Substitutes
- 4.7.5 Intensity of Competitive Rivalry
5 MARKET SIZE AND GROWTH FORECASTS (VALUE)
- 5.1 By Deployment Model
- 5.1.1 Cloud
- 5.1.2 On-Premise
- 5.1.3 Hybrid
- 5.2 By Enterprise Size
- 5.2.1 Large Enterprises
- 5.2.2 Small and Medium Enterprises
- 5.3 By Application
- 5.3.1 Hardware Lifecycle Analytics and Asset Performance Management
- 5.3.2 Refresh Planning and Replacement Optimization
- 5.3.3 Procurement, Redeployment and Reallocation Optimization
- 5.3.4 Warranty and Support Contract Optimization
- 5.3.5 Audit, Compliance and Asset Governance
- 5.4 By End User
- 5.4.1 IT and Telecom
- 5.4.2 BFSI
- 5.4.3 Industrial Manufacturing
- 5.4.4 Energy and Utilities
- 5.4.5 Oil and Gas
- 5.4.6 Retail and E-Commerce
- 5.4.7 Construction and Infrastructure
- 5.4.8 Government and Public Sector
- 5.4.9 Other End Users
- 5.5 By Geography
- 5.5.1 North America
- 5.5.1.1 United States
- 5.5.1.2 Canada
- 5.5.1.3 Mexico
- 5.5.2 South America
- 5.5.2.1 Brazil
- 5.5.2.2 Argentina
- 5.5.2.3 Rest of South America
- 5.5.3 Europe
- 5.5.3.1 Germany
- 5.5.3.2 United Kingdom
- 5.5.3.3 France
- 5.5.3.4 Italy
- 5.5.3.5 Spain
- 5.5.3.6 Russia
- 5.5.3.7 Rest of Europe
- 5.5.4 Asia-Pacific
- 5.5.4.1 China
- 5.5.4.2 India
- 5.5.4.3 Japan
- 5.5.4.4 South Korea
- 5.5.4.5 Australia
- 5.5.4.6 Rest of Asia-Pacific
- 5.5.5 Middle East and Africa
- 5.5.5.1 Middle East
- 5.5.5.1.1 Saudi Arabia
- 5.5.5.1.2 United Arab Emirates
- 5.5.5.1.3 Turkey
- 5.5.5.1.4 Rest of Middle East
- 5.5.5.2 Africa
- 5.5.5.2.1 South Africa
- 5.5.5.2.2 Egypt
- 5.5.5.2.3 Rest of Africa
- 5.5.5.1 Middle East
- 5.5.1 North America
6 COMPETITIVE LANDSCAPE
- 6.1 Market Concentration
- 6.2 Strategic Moves
- 6.3 Market Share Analysis
- 6.4 Company Profiles (includes Global Level Overview, Market Level Overview, Core Segments, Financials as available, Strategic Information, Market Rank/Share, Products and Services, Recent Developments)
- 6.4.1 ServiceNow, Inc.
- 6.4.2 Flexera Software LLC
- 6.4.3 Ivanti, Inc.
- 6.4.4 BMC Software, Inc.
- 6.4.5 USU Software AG
- 6.4.6 Snow Software AB
- 6.4.7 Lansweeper NV
- 6.4.8 Freshworks Inc.
- 6.4.9 Zoho Corporation Private Limited
- 6.4.10 Asset Panda LLC
- 6.4.11 InvGate S.R.L.
- 6.4.12 SysAid Technologies Ltd.
- 6.4.13 Matrix42 AG
- 6.4.14 OpenText Corporation
- 6.4.15 Axonius, Inc.
- 6.4.16 4me, Inc.
- 6.4.17 TOPdesk Nederland B.V.
- 6.4.18 Oomnitza, Inc.
- 6.4.19 Aspera GmbH
- 6.4.20 Streamline, Inc.
- 6.4.21 Device42, Inc.
- 6.4.22 Cherwell Software, LLC
7 MARKET OPPORTUNITIES AND FUTURE OUTLOOK
- 7.1 White-Space and Unmet-Need Assessment

 印度IT硬體市場:市場佔有率分析、產業趨勢與統計及成長預測(2026-2031年)IT硬體訂閱(DaaS - 設備即服務):市場佔有率分析、產業趨勢與統計、成長預測(2026-2031年)永續IT硬體:市場佔有率分析、產業趨勢與統計及成長預測(2026-2031年)IT設備分銷:市場佔有率分析、產業趨勢與統計、成長預測(2026-2031年)
 2026年全球可解釋人工智慧儀表板顯示市場報告2026年全球硬體儲存市場報告
 全球硬檢驗市場全球硬體儲存市場
 硬體儲存市場規模、佔有率、成長分析,按硬體儲存解決方案類型、儲存容量、使用環境、地區 - 產業預測,2025-2032