


 |
市場調查報告書
商品編碼
2117325
清算所和結算機構:市場佔有率分析、行業趨勢和統計數據、成長預測(2026-2031 年)Clearing Houses And Settlements - Market Share Analysis, Industry Trends & Statistics, Growth Forecasts (2026 - 2031) |
||||||

※ 本網頁內容可能與最新版本有所差異。詳細情況請與我們聯繫。
根據 Mordor Intelligence 預測,清算結算市場規模預計將從 2025 年的 125 億美元成長到 2026 年的 131.3 億美元,然後從 2026 年到 2031 年以 5.07% 的複合年成長率成長,到 2031 年達到 168.1 億美元。
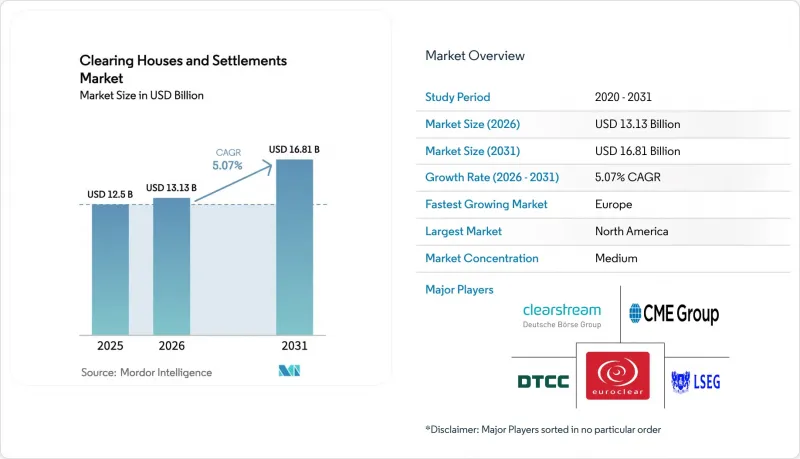
本報告按類型(出境清算所、入境清算所)、服務(TARGET2、SEPA、EBICS、其他服務(EURO1、CCBM))和地區(北美、歐洲、亞太、拉丁美洲、中東和非洲)進行細分。對於以上所有細分市場,本報告均提供了全球清算結算市場的市場規模和預測(以金額為準:十億美元)。
全球清算和結算市場的趨勢和洞察
全球貿易活動的擴張正在推動對清算基礎設施的需求。
由於電子通路和演算法交易的興起,每日交易量不斷成長,清算公司被迫擴大處理能力,否則可能會出現瓶頸。 2024年,TARGET服務處理了超過16.6億筆交易,交易量激增201.8%。 TARGET2-Securities在2024年結算了2.026億筆證券交易,總額達292.7兆美元(248.9兆歐元),推動了跨境結算向集中式平台的轉變。美國財政部的清算授權規定,到2027年中期,每日高達4兆美元的交易將透過中央清算系統進行清算。截至2025年6月30日,美國主要中央對手方清算機構的總保證金已達963億美元。日本證券交易結算機構(SESO)2024年的利率互換清算量創歷史新高,顯示利率對沖交易向中央清算機構集中的趨勢日益加劇。韓國交易所(KRX)報告稱,衍生性商品交易強勁成長,場外清算未結金額超過2兆美元,顯示電子交易活動的活性化推動了處理能力的提升。 FedNow服務報告稱,2025年第三季交易量達250萬筆,總額達3073億美元,顯示即時結算持續擴張,即時結算也取得進展。
監管機構將重點放在中央清算上,以降低系統性風險。
美國於2023年最終確定的監管條例擴大了中央清算的範圍,將現金政府債券和回購交易納入其中,合規期限分別為2026年12月31日和2027年6月30日。這將提高透明度,並加強毛利率管理的規範性。截至2024年第四季,僅有37%的交易商回購交易納入中央清算,這意味著價值2.4兆美元的雙邊交易仍面臨結算摩擦,而這些摩擦本應透過清算來解決。儘管EMIR REFIT將報告細化到204個項目,但美國銀行利率衍生品的中央清算滲透率已從2024年第四季的32.5%上升至2025年第一季的48.1%(名目以金額為準),凸顯了監管對標準化的影響。到2023年,歐洲信用違約交換(CDS)市場實現了較高的清算滲透率,這與危機後將標準化產品整合到受歐洲市場基礎設施監管條例(EMIR)監管的中央清算公司(CCP)的總體趨勢相符。儘管印度透過交易所關聯清算進行的公司債結算正在成長,但與已開發市場相比仍然規模較小,這凸顯了交易後領域進一步標準化和應用的空間。國際證監會組織(IOSCO)的金融市場基礎設施(PFMI)架構與歐盟網路風險架構的整合,強化了對韌性和資料完整性的共同期望,而這些期望正日益指南全球金融市場基礎設施(FMI)的運作。
高額抵押品和資本要求限制了市場准入。
到2025年6月30日,美國政府公債清算基金總額要求將增加至963億美元,這項增幅將根據各成員的風險狀況進行分配,從而提高了小規模公司的准入門檻。倫敦金屬交易所清算系統(LME Clear)和其他協議中規定的違約基金最低繳款額和淨資本要求,限制了只有擁有足夠資本提供合格抵押品的機構才能直接參與清算。區域中央對手方(CCP)對抵押品合格和比例的調整,包括沙烏地阿拉伯的穆卡薩清算所(Muqassa),雖然提供了柔軟性,但並不能完全抵消所有小規模參與者面臨的美元流動性限制。預計美國財政部清算計畫將大幅提高保證金,迫使中小型經紀仲介商簽署擔保准入協議,從而損害盈利和控制權。印度公司債市場相當一部分場外交易部位仍被排除在集中清算之外,加劇了風險和流動性分散的局面。因此,在清算結算市場中,擁有各種合格抵押品的大型參與者與資本結構有限的中小型企業之間的差距正在擴大。
細分市場分析
Outward Clearing House預計在2025年將佔據67.50%的市場佔有率,並在2031年之前以5.82%的複合年成長率成長,這得益於多元化的淨額結算機制,該機制降低了總債務並緩解了跨境資金籌措壓力。 Outward平台的流動性優勢延伸至日常運營,因為它在清算高價值結算和批發交易的同時,還能匯集跨司法管轄區的風險敞口以實現高效對沖。 EURO1在2024年處理了4577萬筆結算,總額達53.4兆美元(45.4兆歐元),透過作為一個互補的多邊網路系統,最終在TARGET2中結算最終餘額,從而最佳化了參與者的流動性狀況。隨著美國財政部中央清算的授權,Outward平台到2027年將實現每日4兆美元的交易量,進一步推動大規模淨額結算和利潤率效率的製度化。
國內清算機構專注於國內結算和證券交易,採用適合各國市場結構的風險模型,這與較低的抵押品要求和更簡化的操作流程相一致。印度的交易所關聯公司債清算系統處理著大量交易,但集中式場外私募配售的盛行限制了其採用流入管道。香港中央結算系統(CCASS)表明,即使在國內環境下,嚴格的淨額結算也能顯著緩解流動性問題,預計到2025年底,股票和基金的淨額結算比率將分別超過98%和88%。隨著海外交易所增加人工智慧風險分析和分散式帳本技術(DLT)試點專案等功能,國內模式也將逐步適應互通標準,以維持結算和抵押流程的連續性。在鼓勵集中風險管理和統一保證金制度的法規結構下,海外平台仍是清算結算市場跨境風險聚合的主要管道。
區域分析
在聯準會廣泛的服務和美國國債交易規模的支持下,北美預計將在2025年佔據全球清算結算市場34.65%的佔有率。國家支付服務公司(NSS)在2024年處理了28.3兆美元的交易,每日均結算量達1,126億美元。這為該地區的大額結算和線上結算流程奠定了堅實的基礎。 FedNow新增了即時處理能力,在2025年第三季處理了250萬筆交易,總額達3073億美元。這反映了全美金融機構對該技術的快速採用。 2025年第一季,利率對沖推動了集中清算衍生性商品名目餘額的成長,促進了美國銀行對中央清算機構(CCP)的日益普及。隨著美國證券交易委員會(SEC)政府債務清理計畫的逐步成形,已通過核准清算機構和候選中央清算機構之間的競爭日趨激烈,每天有4兆美元的交易轉向集中清算。加拿大和墨西哥的基礎設施正在透過已建立的即時和批量處理系統(例如墨西哥的 SPEI、促進數位化使用的輔助結算識別碼等)擴大該地區的影響範圍。
預計到2031年,歐洲將以6.65%的複合年成長率實現最快成長,這主要得益於TARGET服務的整合、ISO 20022標準的協調統一以及即時結算法規的推動。 Clearstream在T2S框架下實現了高結算效率,每日交割結算(DVP)的實施也接近完成。自動化抵押機制有助於應對資金籌措尖峰時段的資金需求。 LCH和ICE Clear Europe作為歐洲證券及市場管理局(ESMA)監管下的二級中央對手方(CCP)運營,加強了該地區場外利率和信用衍生品上市交易的監管一致性。法國銀行正在參與一項由中央銀行協調的跨境幣化舉措,這預示著未來批發交易清算和結算的互通性。來自多個國家的案例研究,例如葡萄牙的T2S活動,證實了歐元體系一體化體系在成員國中的廣泛應用。隨著DORA的生效,擁有大規模網路安全計畫的現有營運商在合規性和準備方面獲得了優勢。
在亞太地區,各市場的成熟度水準不一,從日本日本證券結算公司(JSCC)創紀錄的互換清算量,到韓國場外交易市場的快速成長,再到印度等市場對即時結算的廣泛應用。香港中央結算系統(CCASS)的T+2處理效率高達99.89%,而場外清算衍生性商品交易量預計將在2025年上半年大幅成長,這反映了股票和衍生性商品系統的強勁實力。在印度公司債市場,儘管發行量不斷擴大,但二次性市場流動性挑戰依然存在,凸顯了對雙向交易管道的持續依賴以及清算實施方面仍有提升空間。在澳大利亞,場外衍生性商品和實體股票清算量龐大,但事故發生後加強的監管措施提高了對整個澳洲證券交易所(ASX)系統的預期,並促使其採取糾正措施。新加坡的外匯交易量超過每日1.5兆新元,透過先進的執行和風險管理工具增強了區域流動性並支持了抵押品最佳化。在南美洲,巴西的PIX引領著無現金支付的普及,每月數十億筆交易推動無現金支付的發展,並吸引了許多家庭和企業的廣泛參與。智利的RTGS系統和銀行卡使用率指標顯示,其人均支付使用率很高,顯示該國正明顯轉向數位化支付。在非洲和中東,海灣合作理事會成員國和南非也展現出積極的發展勢頭,其中阿拉伯聯合大公國的平台遷移和南非的交易量成長都體現了其強大的基礎設施。
其他好處
- Excel格式的市場預測(ME)表
- 3個月的分析師支持
目錄
第1章:引言
- 研究假設和市場定義
- 調查範圍
第2章:調查方法
第3章執行摘要
第4章 市場狀況
- 市場促進因素
- 隨著全球貿易活動的擴張,電子交易和大宗交易的增加推動了對高效清算和結算基礎設施的需求。
- 在金融危機後旨在降低系統性風險和提高市場透明度的改革背景下,監管重點放在了中央清算。
- 人工智慧、區塊鏈和自動化等支付技術的進步正在提高處理速度、準確性和營運效率。
- 隨著跨境和衍生性商品交易的增加,需要能夠跨越不同司法管轄區的互通性和容錯清算系統。
- 在市場波動性日益加劇的情況下,集中清算機制的採用正在加速,交易對手風險管理也越來越受到關注。
- 電子交易和高頻交易平台的擴張正在推動對高度擴充性、高容量支付解決方案的需求。
- 市場限制因素
- 高額抵押品和資本要求推高了營運成本,限制了小規模市場參與企業。
- 隨著法規和合規性變得越來越複雜,全球標準也在不斷變化,實施和監控的負擔也越來越重。
- 日益嚴重的網路安全風險要求我們持續投資高價值交易系統的安全基礎設施。
- 依賴傳統支付基礎設施限制了可擴展性,並延緩了與下一代技術的整合。
- 價值供應鏈分析
- 監管和技術展望
- 波特五力分析
第5章 市場規模與成長預測
- 按類型
- 對外清算所
- 內向清算所
- 按服務
- TARGET2
- SEPA
- EBICS
- 其他
- EURO1
- CCBM
- 按地區
- 北美洲
- 美國
- 加拿大
- 墨西哥
- 南美洲
- 巴西
- 阿根廷
- 智利
- 秘魯
- 其他南美國家
- 歐洲
- 英國
- 德國
- 法國
- 西班牙
- 義大利
- 比荷盧經濟聯盟(比利時、荷蘭、盧森堡)
- 北歐國家(瑞典、挪威、丹麥、芬蘭、冰島)
- 其他歐洲國家
- 亞太地區
- 中國
- 印度
- 日本
- 韓國
- 澳洲
- 東南亞(新加坡、印尼、馬來西亞、泰國、越南、菲律賓)
- 其他亞太國家
- 中東和非洲
- 阿拉伯聯合大公國
- 沙烏地阿拉伯
- 南非
- 奈及利亞
- 其他中東和非洲國家
- 北美洲
第6章 競爭情勢
- 市場集中度
- 策略趨勢
- 市佔率分析
- 公司簡介
- Intact Financial Corporation
- Apex Clearing Corporation
- Bank of America Merrill Lynch
- FOLIOfn, Inc.(Folio Financial Investments)
- Goldman Sachs Execution and Clearing LP
- JP Morgan Clearing Corp
- National Financial Services LLC
- Pershing LLC
- RBC Correspondent Services(Royal Bank of Canada)
- StoneX Group Inc.
- Southwest Securities Inc.
- Depository Trust & Clearing Corporation(DTCC)
- LCH Limited(London Stock Exchange Group/LSEG)
- Euroclear Group
- Clearstream(Deutsche Borse Group)
- SIX x-clear & SIX SIS(SIX Group)
- CME Clearing(CME Group)
- ICE Clear(Intercontinental Exchange)
- Outward Clearing House
- BNY Mellon
- Japan Securities Clearing Corporation(JSCC)
第7章 市場機會與未來展望
According to Mordor Intelligence, the clearing houses and settlements market size is expected to grow from USD 12.5 billion in 2025 to USD 13.13 billion in 2026 and is forecast to reach USD 16.81 billion by 2031 at 5.07% CAGR over 2026-2031.
This report is Segmented by Type (Outward Clearing House, Inward Clearing House), by Service (TARGET2, SEPA, EBICS, Other Services (EURO1, CCBM)), and by Geography (North America, Europe, Asia-Pacific, Latin America, and the Middle East and Africa). The Report Offers Market Size and Forecasts for the Global Clearing Houses and Settlements Market in Value (USD Billion) for all the Above Segments.
Global Clearing Houses And Settlements Market Trends and Insights
Growth in Global Trading Activity Driving Clearing Infrastructure Demand
Electronic channels and algorithmic trading amplify daily volumes, pushing clearing operators to scale capacity or risk bottlenecks, with TARGET Services processing over 1.66 billion transactions in 2024 amid a 201.8% volume surge. TARGET2-Securities settles 202.6 million securities transactions valued at USD 292.7 trillion (EUR 248.9 trillion) in 2024, reinforcing the shift toward centralized platforms for harmonized cross-border settlement. The U.S. Treasury clearing mandate channels up to USD 4 trillion in daily transactions toward central clearing by mid-2027, with aggregate margins at a key U.S. CCP reaching USD 96.3 billion by June 30, 2025. Japan Securities Clearing Corporation sets record interest-rate swap clearing in 2024, signaling the depth of rate hedging flows consolidating at central counterparties. South Korea's KRX reports strong growth in derivatives activity and OTC clearing balances above USD 2 trillion, indicating the capacity shift that comes with electronic trading intensity. The instant payment expansion continues as the FedNow Service reports 2.5 million quarterly transactions worth USD 307.3 billion in Q3 2025, showcasing the real-time settlement trajectory.
Regulatory Emphasis on Central Clearing Reduces Systemic Risk
United States rules finalized in 2023 extend central clearing to cash Treasury and repo transactions with compliance dates on December 31, 2026, and June 30, 2027, which elevates transparency and aggregate margining discipline. Only 37% of dealer repo was centrally cleared as of Q4 2024, leaving USD 2.4 trillion in bilateral activity exposed to settlement frictions that clearing aims to address. EMIR REFIT lifts reporting granularity to 204 fields, while United States bank interest-rate derivatives show higher central clearing penetration at 48.1% notional by Q1 2025 from 32.5% in Q4 2024, underscoring regulatory impact on standardization. European CDS markets reached high clearing penetration by 2023, which aligns with the broader post-crisis emphasis on standardized products entering CCPs under EMIR oversight. India's corporate bond settlement through exchange-linked clearing grows yet remains shallow relative to developed markets, highlighting room for standardization and deeper post-trade adoption. Convergence under CPMI-IOSCO PFMI and the EU's cyber risk frameworks sustains harmonized expectations for resilience and data integrity that increasingly guide global FMI operations.
High Collateral and Capital Requirements Constrain Market Entry
Aggregate clearing fund requirements for United States government securities rise to USD 96.3 billion by June 30, 2025, with increases distributed across members in line with risk profiles, which raises barriers to entry for smaller firms. Minimum default fund contributions and net capital thresholds, such as those at LME Clear, restrict direct clearing participation to well-capitalized institutions that can supply eligible collateral. Adjustments in collateral eligibility and percentages at regional CCPs, including Saudi Arabia's Muqassa, provide flexibility yet do not fully offset USD liquidity constraints across smaller participants. Large projected margin increases related to Treasury clearing timelines push smaller broker-dealers toward sponsored access arrangements that dilute economics and control. OTC positions in India's corporate bond space remain outside centralized clearing in significant size, which sustains bilateral risk and diffusion of liquidity. The clearing houses and settlements market, therefore, sees a widening divide between large participants with diverse eligible collateral and smaller firms managing constrained capital stacks.
Other drivers and restraints analyzed in the detailed report include:
- Advancements in Clearing Technologies Enhance Operational Efficiency
- Increase in Cross-border and Derivatives Trading Requires Interoperable Clearing
- Rising Regulatory and Compliance Complexity Increases Implementation Burdens
For complete list of drivers and restraints, kindly check the Table Of Contents.
Segment Analysis
Outward clearing houses held a 67.50% share in 2025 and are projected to grow at a 5.82% CAGR through 2031, supported by multilateral netting that compresses gross obligations and reduces funding stress across borders. Liquidity benefits carry into day-to-day operations because outward platforms settle large-value payments and wholesale transactions while pooling exposures across jurisdictions for efficient offset. EURO1 settled 45.77 million payments worth USD 53.4 trillion (EUR 45.4 trillion) in 2024 and operates as a complementary multilateral net system that ultimately settles final balances in TARGET2, which optimizes participant liquidity profiles. Mandated U.S. Treasury central clearing positions outward venues to receive USD 4 trillion in daily activity by 2027, which will further institutionalize netting and margin efficiency at scale.
Inward clearing houses focus on domestic payment, and securities flows with risk models suited to national market structures, which aligns with lower collateral needs and simpler operational expectations. India's exchange-linked clearing for corporate bonds processes sizable trade counts, although the dominance of private placements outside centralized venues limits penetration for inward routes. Hong Kong's CCASS shows how disciplined netting can materially relieve liquidity even in domestic environments, with stock and funds netting ratios above 98% and 88%, respectively, in late 2025. As outward venues add features like AI-enhanced risk analytics and DLT pilots, inward models gradually adapt to interoperable standards to maintain continuity of settlement and collateral processes. With regulatory frameworks incentivizing centralized risk and consistent margining, outward platforms remain the primary channel for cross-border risk aggregation within the clearing houses and settlements market.
Complete Report Scope:
- By Type
- Outward Clearing House
- Inward Clearing House
- By Service
- TARGET2
- SEPA
- EBICS
- Other Services
- EURO1
- CCBM
- By Geography
- North America
- United States
- Canada
- Mexico
- South America
- Brazil
- Argentina
- Chile
- Peru
- Rest of South America
- Europe
- United Kingdom
- Germany
- France
- Spain
- Italy
- Benelux (Belgium, Netherlands, and Luxembourg)
- Nordics (Sweden, Norway, Denmark, Finland, and Iceland)
- Rest of Europe
- Asia-Pacific
- China
- India
- Japan
- South Korea
- Australia
- South-East Asia (Singapore, Indonesia, Malaysia, Thailand, Vietnam, and Philippines)
- Rest of Asia-Pacific
- Middle East and Africa
- United Arab Emirates
- Saudi Arabia
- South Africa
- Nigeria
- Rest of Middle East and Africa
- North America
Geography Analysis
North America held 34.65% of the clearing houses and settlements market in 2025, supported by the breadth of Federal Reserve services and the scale of U.S. Treasury transactions. The National Settlement Service processed USD 28.3 trillion in 2024 with average daily settlements of USD 112.6 billion, which reinforces the region's foundation for large-value and net settlement workflows. FedNow adds real-time capability with 2.5 million transactions totaling USD 307.3 billion in Q3 2025, reflecting fast integration by institutions across the country. Centrally cleared derivatives notional rose in Q1 2025, fueled by interest-rate hedging, which supports wider CCP adoption across U.S. banks. The SEC's Treasury clearing timelines intensify competition among approved and prospective CCPs as the pathway for USD 4 trillion in daily activity shifts toward central clearing. Canada's and Mexico's infrastructures extend the region's footprint with established real-time and batch systems, including Mexico's SPEI and adjunct payment identifiers that fuel digital usage.
Europe delivers the fastest growth at a 6.65% CAGR through 2031, underpinned by the convergence of TARGET Services, ISO 20022 harmonization, and the Instant Payments Regulation. Clearstream drives high settlement efficiency under T2S with day-end delivery-versus-payment performance near completion, and auto-collateralization supports resilient funding in peak periods. LCH and ICE Clear Europe operate as Tier 2 CCPs under ESMA, which consolidates supervisory alignment across OTC rate, credit, and listed derivatives in the region. France's central bank participates in cross-border tokenization initiatives under central bank coordination, which points to future interoperability of clearing and settlement for wholesale transactions. National case studies such as Portugal's T2 activity confirm the breadth of adoption across member states in the consolidated Eurosystem stack. As DORA takes effect, incumbents with scaled cyber programs gain an advantage in compliance and readiness.
Asia-Pacific shows heterogeneous maturity, from Japan's record swap clearing at JSCC to rapid OTC growth in South Korea and strong instant-payment penetration in markets like India. Hong Kong's CCASS posts 99.89% T+2 efficiency while OTC Clear's derivative volumes rise sharply in H1 2025, which reflects both equity and derivatives system strength. India's corporate bond market retains liquidity challenges in secondary trading despite expanding issuance, which highlights continued reliance on bilateral channels and room for clearing adoption. Australia clears high volumes in OTC derivatives and cash equities, though post-incident oversight has tightened expectations and remediation across ASX systems. Singapore's FX turnover above SGD 1.5 trillion per day strengthens regional liquidity and supports collateral optimization via advanced execution and risk tools. In South America, Brazil's PIX leads adoption with billions of monthly transactions and broad participation by households and firms, catalyzing cashless growth. Chile's RTGS and card usage metrics show a clear shift toward digital flows with high per-capita payment usage. Africa and the Middle East see strong activity in the GCC and South Africa, with the UAE's platform transitions and South Africa's turnover growth pointing to resilient infrastructures.
- Intact Financial Corporation
- Apex Clearing Corporation
- Bank of America Merrill Lynch
- FOLIOfn, Inc. (Folio Financial Investments)
- Goldman Sachs Execution and Clearing LP
- J.P. Morgan Clearing Corp
- National Financial Services LLC
- Pershing LLC
- RBC Correspondent Services (Royal Bank of Canada)
- StoneX Group Inc.
- Southwest Securities Inc.
- Depository Trust & Clearing Corporation (DTCC)
- LCH Limited (London Stock Exchange Group / LSEG)
- Euroclear Group
- Clearstream (Deutsche Borse Group)
- SIX x-clear & SIX SIS (SIX Group)
- CME Clearing (CME Group)
- ICE Clear (Intercontinental Exchange)
- Outward Clearing House
- BNY Mellon
- Japan Securities Clearing Corporation (JSCC)
Additional Benefits:
- The market estimate (ME) sheet in Excel format
- 3 months of analyst support
TABLE OF CONTENTS
1 Introduction
- 1.1 Study Assumptions & Market Definition
- 1.2 Scope of the Study
2 Research Methodology
3 Executive Summary
4 Market Landscape
- 4.1 Market Drivers
- 4.1.1 Growth in global trading activity, with rising electronic and high-volume transactions increasing demand for efficient clearing and settlement infrastructure
- 4.1.2 Regulatory emphasis on central clearing, driven by post-financial-crisis reforms aimed at reducing systemic risk and enhancing market transparency
- 4.1.3 Advancements in clearing technologies, including AI, blockchain, and automation, improving processing speed, accuracy, and operational efficiency
- 4.1.4 Increase in cross-border and derivatives trading, requiring interoperable, resilient clearing systems across jurisdictions
- 4.1.5 Heightened focus on counterparty risk management, as market volatility accelerates adoption of centralized clearing mechanisms
- 4.1.6 Expansion of electronic and high-frequency trading platforms, driving the need for scalable, high-capacity settlement solutions
- 4.2 Market Restraints
- 4.2.1 High collateral and capital requirements, raising operational costs and limiting participation by smaller market players
- 4.2.2 Rising regulatory and compliance complexity, with evolving global standards increasing implementation and monitoring burdens
- 4.2.3 Escalating cybersecurity risks, necessitating continuous investment in secure infrastructure for high-value transaction systems
- 4.2.4 Dependence on legacy clearing infrastructure, constraining scalability and slowing integration with next-generation technologies
- 4.3 Value / Supply-Chain Analysis
- 4.4 Regulatory or Technological Outlook
- 4.5 Porter's Five Forces Analysis
- 4.5.1 Threat of New Entrants
- 4.5.2 Bargaining Power of Buyers
- 4.5.3 Bargaining Power of Suppliers
- 4.5.4 Threat of Substitutes
- 4.5.5 Competitive Rivalry
5 Market Size & Growth Forecasts (Value)
- 5.1 By Type
- 5.1.1 Outward Clearing House
- 5.1.2 Inward Clearing House
- 5.2 By Service
- 5.2.1 TARGET2
- 5.2.2 SEPA
- 5.2.3 EBICS
- 5.2.4 Other Services
- 5.2.4.1 EURO1
- 5.2.4.2 CCBM
- 5.3 By Geography
- 5.3.1 North America
- 5.3.1.1 United States
- 5.3.1.2 Canada
- 5.3.1.3 Mexico
- 5.3.2 South America
- 5.3.2.1 Brazil
- 5.3.2.2 Argentina
- 5.3.2.3 Chile
- 5.3.2.4 Peru
- 5.3.2.5 Rest of South America
- 5.3.3 Europe
- 5.3.3.1 United Kingdom
- 5.3.3.2 Germany
- 5.3.3.3 France
- 5.3.3.4 Spain
- 5.3.3.5 Italy
- 5.3.3.6 Benelux (Belgium, Netherlands, and Luxembourg)
- 5.3.3.7 Nordics (Sweden, Norway, Denmark, Finland, and Iceland)
- 5.3.3.8 Rest of Europe
- 5.3.4 Asia-Pacific
- 5.3.4.1 China
- 5.3.4.2 India
- 5.3.4.3 Japan
- 5.3.4.4 South Korea
- 5.3.4.5 Australia
- 5.3.4.6 South-East Asia (Singapore, Indonesia, Malaysia, Thailand, Vietnam, and Philippines)
- 5.3.4.7 Rest of Asia-Pacific
- 5.3.5 Middle East and Africa
- 5.3.5.1 United Arab Emirates
- 5.3.5.2 Saudi Arabia
- 5.3.5.3 South Africa
- 5.3.5.4 Nigeria
- 5.3.5.5 Rest of Middle East and Africa
- 5.3.1 North America
6 Competitive Landscape
- 6.1 Market Concentration
- 6.2 Strategic Moves
- 6.3 Market Share Analysis
- 6.4 Company Profiles {(includes Global level Overview, Market level overview, Core Segments, Financials as available, Strategic Information, Market Rank/Share for key companies, Products & Services, and Recent Developments)}
- 6.4.1 Intact Financial Corporation
- 6.4.2 Apex Clearing Corporation
- 6.4.3 Bank of America Merrill Lynch
- 6.4.4 FOLIOfn, Inc. (Folio Financial Investments)
- 6.4.5 Goldman Sachs Execution and Clearing LP
- 6.4.6 J.P. Morgan Clearing Corp
- 6.4.7 National Financial Services LLC
- 6.4.8 Pershing LLC
- 6.4.9 RBC Correspondent Services (Royal Bank of Canada)
- 6.4.10 StoneX Group Inc.
- 6.4.11 Southwest Securities Inc.
- 6.4.12 Depository Trust & Clearing Corporation (DTCC)
- 6.4.13 LCH Limited (London Stock Exchange Group / LSEG)
- 6.4.14 Euroclear Group
- 6.4.15 Clearstream (Deutsche Borse Group)
- 6.4.16 SIX x-clear & SIX SIS (SIX Group)
- 6.4.17 CME Clearing (CME Group)
- 6.4.18 ICE Clear (Intercontinental Exchange)
- 6.4.19 Outward Clearing House
- 6.4.20 BNY Mellon
- 6.4.21 Japan Securities Clearing Corporation (JSCC)
7 Market Opportunities & Future Outlook
- 7.1 Expansion of central clearing across new asset classes
- 7.2 Technology-led efficiency and value-added services

 歐洲清算所和結算機構:市場佔有率分析、行業趨勢和統計數據以及成長預測(2026-2031 年)支付與結算:市場佔有率分析、產業趨勢與統計、成長預測(2026-2031)英國支付與清算:市佔率分析、產業趨勢與統計、成長預測(2026-2031)
 2026年全球清算結算市場報告即時支付:市場佔有率分析、產業趨勢與統計、成長預測(2026-2031)
 支付監控市場規模、佔有率和成長分析:按組件、部署模式、應用、最終用戶和地區分類-2026-2033年產業預測
 全球支付監控市場
 清算結算系統市場預測至2034年:按交易後功能、支援的資產類別、基礎設施類型、部署方式和最終用戶分類的全球分析2026年全球補丁編配平台市場報告
 即時支付市場分析及至2035年預測:依類型、產品、服務、技術、組件、應用、最終用戶、部署模式及類型分類