


 |
市場調查報告書
商品編碼
2116800
燃料電池電動巴士:市場佔有率分析、產業趨勢與統計及成長預測(2026-2031)Fuel Cell Electric Bus - Market Share Analysis, Industry Trends & Statistics, Growth Forecasts (2026 - 2031) |
||||||

※ 本網頁內容可能與最新版本有所差異。詳細情況請與我們聯繫。
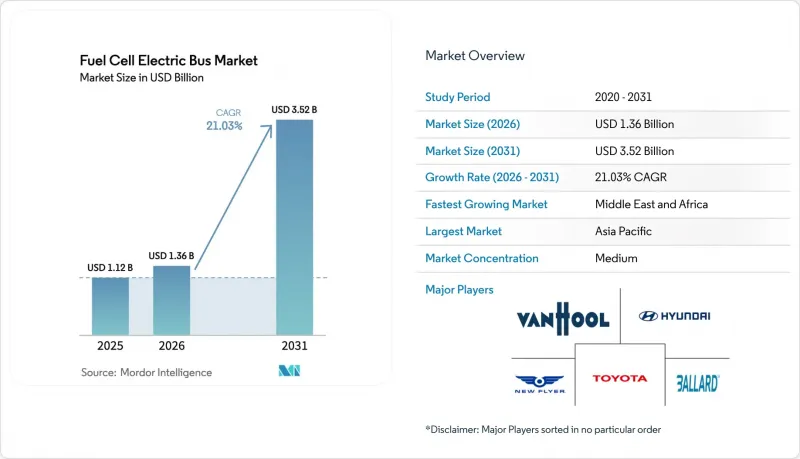
2025年燃料電池電動巴士市場價值11.2億美元,預計2031年將從2026年的13.6億美元成長到35.2億美元,預測期(2026-2031年)複合年成長率為21.03%。
本報告按應用領域(城際和市內)、公車類型(新型氫燃料電池公車和改裝型氫燃料電池公車)、燃料電池類型(質子交換膜燃料電池 (PEMFC) 等)、額定功率(小於 150 kW 和 150 kW 以上)、公車長度(9-12 公尺和 120 公里以上)以及細分市場預測以價值(美元)和銷售(輛)為單位呈現。
全球燃料電池電動巴士市場趨勢及洞察
加強公共運輸車輛零排放法規
許多公共交通系統目前面臨逐步淘汰柴油車輛的法律期限,這促使各方簽署了氫燃料電池公車的多年框架協議。加州強制要求所有車輛在2040年前實現零排放,這導致其「創新清潔交通」法規下的短期訂單激增。歐盟的清潔車輛指令設定了2024年新交付車輛中49%為零排放公車的目標,其中燃料電池車型已佔3%。新興市場也遵循類似的路徑。阿布達比設定了2030年綠色車輛佔比達到20%的目標,為原始設備製造商(OEM)提供了明確的採購前景。因此,具有法律約束力的法規正在支撐燃料電池電動公車的長期需求成長。
從2025年起,綠色氫氣價格將大幅下降。
隨著電解槽的擴大和可再生能源成本的降低,預計到2050年,氫氣的平均生產成本將降至每公斤2.70歐元,亞洲地區將降至每公斤1.80歐元。這將使氫氣的營運成本與柴油持平。 2023年,中國氫能產業的收入幾乎加倍,達到39.3億元人民幣,顯示設備和供應鏈的價格呈下降趨勢。新近資金籌措的氫能中心,例如美國的“太平洋西北氫能中心”,將帶來區域成本優勢,並降低公共交通車隊的燃料成本。
來自快速充電電池電動巴士的競爭
2024年,在歐盟都市區領域,純電動公車的銷售量首次超過柴油公車,這主要得益於電池成本的降低和充電樁的普及。根據國際能源總署(IEA)統計,2024年全球新增電動公車數量超過7萬輛,比前一年增加30%。由於對於日均行駛里程低於200公里的線路,純電動公車的總擁有成本(TCO)仍然具有競爭力,因此氫能公車的支持者不得不將重點放在長途出行和高運轉率的細分市場。
細分市場分析
城市線路憑藉其集中式加氫和可預測的營運週期,預計到2025年將佔總收入的63.10%,燃料電池電動巴士市場規模將達到7.1億美元。城際線路仍在發展中,但預計將以24.74%的複合年成長率快速成長,因為運營商可以利用氫燃料300-500公里的“最佳續航里程”,避免中途加氫。燃料電池電動巴士市場受益於有限的車庫空間以及升級電網以容納兆瓦級充電樁的高成本。智利車隊600公里續航里程等示範計畫證明了氫燃料適用於長途線路。
都市區交通系統也高度重視10分鐘的加氫時間,這最大限度地減少了對營運時刻表的延誤。在城際網路中,氫能有望成為夜間快線的動力來源,否則電池組會降低載客量。在自動駕駛班車示範計畫中,為了支援每天20小時不間斷運行,燃料電池的應用日益重要,這進一步凸顯了燃料電池電動巴士市場的性能優勢。
預計到2025年,新公車將交付的71.10%,這反映出原始設備製造商(OEM)專注於最佳化底盤,將油箱整合到車頂線條中,並最大限度地利用占地面積。雖然改裝車輛的規模較小,但改裝套件供應商正幫助營運商改裝相對較新的柴油車輛,而不是過早地將其報廢,從而推動了該行業的快速成長,年複合成長率高達31.97%。資金預算有限的交通管理部門,尤其是在提供購車補貼的地區,將改裝視為實現2030年排放目標的過渡措施。
儘管如此,像 Solaris 和現代這樣的製造商正在將電堆、逆變器和冷卻迴路直接整合到新的車架中,從而降低整車重量並簡化維護。隨著規模經濟的不斷擴大,燃料電池電動巴士市場預計將轉向工廠預裝系統。這是因為,經過五年的運營,工廠預裝系統在全生命週期成本方面更具成本效益。
區域分析
到2025年,亞太地區將佔全球銷售量的43.26%,燃料電池電動巴士市場規模將達4.8億美元。這主要得益於中國基礎設施的快速發展以及韓國的大額訂單。該地區到2031年的複合年成長率將達到30.12%,這得益於新建1200座加氫站、全國範圍內的通行費豁免政策以及涵蓋能源、車輛和零部件價值鏈的綜合產業戰略。北美緊隨其後,複合年成長率將達到27.26%,這主要得益於聯邦政府6.23億美元的撥款以及各州強制要求在2035年前更換車輛的法規。 「太平洋西北氫能中心」等項目正為上游供應鏈帶來10億美元的收入,並降低州際公路沿線城市的燃料交付價格。加拿大的「零排放交通基金」也支持市政試點項目,例如密西沙加市首輛氫燃料汽車的引進。預計歐洲將以23.42%的複合年成長率成長,這主要得益於清潔車輛指令及其區域製造業的優勢。光是德國就計畫在2030年部署3,800輛燃料電池公車,並計畫對加氫站進行大規模聯合投資。中東和非洲地區雖然基數較低,但卻是成長最快的地區,複合年成長率高達30.64%。這主要得益於阿拉伯聯合大公國和沙烏地阿拉伯的永續性計劃,這些計劃正促使大型油氣公司轉型進入氫能出行領域。阿布達比和利雅德的試點部署正在展示燃料電池公車在各種氣候條件下的性能,同時,當地供應鏈也在不斷完善,從而擴大了燃料電池電動公車市場的地域覆蓋範圍。
其他好處:
- Excel格式的市場預測(ME)表
- 3個月的分析師支持
目錄
第1章:引言
- 研究假設和市場定義
- 調查範圍
第2章:調查方法
第3章執行摘要
第4章 市場狀況
- 市場概覽
- 市場促進因素
- 擴大公共運輸車輛零排放法規的適用範圍
- 預計從2025年起,綠色氫氣的價格將大幅下降。
- 政府主導的大宗採購計劃
- 液氫加註通道快速擴張
- 透過OEM平台標準化降低整體擁有成本
- 採用 FCEB 實現長運作週期的自動駕駛接駁車示範專案。
- 市場限制因素
- 具備快速充電能力的電動巴士的競爭
- 灰氫的供應成本仍低於綠氫。
- 維修人員短缺
- 低溫車輛儲存系統需要大量資金投入
- 價值供應鏈分析
- 監理情勢
- 技術展望
- 波特五力分析
第5章 市場規模及成長預測(價值[美元]和數量[單位])
- 透過使用
- 城際
- 在城市裡
- 按公車類型
- 新型氫動力巴士
- 改裝氫動力巴士
- 依燃料電池類型
- 質子交換膜燃料電池(PEMFC)
- 磷酸鹽型(PAFC)
- 固體氧化物燃料電池(SOFC)
- 其他
- 額定功率
- 小於150千瓦
- 150~250 kW
- 超過250千瓦
- 按巴士長度
- 9-12米
- 超過12公尺(可連接型)
- 透過練習場
- 不到300公里
- 300~500 km
- 超過500公里
- 按地區
- 北美洲
- 美國
- 加拿大
- 其他北美國家
- 南美洲
- 巴西
- 阿根廷
- 其他南美國家
- 歐洲
- 德國
- 英國
- 法國
- 義大利
- 西班牙
- 俄羅斯
- 其他歐洲國家
- 亞太地區
- 中國
- 日本
- 印度
- 韓國
- 澳洲
- 其他亞太國家
- 中東和非洲
- 沙烏地阿拉伯
- 阿拉伯聯合大公國
- 土耳其
- 南非
- 其他中東和非洲國家
- 北美洲
第6章 競爭情勢
- 市場集中度
- 策略趨勢
- 市佔率分析
- 公司簡介
- Ballard Power Systems Inc.
- New Flyer Industries
- Toyota Motor Corporation
- Hyundai Motor Company
- Tata Motors Ltd.
- Van Hool NV
- IVECO Group
- SAFRA
- Wrightbus(Bamford Bus Company Holdings Limited)
- CaetanoBus
- Foton International
- Yutong Bus Co., Ltd.
- ZhongTong Bus Holding Co., Ltd.
- CRRC Zhuzhou Electric Co., Ltd.
- Nuvera Fuel Cells LLC
- Nikola Corporation
第7章 市場機會與未來展望
According to Mordor Intelligence, the fuel cell electric bus market size was valued at USD 1.12 billion in 2025 and estimated to grow from USD 1.36 billion in 2026 to reach USD 3.52 billion by 2031, at a CAGR of 21.03% during the forecast period (2026-2031).
This report is Segmented by Application (Intercity and Intracity), Bus Type (New Hydrogen Buses and Retrofitted Hydrogen Buses), Fuel-Cell Type (Proton-Exchange Membrane (PEMFC) and More), Power Rating ( Less Than 150 KW and More), Bus Length (9 - 12 M and Over 12 M), Driving Range (Less Than 300 Km and More), and Geography. The Market Forecasts are Provided in Terms of Value (USD) and Volume (Units).
Global Fuel Cell Electric Bus Market Trends and Insights
Growing Zero-Emission Mandates for Public Transit Fleets
Many transit agencies now face statutory deadlines to eliminate diesel, prompting multi-year framework agreements for hydrogen buses. California requires full zero-emission fleets by 2040, triggering near-term orders under its Innovative Clean Transit rule. European Union's Clean Vehicles Directive pushed zero-emission buses to 49% of new deliveries in 2024, with fuel-cell models already taking 3% of the total. Emerging markets follow a similar path-Abu Dhabi targets a 20% green fleet share by 2030, providing clear procurement visibility for OEMs. Binding mandates, therefore, underpin the long-term demand curve of the fuel cell electric bus market.
Sharp Decline in Green Hydrogen Prices Post-2025
Electrolyzer scale-up and cheaper renewables are expected to cut average production costs to EUR 2.7 per kg by 2050, with Asia projected to hit EUR 1.8 per kg, altering the operating-cost parity versus diesel. China's hydrogen sector nearly doubled revenue to CNY 3.93 billion in 2023, demonstrating the deflationary trajectory of equipment and supply chains. Newly funded hubs such as the Pacific Northwest Hydrogen Hub in the United States add regional cost advantages that lower fuel bills for transit fleets.
Competition From Fast-Charging Battery-Electric Buses
Battery-electric buses outsold diesel in EU city segments for the first time in 2024, buoyed by falling battery costs and abundant depot chargers. The International Energy Agency counted over 70,000 new e-buses worldwide in 2024, a 30% jump from the year. On routes below 200 km daily, TCO modelling still favors batteries, forcing hydrogen proponents to emphasise longer-range and high-utilisation niches.
Other drivers and restraints analyzed in the detailed report include:
- Government-Backed Bulk Procurement Programmes
- Rapid Expansion of Liquid-Hydrogen Refuelling Corridors
- Grey-Hydrogen Supply Still Cheaper Than Green
For complete list of drivers and restraints, kindly check the Table Of Contents.
Segment Analysis
Intracity services generated 63.10% of 2025 revenue, equal to USD 0.71 billion of fuel cell electric bus market size, because city routes favour centralized refueling and predictable duty cycles. Intercity lines, while nascent, promise the steepest 24.74% CAGR as operators exploit hydrogen's 300-500 km sweet spot to avoid en-route charging. The fuel cell electric bus market benefits when depot footprints are tight and grid upgrades for megawatt-scale chargers prove costly. Demonstrations such as Chile's 600 km-range fleet underscore hydrogen's suitability for long-haul corridors.
Urban agencies also appreciate 10-minute refueling that keeps schedule recovery buffers thin. Intercity networks look to hydrogen to power overnight express links where battery packs would erode passenger capacity. Autonomous shuttle pilots increasingly specify fuel cells to support 20-hour daily duty without downtime, sharpening the performance edge for the fuel cell electric bus market.
New bus models represented 71.10% of 2025 deliveries, reflecting OEM focus on optimized chassis that integrate tanks within the roofline and free floor space. Retrofits, although smaller, are sprinting at a 31.97% CAGR as kit providers enable agencies to convert younger diesel stock instead of scrapping it early. Transit authorities with capped capital budgets view conversions as a bridge to 2030 emission targets, especially where policy offers purchase vouchers.
Still, builders like Solaris and Hyundai embed stacks, inverters, and cooling loops directly into new frames, delivering lower curb weight and simpler maintenance. As economies of scale sharpen, the fuel cell electric bus market is expected to pivot toward fresh builds because total lifecycle cost favors factory-integrated systems beyond year five of operation.
Complete Report Scope:
- By Application
- Intercity
- Intracity
- By Bus Type
- New Hydrogen Buses
- Retrofitted Hydrogen Buses
- By Fuel-cell Type
- Proton-Exchange Membrane (PEMFC)
- Phosphoric-Acid (PAFC)
- Solid-Oxide (SOFC)
- Others
- By Power Rating
- Less than 150 kW
- 150 - 250 kW
- Above 250 kW
- By Bus Length
- 9 - 12 metres
- Over 12 metres (articulated)
- By Driving Range
- Less than 300 km
- 300 - 500 km
- Above 500 km
- By Geography
- North America
- United States
- Canada
- Rest of North America
- South America
- Brazil
- Argentina
- Rest of South America
- Europe
- Germany
- United Kingdom
- France
- Italy
- Spain
- Russia
- Rest of Europe
- Asia-Pacific
- China
- Japan
- India
- South Korea
- Australia
- Rest of Asia-Pacific
- Middle East & Africa
- Saudi Arabia
- United Arab Emirates
- Turkey
- South Africa
- Rest of Middle East & Africa
- North America
Geography Analysis
Asia-Pacific commanded 43.26% of global revenue in 2025, equal to USD 0.48 billion of fuel cell electric bus market size, owing to China's infrastructure blitz and Korean bulk orders. The region's 30.12% CAGR to 2031 rests on 1,200 new hydrogen stations, national toll exemptions, and integrated industrial strategies that align energy, vehicle, and component value chains. North America follows, expanding at a 27.26% CAGR on the strength of USD 623 million federal funding and state mandates that force fleet turnovers by 2035. Projects like the Pacific Northwest Hydrogen Hub bring USD 1 billion into the upstream supply, lowering delivered fuel prices for agencies along Interstate corridors. Canada's Zero Emission Transit Fund also kick-starts municipal pilots, evidenced by Mississauga's first hydrogen fleet. Europe shows a 23.42% CAGR outlook, powered by the Clean Vehicles Directive and local manufacturing dominance. Germany alone targets 3,800 fuel-cell buses by 2030 with heavy co-investment in stations. The Middle East & Africa represents the fastest-growing territory at 30.64% CAGR, even if it starts from a lower base, spurred by UAE and Saudi sustainability programs that reposition hydrocarbons majors into hydrogen mobility. Pilot deployments in Abu Dhabi and Riyadh validate climatic performance and seed local supply chains, broadening the geographic reach of the fuel cell electric bus market.
- Ballard Power Systems Inc.
- New Flyer Industries
- Toyota Motor Corporation
- Hyundai Motor Company
- Tata Motors Ltd.
- Van Hool NV
- IVECO Group
- SAFRA
- Wrightbus (Bamford Bus Company Holdings Limited)
- CaetanoBus
- Foton International
- Yutong Bus Co., Ltd.
- ZhongTong Bus Holding Co., Ltd.
- CRRC Zhuzhou Electric Co., Ltd.
- Nuvera Fuel Cells LLC
- Nikola Corporation
Additional Benefits:
- The market estimate (ME) sheet in Excel format
- 3 months of analyst support
TABLE OF CONTENTS
1 Introduction
- 1.1 Study Assumptions & Market Definition
- 1.2 Scope of the Study
2 Research Methodology
3 Executive Summary
4 Market Landscape
- 4.1 Market Overview
- 4.2 Market Drivers
- 4.2.1 Growing Zero-Emission Mandates for Public Transit Fleets
- 4.2.2 Sharp Decline in Green Hydrogen Prices Post-2025
- 4.2.3 Government-Backed Bulk Procurement Programmes
- 4.2.4 Rapid Expansion of Liquid-Hydrogen Refuelling Corridors
- 4.2.5 OEM Platform Standardisation Lowering Total Cost of Ownership
- 4.2.6 Autonomous Shuttle Pilots Selecting FCEBs for Extended Duty Cycles
- 4.3 Market Restraints
- 4.3.1 Competition From Fast-Charging Battery-Electric Buses
- 4.3.2 Grey-Hydrogen Supply Still Cheaper Than Green
- 4.3.3 Under-Developed Maintenance Workforce
- 4.3.4 High Capex for Cryogenic Onboard Storage Systems
- 4.4 Value / Supply-Chain Analysis
- 4.5 Regulatory Landscape
- 4.6 Technological Outlook
- 4.7 Porter's Five Forces Analysis
- 4.7.1 Threat of New Entrants
- 4.7.2 Bargaining Power of Buyers
- 4.7.3 Bargaining Power of Suppliers
- 4.7.4 Threat of Substitutes
- 4.7.5 Intensity of Competitive Rivalry
5 Market Size & Growth Forecasts (Value [USD] and Volume [Units])
- 5.1 By Application
- 5.1.1 Intercity
- 5.1.2 Intracity
- 5.2 By Bus Type
- 5.2.1 New Hydrogen Buses
- 5.2.2 Retrofitted Hydrogen Buses
- 5.3 By Fuel-cell Type
- 5.3.1 Proton-Exchange Membrane (PEMFC)
- 5.3.2 Phosphoric-Acid (PAFC)
- 5.3.3 Solid-Oxide (SOFC)
- 5.3.4 Others
- 5.4 By Power Rating
- 5.4.1 Less than 150 kW
- 5.4.2 150 - 250 kW
- 5.4.3 Above 250 kW
- 5.5 By Bus Length
- 5.5.1 9 - 12 metres
- 5.5.2 Over 12 metres (articulated)
- 5.6 By Driving Range
- 5.6.1 Less than 300 km
- 5.6.2 300 - 500 km
- 5.6.3 Above 500 km
- 5.7 By Geography
- 5.7.1 North America
- 5.7.1.1 United States
- 5.7.1.2 Canada
- 5.7.1.3 Rest of North America
- 5.7.2 South America
- 5.7.2.1 Brazil
- 5.7.2.2 Argentina
- 5.7.2.3 Rest of South America
- 5.7.3 Europe
- 5.7.3.1 Germany
- 5.7.3.2 United Kingdom
- 5.7.3.3 France
- 5.7.3.4 Italy
- 5.7.3.5 Spain
- 5.7.3.6 Russia
- 5.7.3.7 Rest of Europe
- 5.7.4 Asia-Pacific
- 5.7.4.1 China
- 5.7.4.2 Japan
- 5.7.4.3 India
- 5.7.4.4 South Korea
- 5.7.4.5 Australia
- 5.7.4.6 Rest of Asia-Pacific
- 5.7.5 Middle East & Africa
- 5.7.5.1 Saudi Arabia
- 5.7.5.2 United Arab Emirates
- 5.7.5.3 Turkey
- 5.7.5.4 South Africa
- 5.7.5.5 Rest of Middle East & Africa
- 5.7.1 North America
6 Competitive Landscape
- 6.1 Market Concentration
- 6.2 Strategic Moves
- 6.3 Market Share Analysis
- 6.4 Company Profiles (Includes Global Level Overview, Market Level Overview, Core Segments, Financials as Available, Strategic Information, Market Rank/Share for Key Companies, Products & Services, and Recent Developments)
- 6.4.1 Ballard Power Systems Inc.
- 6.4.2 New Flyer Industries
- 6.4.3 Toyota Motor Corporation
- 6.4.4 Hyundai Motor Company
- 6.4.5 Tata Motors Ltd.
- 6.4.6 Van Hool NV
- 6.4.7 IVECO Group
- 6.4.8 SAFRA
- 6.4.9 Wrightbus (Bamford Bus Company Holdings Limited)
- 6.4.10 CaetanoBus
- 6.4.11 Foton International
- 6.4.12 Yutong Bus Co., Ltd.
- 6.4.13 ZhongTong Bus Holding Co., Ltd.
- 6.4.14 CRRC Zhuzhou Electric Co., Ltd.
- 6.4.15 Nuvera Fuel Cells LLC
- 6.4.16 Nikola Corporation
7 Market Opportunities & Future Outlook

 2034年電動巴士和公共交通電氣化市場預測-全球分析(按推進方式、巴士類型、電池類型、馬達類型、充電方式、充電地點、充電基礎設施、應用、最終用戶和地區分類)
 全球電動巴士市場:按應用、電池容量、電池類型、組件、消費者、動力系統架構、車輛總重、巴士長度、自動駕駛水平、功率輸出、推進系統、續航里程、座位數和地區分類-預測至2035年
 燃料電池電動巴士全球市場規模、佔有率、趨勢和成長分析報告(2026-2034)
 亞太地區電動巴士:市場佔有率分析、產業趨勢與統計及成長預測(2026-2031 年)歐洲電動巴士:市場佔有率分析、產業趨勢與統計及成長預測(2026-2031 年)非洲電動巴士:市場佔有率分析、產業趨勢與統計及成長預測(2026-2031 年)
 公共運輸電氣化市場:按組件、應用、電池類型、全球價值鏈 (GVC)、推進系統、國家和地區分類-全球產業分析、市場規模、市場佔有率及2026年至2033年預測
 電動微型巴士市場:2026-2032年全球市場預測(按驅動系統、座位數、續航里程、電池容量、應用和最終用戶分類)電動校車市場:按驅動系統、車身長度、電池容量、校車類型、充電方式和最終用戶分類-2026-2032年全球市場預測電動巴士市場:2026-2032年全球市場預測(按推進系統、電池類型、底盤類型、座位數、續航里程、應用和最終用戶分類)