


 |
市場調查報告書
商品編碼
2115835
非洲電動巴士:市場佔有率分析、產業趨勢與統計及成長預測(2026-2031 年)Africa Electric Bus - Market Share Analysis, Industry Trends & Statistics, Growth Forecasts (2026 - 2031) |
||||||

※ 本網頁內容可能與最新版本有所差異。詳細情況請與我們聯繫。
根據 Mordor Intelligence 預測,非洲電動巴士市場規模預計將從 2025 年的 9,941 萬美元成長到 2026 年的 1.1674 億美元,並將從 2026 年到 2031 年以 17.45% 的複合年成長率成長,到 2031 年達到 2.600 億美元。
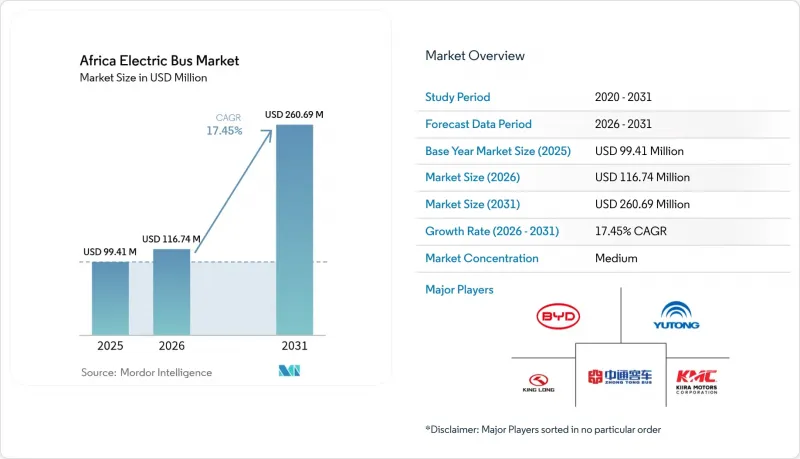
本報告按動力系統(純電動巴士、插電式混合動力巴士)、用戶類型(政府機構、車隊運營商)、巴士長度(小型(9米以下)、標準型(9-14米)、其他)、充電方式(車庫/夜間充電、車載充電/路邊充電)、電池容量(200千瓦時以下、201-400/路邊。市場預測以美元計價。
非洲電動巴士市場趨勢與洞察
電池價格將會下降,到 2027 年將實現總擁有成本與能源價格持平。
2023年全球鋰離子電池組平均價格降至139美元/度數,2024年進一步降至約115美元/度。預計到2026年價格將進一步下降,這將使非洲電動巴士市場的營運成本與柴油巴士趨於持平。 Roam在內羅畢的試點計畫證實,與柴油車相比,電動巴士的維護成本和燃料成本更低。在摩洛哥,以雷諾和Stellantis為中心的供應鏈正在實現電池模組的本地化組裝。同時,埃及1吉瓦的方尖碑太陽能發電園區(配備200兆瓦時的儲能容量)表明,整個非洲大陸對固定式電池系統的認知正在不斷加深。
政府電動公車採購計畫和補貼
肯亞2024年電動車政策草案包括引入綠色車牌和關稅豁免,並估計尚未開發的可再生能源發電能力每天可為7000輛公車提供動力。奈及利亞2024年10月發布的藍圖建議採用總成本合約(GCC)模式,將資本投資風險轉移給私人財團。盧安達已免除國產公車的增值稅(VAT),從而促成了IZI Impala E30的引入。同時,加納對組裝電動車實施了為期八年的進口關稅豁免。
電網容量有限且供電不穩定
南非的電力限制和奈及利亞頻繁的停電迫使營運商安裝備用柴油發電機或推遲擴建計劃,導致營運成本(OPEX)增加。儘管世界銀行斥資16億美元建設的西非區域電力市場計畫旨在2028年建立跨境電網,但大多數公車場站仍需要獨立的微型電網來確保服務穩定。
細分市場分析
預計到2025年,純電動公車將佔82.48%的市場佔有率,年複合成長率達20.98%。這一主導地位歸功於其動力系統結構簡單以及鋰離子電池組價格的快速下降。比亞迪在開普敦的車隊已證明,與同等柴油線路相比,其營運成本顯著降低,進一步凸顯了純電動公車的經濟優勢。
剩餘的市場佔有率由插電式混合動力車佔據,主要用於長途線路和電網受限的線路,但隨著能量密度的提高和太陽能充電基礎設施的普及,其重要性預計將會下降。市政當局更傾向於採用純電動車平台,以最大限度地改善空氣品質並簡化維護。政策支持,例如肯亞免徵消費稅,進一步提高了新競標中對零排放汽車的偏好。
公共採購架構促進了電網電氣化進程,預計到2025年,政府機構的需求將佔總需求的61.55%。阿布加的100輛試點計畫以及亞的斯亞貝巴進口4800輛公車的計劃,都清晰地展現了規模經濟效益。私人車輛業者也迅速縮小差距,隨著資產融資機構將車輛、充電樁和排碳權的收入納入基於里程的收費契約,預計到2031年,這一領域將以每年17.84%的速度成長。
像Roam這樣的早期採用者已經證明,透過最佳化營運週期、實施動態定價以及外包車庫能源管理,他們能夠從第一年就實現正現金流。因此,預計到2030年,私營部門在非洲電動巴士市場的佔有率將顯著成長。
其他好處:
- Excel格式的市場預測(ME)表
- 3個月的分析師支持
目錄
第1章:引言
- 研究假設和市場定義
- 調查範圍
第2章:調查方法
第3章執行摘要
第4章 市場狀況
- 市場概覽
- 市場促進因素
- 電池價格將會下降,到 2027 年將實現總擁有成本與能源價格持平。
- 政府採購計畫和對電動巴士的補貼
- 中國OEM CKD組裝廠在非洲快速擴張
- 利用離網和微電網的太陽能充電站的出現。
- 日益惡化的空氣品質導致了對清潔城市交通需求的成長。
- 第六條排碳權在市場中的貨幣化,適用於車隊營運商
- 市場限制因素
- 電網容量限制和電力供應不穩定
- 新冠疫情後,地方政府面臨高昂的初期成本和預算限制。
- 該地區缺乏電池回收基礎設施
- 熟練的電動車維修人員短缺
- 價值供應鏈分析
- 監理情勢
- 技術展望
- 波特五力模型
第5章 市場規模與成長預測
- 透過推進方法
- 電池驅動的電動巴士
- 插電式混合動力電動巴士
- 依使用者類型
- 政府機構
- 車隊營運商
- 按總長度排列的巴士
- 小型(小於 9 公尺)
- 標準(9-14米)
- 鉸接式巴士(14公尺或更長)
- 透過充電方法
- 車庫/夜間充電
- 車載充電/行駛中充電
- 按電池容量
- 200度或以下
- 201~400 kWh
- 超過400度
- 國家
- 南非
- 摩洛哥
- 埃及
- 其他非洲國家
第6章 競爭情勢
- 市場集中度
- 策略趨勢
- 市佔率分析
- 公司簡介
- Kiira Motors Corporation
- Zhongtong Bus Holding Co., Ltd
- Zhengzhou Yutong Bus Co., Ltd.
- King Long United Automotive Industry Co., Ltd
- BYD Auto Co., Ltd.
- Volvo Group
- Scania AB
- Tata Motors Limited
- Ashok Leyland Ltd(Switch Mobility)
- Ankai Automobile Co., Ltd.
- Higer Bus Company Limited
- Foton Motor Group
- Roam Electric Ltd.
- IZI Electric
第7章 市場機會與未來趨勢
According to Mordor Intelligence, the Africa electric bus market size is expected to grow from USD 99.41 million in 2025 to USD 116.74 million in 2026 and is forecast to reach USD 260.69 million by 2031 at 17.45% CAGR over 2026-2031.
This report is Segmented by Propulsion Type (Battery Electric, Plug-In Hybrid Electric), Consumer Type (Government, Fleet Operators), Bus Length (Mini (Below 9m), Standard (9-14m), and More), Charging Mode (Depot/Overnight Charging, Opportunity/In-Route Charging), Battery Capacity (<=200 KWh, 201-400 KWh, and More), and Country. The Market Forecasts are Provided in Terms of Value (USD).
Africa Electric Bus Market Trends and Insights
Falling Battery Prices and TCO Parity By 2027
Global average Li-ion battery pack prices fell to USD 139/kWh in 2023 and further to ~USD 115/kWh in 2024 and are forecast to reduce further by 2026, pushing the Africa electric bus market toward operating-cost parity with diesel buses . Roam's Nairobi pilots show maintenance costs falling and fuel savings rising versus diesel fleets. Morocco's Renault- and Stellantis-anchored supply chain positions the country to localize battery module assembly, while Egypt's 1 GW Obelisk solar park with 200 MWh of storage signals continent-wide familiarity with stationary battery systems.
Government E-Bus Procurement Programs and Subsidies
Kenya's 2024 Electric Mobility Draft Policy introduces green number plates, duty exemptions, and estimates that dormant renewable capacity could power 7,000 buses daily . Nigeria's October 2024 roadmap prefers Gross-Cost-Contract structures that shift capex risk to private consortia. Rwanda waived VAT on locally built buses, enabling IZI's Impala E30 roll-out, while Ghana grants eight-year import-duty holidays for assembled EVs.
Limited Grid Capacity and Unreliable Power Supply
Load-shedding in South Africa and frequent blackouts in Nigeria force operators to install backup diesel gensets or delay expansion, raising opex. The World Bank's USD 1.6 billion West Africa Regional Electricity Market Program will add cross-border transmission by 2028, yet most depots still require islanded microgrids to guarantee service.
Other drivers and restraints analyzed in the detailed report include:
- Rapid Expansion of Chinese OEM CKD Assembly Plants in Africa
- Emergence of Solar-Powered Depot Charging Using Off-Grid Microgrids
- High Upfront Cost and Constrained Municipal Budgets Post-COVID
For complete list of drivers and restraints, kindly check the Table Of Contents.
Segment Analysis
Battery electric buses held 82.48% market share in 2025, and the segment is forecast to grow at a 20.98% CAGR. This dominance is rooted in lower drivetrain complexity and the accelerating decline in lithium-ion pack prices. BYD's Cape Town fleet has already cut operating costs significantly compared with equivalent diesel routes, underscoring the economic pull.
Plug-in hybrids account for the residual share, mainly in long-distance or grid-constrained corridors, yet their relevance is expected to wane as energy-density improves and solar-charged depots proliferate. Municipalities gravitate toward pure battery platforms to maximize air-quality gains and simplify maintenance. Policy support-such as Kenya's excise duty exemptions-further tilts new tenders toward zero-emission fleets.
Government agencies commanded 61.55% of 2025 demand as public procurement frameworks kickstarted network electrification. Abuja's 100-unit pilot and Addis Ababa's 4,800-bus import plan showcase scale benefits. Private fleet operators are quickly closing the gap; the segment is projected to grow 17.84% annually through 2031 as asset financiers bundle vehicles, chargers, and carbon-credit revenues into pay-per-kilometer contracts.
Early adopters such as Roam demonstrate that optimized duty cycles, dynamic pricing, and outsourcing of depot energy management can yield positive cash flow from year one. As a result, the Africa electric bus market share attributable to private operators is expected to climb significantly by 2030.
Complete Report Scope:
- By Propulsion Type
- Battery Electric
- Plug-In Hybrid Electric
- By Consumer Type
- Government
- Fleet Operators
- By Bus Length
- Mini (Below 9 m)
- Standard (9-14 m)
- Articulated (Above 14 m)
- By Charging Mode
- Depot / Overnight Charging
- Opportunity / In-Route Charging
- By Battery Capacity
- <=200 kWh
- 201-400 kWh
- Above 400 kWh
- By Country
- South Africa
- Morocco
- Egypt
- Rest of Africa
List of Companies Covered in this Report:
- Kiira Motors Corporation
- Zhongtong Bus Holding Co., Ltd
- Zhengzhou Yutong Bus Co., Ltd.
- King Long United Automotive Industry Co., Ltd
- BYD Auto Co., Ltd.
- Volvo Group
- Scania AB
- Tata Motors Limited
- Ashok Leyland Ltd (Switch Mobility)
- Ankai Automobile Co., Ltd.
- Higer Bus Company Limited
- Foton Motor Group
- Roam Electric Ltd.
- IZI Electric
Additional Benefits:
- The market estimate (ME) sheet in Excel format
- 3 months of analyst support
TABLE OF CONTENTS
1 Introduction
- 1.1 Study Assumptions & Market Definition
- 1.2 Scope of the Study
2 Research Methodology
3 Executive Summary
4 Market Landscape
- 4.1 Market Overview
- 4.2 Market Drivers
- 4.2.1 Falling Battery Prices and TCO Parity By 2027
- 4.2.2 Government E-Bus Procurement Programs and Subsidies
- 4.2.3 Rapid Expansion of Chinese OEM CKD Assembly Plants in Africa
- 4.2.4 Emergence of Solar-Powered Depot Charging Using Off-Grid Microgrids
- 4.2.5 Rising Demand for Clean Urban Transport Amid Deteriorating Air Quality
- 4.2.6 Carbon-Credit Monetization for Fleet Operators Under Article 6 Markets
- 4.3 Market Restraints
- 4.3.1 Limited Grid Capacity and Unreliable Power Supply
- 4.3.2 High Upfront Cost and Constrained Municipal Budgets Post-COVID
- 4.3.3 Lack of Regional Battery Recycling Infrastructure
- 4.3.4 Scarcity of Skilled EV Maintenance Workforce
- 4.4 Value / Supply-Chain Analysis
- 4.5 Regulatory Landscape
- 4.6 Technological Outlook
- 4.7 Porter's Five Forces
- 4.7.1 Threat of New Entrants
- 4.7.2 Bargaining Power of Buyers/Consumers
- 4.7.3 Bargaining Power of Suppliers
- 4.7.4 Threat of Substitute Products
- 4.7.5 Intensity of Competitive Rivalry
5 Market Size & Growth Forecasts (Value, USD)
- 5.1 By Propulsion Type
- 5.1.1 Battery Electric
- 5.1.2 Plug-In Hybrid Electric
- 5.2 By Consumer Type
- 5.2.1 Government
- 5.2.2 Fleet Operators
- 5.3 By Bus Length
- 5.3.1 Mini (Below 9 m)
- 5.3.2 Standard (9-14 m)
- 5.3.3 Articulated (Above 14 m)
- 5.4 By Charging Mode
- 5.4.1 Depot / Overnight Charging
- 5.4.2 Opportunity / In-Route Charging
- 5.5 By Battery Capacity
- 5.5.1 <=200 kWh
- 5.5.2 201-400 kWh
- 5.5.3 Above 400 kWh
- 5.6 By Country
- 5.6.1 South Africa
- 5.6.2 Morocco
- 5.6.3 Egypt
- 5.6.4 Rest of Africa
6 Competitive Landscape
- 6.1 Market Concentration
- 6.2 Strategic Moves
- 6.3 Market Share Analysis
- 6.4 Company Profiles (includes Global Level Overview, Market Level Overview, Core Segments, Financials as Available, Strategic Information, Market Rank/Share for Key Companies, Products and Services, SWOT Analysis, and Recent Developments)
- 6.4.1 Kiira Motors Corporation
- 6.4.2 Zhongtong Bus Holding Co., Ltd
- 6.4.3 Zhengzhou Yutong Bus Co., Ltd.
- 6.4.4 King Long United Automotive Industry Co., Ltd
- 6.4.5 BYD Auto Co., Ltd.
- 6.4.6 Volvo Group
- 6.4.7 Scania AB
- 6.4.8 Tata Motors Limited
- 6.4.9 Ashok Leyland Ltd (Switch Mobility)
- 6.4.10 Ankai Automobile Co., Ltd.
- 6.4.11 Higer Bus Company Limited
- 6.4.12 Foton Motor Group
- 6.4.13 Roam Electric Ltd.
- 6.4.14 IZI Electric
7 Market Opportunities & Future Trends

 2034年電動巴士和公共交通電氣化市場預測-全球分析(按推進方式、巴士類型、電池類型、馬達類型、充電方式、充電地點、充電基礎設施、應用、最終用戶和地區分類)
 全球電動巴士市場:按應用、電池容量、電池類型、組件、消費者、動力系統架構、車輛總重、巴士長度、自動駕駛水平、功率輸出、推進系統、續航里程、座位數和地區分類-預測至2035年
 燃料電池電動巴士全球市場規模、佔有率、趨勢和成長分析報告(2026-2034)
 燃料電池電動巴士:市場佔有率分析、產業趨勢與統計及成長預測(2026-2031)亞太地區電動巴士:市場佔有率分析、產業趨勢與統計及成長預測(2026-2031 年)歐洲電動巴士:市場佔有率分析、產業趨勢與統計及成長預測(2026-2031 年)
 公共運輸電氣化市場:按組件、應用、電池類型、全球價值鏈 (GVC)、推進系統、國家和地區分類-全球產業分析、市場規模、市場佔有率及2026年至2033年預測
 電動微型巴士市場:2026-2032年全球市場預測(按驅動系統、座位數、續航里程、電池容量、應用和最終用戶分類)電動校車市場:按驅動系統、車身長度、電池容量、校車類型、充電方式和最終用戶分類-2026-2032年全球市場預測電動巴士市場:2026-2032年全球市場預測(按推進系統、電池類型、底盤類型、座位數、續航里程、應用和最終用戶分類)