


 |
市場調查報告書
商品編碼
2115057
亞太地區電動巴士:市場佔有率分析、產業趨勢與統計及成長預測(2026-2031 年)Asia Pacific Electric Bus - Market Share Analysis, Industry Trends & Statistics, Growth Forecasts (2026 - 2031) |
||||||

※ 本網頁內容可能與最新版本有所差異。詳細情況請與我們聯繫。
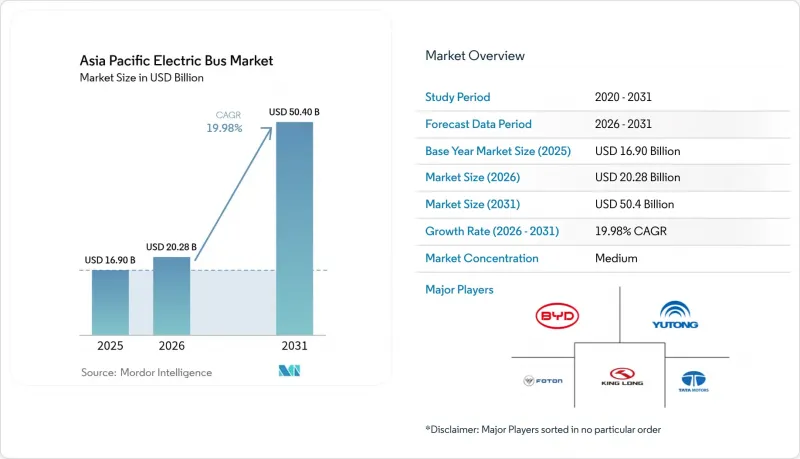
據 Mordor Intelligence 稱,亞太地區電動巴士市場在 2025 年的價值為 169 億美元,預計到 2031 年將達到 504 億美元,而 2026 年為 202.8 億美元,預測期(2026-2031 年)的複合年成長率為 19.98%。
本報告按動力類型(純電動公車、混合動力公車等)、車身長度(9米以下、9-14米、其他)、應用領域(城際、市內、其他)、最終用戶(公共交通運營商和私家車運營商)以及國家/地區(中國、印度、其他國家/地區)進行細分。市場預測以價值(美元)和銷售(輛)為單位呈現。
亞太地區電動巴士市場趨勢及洞察。
中國和印度推出一系列重大採購補貼政策更新。
同步延長的補貼政策創造了穩定的需求,積壓訂單也支撐了這一需求,從而為大規模生產和零件供應合約的收緊提供了依據。北京在其公車採購激勵計劃中規定的70%在地採購限制保護了國內供應商,而印度550億盧比(約合6.6億美元)的預算撥款則引導各邦政府競標多年車輛採購計劃。在兩項計劃延期後的幾週內,製造商就獲得了大量訂單,穩定了工廠的產運轉率,並朝著在無需長期財政支持的情況下實現與柴油車隊成本持平的目標邁進。
磷酸鐵鋰電池組的價格降至每千瓦時 100 美元以下,在總擁有成本 (TCO) 方面實現了成本持平。
2024年,受中國工廠產能提升的推動,磷酸鋰鐵(LFP)電池組價格大幅下降。這項突破性進展使製造商能夠將固定成本分攤到更高的產量上,從而提高了技術的成本效益。成本的降低顯著縮短了標準城市路線的投資回收期,即使沒有補貼,購買電動車也變得經濟可行。此外,成本可預測性的提高使得租賃公司能夠提供基於里程的契約,從而降低了財政緊張的市政當局面臨的電池性能風險。預計東南亞地區的消費者將從這一趨勢中受益最多。
受疫情影響,票價收入下降,地方政府面臨財政困境。
與疫情前水準相比,地方政府預算面臨嚴重的收入缺口,對財政穩定構成挑戰。持續的預算缺口限制了信貸管道的獲取,並延誤了車輛更換的競標,而車輛更換本應優先考慮引入電動公車。在孟買,BEST公司面臨巨額財務虧損,儘管有明確證據顯示營運成本有望降低,但該公司仍被迫大幅削減採購計畫。同樣,由於疫情導致的虧損,曼谷的交通部門也面臨類似的削減,因為難以獲得額外的貸款。
細分市場分析
到2025年,純電動公車(BEB)的交付將佔總量的78.62%,其成熟的車庫充電生態系統非常適合高密度城市環路運作。這一佔有率在亞太地區電動公車市場中位居榜首,凸顯了磷酸鋰鐵鋰(LFP)電池和低地板底盤設計非常適合短程營運。高功率車庫充電器、能源價格套利以及更短的投資回收期進一步提升了純電動公車的經濟性。然而,與新興的燃料電池電動公車相比,純電動公車的成長速度正在放緩,因為城際線路氫燃料加註成本的日益競爭正在逐漸削弱純電動公車的成長優勢。
借助日本和韓國的氫能發展藍圖(目標在2030年前建成900座加氫站),燃料電池電動公車預計將實現27.88%的複合年成長率。路線模擬顯示,當日行駛里程超過400公里時,燃料電池電動公車在按里程加權成本方面優於純電池公車。目前,汽車製造商正在將氫氣供應合約納入公車契約,以緩解營運商對價格波動的擔憂。同時,在泰國和馬來西亞,由於分階段電氣化將資本成本分攤到更長的時期,混合動力汽車和插電式混合動力汽車仍然佔據主導地位。
預計到2025年,9-14米級電動巴士將佔總出貨量的56.71%,並已被證實是兼顧移動性、乘客密度和總擁有成本(TCO)的最佳細分市場。憑藉其優勢,該細分市場已成為亞太地區電動巴士市場中規模最大的子細分市場,來自上海、雅加達和德里的重複訂單也為其全生命週期經濟性提供了有力支撐。 OEM平台在保持通道佈局的同時,將350-450kWh的電池組整合到低地板設計中。
預計到2031年,長度超過14公尺的公車將以21.65%的複合年成長率成長,這主要得益於營運商降低駕駛人人事費用和整合線路網路。在首爾和香港,雙層巴士和鉸接式巴士已投入使用,以緩解高峰時段的交通堵塞;台灣沿海高速公路也正在引入換電式巴士。 9公尺以下的微型巴士目前仍屬於小眾市場,但在校園、機場和接駁服務方面的需求正在成長。
其他好處:
- Excel格式的市場預測(ME)表
- 3個月的分析師支持
目錄
第1章:引言
- 研究假設和市場定義
- 調查範圍
第2章:調查方法
第3章執行摘要
第4章 市場狀況
- 市場概覽
- 市場促進因素
- 中國和印度推出一系列重大採購補貼政策更新。
- 磷酸鋰鐵(LFP) 電池組的價格已降至每千瓦時 100 美元以下,在總擁有成本 (TCO) 方面實現了平價。
- 各國強制推行零排放車輛(例如,新加坡2040年,韓國2030年)
- 專為交通運輸企業設計的綠色債券資金籌措模式。
- 用於電池電動公車 (BEB) 車庫充電的負載管理軟體可減少電網升級所需的資本支出 (CAPEX)。
- 在地採購獎勵正在推動東協地區組裝中心的建立。
- 市場限制因素
- 受疫情影響,票價收入下降,地方政府面臨財政困境。
- 印度和東協二、三線城市1兆瓦以下裝置容量的倉庫連接存在瓶頸
- 電池芯供應過剩對供應商的利潤率帶來壓力,並增加了故障風險。
- 對崎嶇城際航線持續續航力的擔憂。
- 價值供應鏈分析
- 監理情勢
- 技術展望
- 波特五力模型
第5章 市場規模及成長預測(價值:美元,數量:單位)
- 依推進類型
- 電池驅動電動巴士(BEB)
- 混合動力電動巴士(HEB)
- 插電式混合動力電動巴士(PHEB)
- 燃料電池電動巴士(FCEB)
- 按總長度排列的巴士
- 不足900萬
- 9~14 M
- 1400萬或更多
- 透過使用
- 城際
- 城市
- 機場接駁車
- 校車
- 最終用戶
- 大眾運輸
- 私家車營運商
- 國家
- 中國
- 印度
- 日本
- 韓國
- 其他亞太國家
第6章 競爭情勢
- 市場集中度
- 策略趨勢
- 市佔率分析
- 公司簡介
- BYD Company Ltd.
- Zhengzhou Yutong Bus Co., Ltd.
- CRRC Electric Vehicle Co., Ltd.
- Xiamen King Long Motor Group Co., Ltd.
- Zhongtong Bus Holding Co., Ltd.
- Beijing Foton AUV Bus Co., Ltd.
- Anhui Ankai Automobile Co., Ltd.
- Higer Bus Company Limited
- Skywell New Energy Automobile Group
- Shanghai Sunwin Bus Corporation
- Tata Motors Limited
- Ashok Leyland Limited
- Olectra Greentech Limited
- JBM Group
- Hyundai Motor Company
- Mitsubishi Fuso Truck and Bus Corporation
- Isuzu Motors Limited
- NFI Group(Alexander Dennis Limited)
- Volvo Buses
第7章 市場機會與未來展望
According to Mordor Intelligence, the Asia Pacific electric bus market size was valued at USD 16.90 billion in 2025 and estimated to grow from USD 20.28 billion in 2026 to reach USD 50.4 billion by 2031, at a CAGR of 19.98% during the forecast period (2026-2031).
This report is Segmented by Propulsion Type (Battery Electric Bus, Hybrid Electric Bus, and More), Bus Length (Below 9 M, 9-14 M, and More), Application (Inter-City, Intra-City, and More), End-User (Public Transport Authorities and Private Fleet Operators), and Country (China, India, and More). The Market Forecasts are Provided in Terms of Value (USD) and Volume (Units).
Asia Pacific Electric Bus Market Trends and Insights
Mainstream Purchase-Subsidy Renewal Waves in China and India
Synchronizing subsidy extensions has generated steady backlog-driven demand that justifies large production runs and tightens component supply contracts. Beijing's bus incentive with 70% local-content rules protects domestic suppliers, while India's INR 5,500 crore (USD 660 million) allocation channels state tenders into multi-year fleet plans. Manufacturers secured a significant number of orders within weeks of both programs' renewal, locking in factory utilization rates and advancing cost parity against diesel fleets without perpetual fiscal support.
Falling LFP Battery-Pack Prices Below USD 100 kWh Enabling TCO Parity
In 2024, lithium-iron-phosphate (LFP) pack prices experienced a significant decline, driven by the increased production capacity of Chinese plants. This milestone allowed manufacturers to distribute fixed costs over larger volumes, making the technology more cost-effective. The reduced costs have notably shortened payback periods for standard urban routes, making electric vehicle purchases more financially viable even without subsidies. Additionally, improved cost predictability has enabled leasing firms to offer mileage-indexed contracts, mitigating battery-performance risks for financially constrained agencies. Southeast Asian buyers are expected to benefit the most from this development.
Municipal Balance-Sheet Constraints After Pandemic Fare Losses
Municipal ledgers are struggling with significant revenue shortfalls compared to pre-pandemic levels, creating challenges for financial stability. These ongoing gaps are restricting access to credit lines and delaying fleet-replacement tenders, which would otherwise prioritize the adoption of electric buses. In Mumbai, BEST is facing considerable financial losses, which have forced a substantial reduction in its procurement plans, even though there is clear evidence of potential savings in operating costs. Similarly, Bangkok's transit agency has been compelled to make similar cutbacks, citing financial deficits stemming from the pandemic that have limited its ability to secure additional borrowing.
Other drivers and restraints analyzed in the detailed report include:
- National Zero-Emission Fleet Mandates (e.g., Singapore 2040, S-Korea 2030)
- Dedicated Green-Bond Financing Models for Transit Agencies
- Sub-MW Depot Connection Bottlenecks in Tier-2/3 Indian and ASEAN Cities
For complete list of drivers and restraints, kindly check the Table Of Contents.
Segment Analysis
Battery electric buses (BEBs) account for 78.62% of 2025 deliveries, offering proven depot-charging ecosystems that fit dense urban loops. This slice translates to the largest Asia Pacific electric bus market share, underscoring how LFP chemistry and low-floor chassis designs align with short-haul scheduling. High-power depot chargers, energy-price arbitrage, and shorter payback windows reinforce BEB economics. Yet the segment's growth is decelerating compared with emerging fuel-cell electric buses, whose hydrogen refueling parity on inter-city routes is eroding BEB's growth lead.
Fuel-cell electric buses notch a projected 27.88% CAGR by leveraging Japan and South Korea's hydrogen roadmaps, which include 900 refueling stations by 2030 . Route modeling shows FCEBs outperform batteries on distance-weighted cost when daily mileage exceeds 400 km. OEMs now bundle hydrogen supply agreements into bus contracts, easing operator fears over price volatility. Meanwhile, hybrid and plug-in hybrid variants persist in Thailand and Malaysia, where phased electrification spreads capital cost over longer cycles.
The 9-14 meter class holds 56.71% of 2025 shipments, confirming its sweet spot for maneuverability, passenger density, and TCO. Its prominence also yields the largest Asia Pacific electric bus market size sub-segment, with repeat orders from Shanghai, Jakarta, and Delhi validating lifecycle economics. OEM platforms integrate 350-450 kWh packs under low-floor designs, keeping aisle layouts intact.
Buses above 14 meters are projected to expand 21.65% CAGR through 2031 as operators target driver labor savings and network consolidation. Double-deck and articulated formats address peak-hour crowding in Seoul and Hong Kong, while battery-swap variants are entering Taiwan's coastal express lines. Sub-9-meter minibuses remain niche but gain traction in campus, airport, and feeder services.
Complete Report Scope:
- By Propulsion Type
- Battery Electric Bus (BEB)
- Hybrid Electric Bus (HEB)
- Plug-in Hybrid Electric Bus (PHEB)
- Fuel-Cell Electric Bus (FCEB)
- By Bus Length
- Below 9 M
- 9 - 14 M
- Above 14 M
- By Application
- Inter-city
- Intra-city
- Airport Shuttle
- School Transport
- By End-User
- Public Transport Authorities
- Private Fleet Operators
- By Country
- China
- India
- Japan
- South Korea
- Rest of Asia-Pacific
List of Companies Covered in this Report:
- BYD Company Ltd.
- Zhengzhou Yutong Bus Co., Ltd.
- CRRC Electric Vehicle Co., Ltd.
- Xiamen King Long Motor Group Co., Ltd.
- Zhongtong Bus Holding Co., Ltd.
- Beijing Foton AUV Bus Co., Ltd.
- Anhui Ankai Automobile Co., Ltd.
- Higer Bus Company Limited
- Skywell New Energy Automobile Group
- Shanghai Sunwin Bus Corporation
- Tata Motors Limited
- Ashok Leyland Limited
- Olectra Greentech Limited
- JBM Group
- Hyundai Motor Company
- Mitsubishi Fuso Truck and Bus Corporation
- Isuzu Motors Limited
- NFI Group (Alexander Dennis Limited)
- Volvo Buses
Additional Benefits:
- The market estimate (ME) sheet in Excel format
- 3 months of analyst support
TABLE OF CONTENTS
1 Introduction
- 1.1 Study Assumptions and Market Definition
- 1.2 Scope of the Study
2 Research Methodology
3 Executive Summary
4 Market Landscape
- 4.1 Market Overview
- 4.2 Market Drivers
- 4.2.1 Mainstream Purchase-Subsidy Renewal Waves in China and India
- 4.2.2 Falling Lithium Iron Phosphate (LFP) Battery-Pack Prices Below USD 100 kWh Enabling Total Cost of Ownership (TCO) Parity
- 4.2.3 National Zero-Emission Fleet Mandates (e.g., Singapore 2040, S-Korea 2030)
- 4.2.4 Dedicated Green-Bond Financing Models for Transit Agencies
- 4.2.5 Battery Electric Bus (BEB) Depot-Charging Load-Management Software Reduces Grid-Upgrade CAPEX
- 4.2.6 Local-Content Incentives Spawning ASEAN Assembly Hubs
- 4.3 Market Restraints
- 4.3.1 Municipal Balance-Sheet Constraints After Pandemic Fare Losses
- 4.3.2 Sub-MW Depot Connection Bottlenecks in Tier-2/3 Indian and ASEAN Cities
- 4.3.3 Excess Battery-Cell Capacity Compressing Supplier Margins and Raising Failure Risk
- 4.3.4 Persistent Range-Anxiety on Hilly Inter-City Routes
- 4.4 Value / Supply-Chain Analysis
- 4.5 Regulatory Landscape
- 4.6 Technological Outlook
- 4.7 Porter's Five Forces
- 4.7.1 Threat of New Entrants
- 4.7.2 Bargaining Power of Suppliers
- 4.7.3 Bargaining Power of Buyers
- 4.7.4 Threat of Substitutes
- 4.7.5 Competitive Rivalry
5 Market Size and Growth Forecasts (Value in USD and Volume in Units)
- 5.1 By Propulsion Type
- 5.1.1 Battery Electric Bus (BEB)
- 5.1.2 Hybrid Electric Bus (HEB)
- 5.1.3 Plug-in Hybrid Electric Bus (PHEB)
- 5.1.4 Fuel-Cell Electric Bus (FCEB)
- 5.2 By Bus Length
- 5.2.1 Below 9 M
- 5.2.2 9 - 14 M
- 5.2.3 Above 14 M
- 5.3 By Application
- 5.3.1 Inter-city
- 5.3.2 Intra-city
- 5.3.3 Airport Shuttle
- 5.3.4 School Transport
- 5.4 By End-User
- 5.4.1 Public Transport Authorities
- 5.4.2 Private Fleet Operators
- 5.5 By Country
- 5.5.1 China
- 5.5.2 India
- 5.5.3 Japan
- 5.5.4 South Korea
- 5.5.5 Rest of Asia-Pacific
6 Competitive Landscape
- 6.1 Market Concentration
- 6.2 Strategic Moves
- 6.3 Market Share Analysis
- 6.4 Company Profiles (Includes Global Level Overview, Market Level Overview, Core Segments, Financials as Available, Strategic Information, Market Rank/Share for Key Companies, Products and Services, SWOT Analysis, and Recent Developments)
- 6.4.1 BYD Company Ltd.
- 6.4.2 Zhengzhou Yutong Bus Co., Ltd.
- 6.4.3 CRRC Electric Vehicle Co., Ltd.
- 6.4.4 Xiamen King Long Motor Group Co., Ltd.
- 6.4.5 Zhongtong Bus Holding Co., Ltd.
- 6.4.6 Beijing Foton AUV Bus Co., Ltd.
- 6.4.7 Anhui Ankai Automobile Co., Ltd.
- 6.4.8 Higer Bus Company Limited
- 6.4.9 Skywell New Energy Automobile Group
- 6.4.10 Shanghai Sunwin Bus Corporation
- 6.4.11 Tata Motors Limited
- 6.4.12 Ashok Leyland Limited
- 6.4.13 Olectra Greentech Limited
- 6.4.14 JBM Group
- 6.4.15 Hyundai Motor Company
- 6.4.16 Mitsubishi Fuso Truck and Bus Corporation
- 6.4.17 Isuzu Motors Limited
- 6.4.18 NFI Group (Alexander Dennis Limited)
- 6.4.19 Volvo Buses
7 Market Opportunities & Future Outlook
- 7.1 White-space & Unmet-Need Assessment

 2034年電動巴士和公共交通電氣化市場預測-全球分析(按推進方式、巴士類型、電池類型、馬達類型、充電方式、充電地點、充電基礎設施、應用、最終用戶和地區分類)
 全球電動巴士市場:按應用、電池容量、電池類型、組件、消費者、動力系統架構、車輛總重、巴士長度、自動駕駛水平、功率輸出、推進系統、續航里程、座位數和地區分類-預測至2035年
 燃料電池電動巴士全球市場規模、佔有率、趨勢和成長分析報告(2026-2034)
 燃料電池電動巴士:市場佔有率分析、產業趨勢與統計及成長預測(2026-2031)歐洲電動巴士:市場佔有率分析、產業趨勢與統計及成長預測(2026-2031 年)非洲電動巴士:市場佔有率分析、產業趨勢與統計及成長預測(2026-2031 年)
 公共運輸電氣化市場:按組件、應用、電池類型、全球價值鏈 (GVC)、推進系統、國家和地區分類-全球產業分析、市場規模、市場佔有率及2026年至2033年預測
 電動微型巴士市場:2026-2032年全球市場預測(按驅動系統、座位數、續航里程、電池容量、應用和最終用戶分類)電動校車市場:按驅動系統、車身長度、電池容量、校車類型、充電方式和最終用戶分類-2026-2032年全球市場預測電動巴士市場:2026-2032年全球市場預測(按推進系統、電池類型、底盤類型、座位數、續航里程、應用和最終用戶分類)