


 |
市場調查報告書
商品編碼
2113894
風力發電機:市場佔有率分析、行業趨勢和統計數據、成長預測(2026-2031 年)Wind Turbine - Market Share Analysis, Industry Trends & Statistics, Growth Forecasts (2026 - 2031) |
||||||

※ 本網頁內容可能與最新版本有所差異。詳細情況請與我們聯繫。
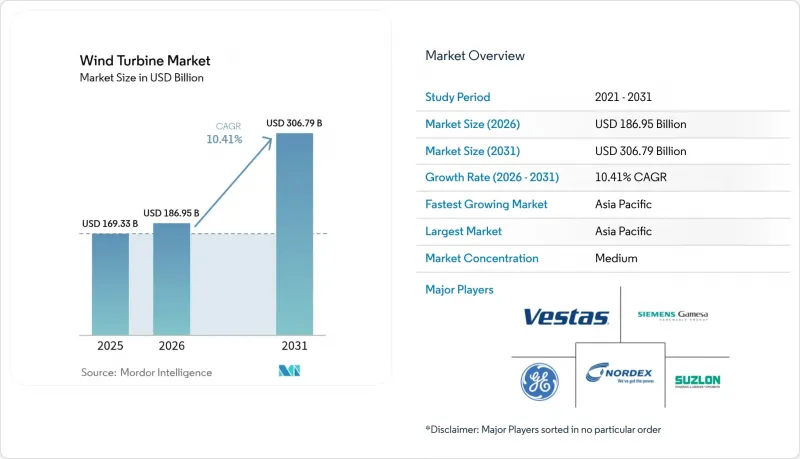
據 Mordor Intelligence 稱,2025 年風力發電機市場價值 1,693.3 億美元,預計到 2031 年將達到 3067.9 億美元,而 2026 年為 1869.5 億美元,預測期(2026-2031 年)複合年成長率為 10.41%。
本報告按部署地點(陸上、海上)、額定容量(小規模、中型、大型、超大型)、軸類型(水平、垂直)、組件(葉輪、機艙/傳動系統、發電機、塔架、電力電子/控制)、最終用途(公用事業規模、商業/工業、住宅/微電網)和地區(亞太地區、其他地區)進行分類。
全球風力發電機市場趨勢及洞察
提高各國可再生能源目標
歐盟目前規定,到2030年,可再生能源發電量必須佔總發電量的42.5%,西班牙的目標是81%,希臘也設定了類似的目標。印度在2024年新增了3.4吉瓦的風電裝置容量,這是其實現500吉瓦非化石能源目標的一部分。英國的「清潔電力2030」計畫旨在使95%的電力生產實現脫碳,並取消了對傳統陸上風電的監管。這些框架透過上網電價補貼(FIT)、認證機制和競標競標來保障獲利能力,加速風力發電機市場的成長。長期措施的確定性也促進了國內製造業的發展和供應鏈的本地化。
陸上和離岸風力發電的平準化度電成本快速下降
沙烏地阿拉伯最近競標以每兆瓦時15美元的價格中標,凸顯了陸上風電成本的大幅下降。離岸風電也呈現類似的趨勢,隨著轉子直徑超過180公尺的風力渦輪機逐漸成為標準配置,預計到2050年,浮動式風力發電的成本將達到每兆瓦時40歐元。到2024年,風力渦輪機的平均額定輸出功率將達到5,500千瓦,進而降低基礎建設成本。連續式基礎、模組化變電站的製造以及綠色債券資金籌措等方式進一步降低了單位成本。這些趨勢正在鞏固風電相對於石化燃料以及太陽能和儲能等替代能源的競爭力。
電網連接瓶頸限制了市場成長。
美國電網併網等待名單已膨脹至2600吉瓦,預計英國的等待期將長達14年,這將延緩運作並推高營運成本。在德國,壅塞將導致北海發電量在2024年下降9%。儘管諸如聯邦能源監管委員會(FERC)2023號指令等改革措施簡化了核准程序,電網擴建仍落後於風電建設進度,且短期擴建也面臨諸多限制。
細分市場分析
陸上設施在成熟的供應鏈和更有效率的審核流程的支持下,預計到2025年仍將佔總收入的91.83%。同時,海上項目預計將以18.95%的複合年成長率成長,並在2031年前穩步提升其在風力發電機市場規模中的佔有率。亞太地區10吉瓦(日本)和12吉瓦(韓國)的在建項目表明,浮體式概念正在迅速擴展,使其能夠在風力強勁的深海域位置,並吸引了那些曾經對這種新型錨碇系統持懷疑態度的保險公司。
隨著模組化船體和基礎的大規模生產降低了資本投入,預計到2030年代中期,離岸風力渦輪機的成本將與陸上渦輪機持平。隨著陸上電網擁塞狀況日益加劇,沿海國家正在利用海上樞紐來降低併網進度相關的風險,從而進一步擴大其在離岸風力發電機市場的佔有率。
預計到2025年,1至5兆瓦的大型機組將保持45.85%的市場佔有率,但5兆瓦以上的機型預計將以14.05%的複合年成長率成長,這主要受發電企業「少機組、高輸出」需求的驅動。西門子歌美颯的21兆瓦概念機組和中國推出的18兆瓦機型凸顯了超大型平台的發展趨勢。更大的轉子能夠捕捉高空強風,減少維護和運營(O&M)車輛的部署次數,並提高專案經濟效益,從而進一步鞏固超大型機組的成長軌跡。
區域分析
預計到2025年,亞太地區將佔全球市場規模的47.90%,主要得益於中國國內建築業的擴張、印度新增3.4吉瓦裝置容量以及日本在浮動式風力發電的進步。該地區11.35%的成長率歸功於其強大的本土製造業基礎和持續的政策獎勵。歐洲仍然是技術領先者,歐盟42.5%的可再生能源目標以及完善的海上基礎設施,使得專案發展勢頭依然強勁。
中東和非洲預計將成為成長最快的地區,這主要得益於埃及投資100億美元、裝置容量10吉瓦的大型企劃,以及沙烏地阿拉伯以每兆瓦時15美元的價格成功競標。在北美,隨著輸電法規的製定,離岸風力發電的潛力正在不斷擴大;而在南美,巴西和智利的一系列競標進一步鞏固了離岸風電在該地區的地位。
其他好處
- Excel格式的市場預測(ME)表
- 3個月的分析師支持
目錄
第1章:引言
- 研究假設和市場定義
- 調查範圍
第2章:調查方法
第3章執行摘要
第4章 市場狀況
- 市場概覽
- 市場促進因素
- 提高各國可再生能源目標
- 陸上和離岸風力發電的平準化度電成本快速下降
- 電力公司對超過15兆瓦風力發電機的需求
- 關於綠色氫能合作的有利措施
- 關於浮體式海上風電資金籌措可行性的里程碑
- 透過人工智慧驅動的預測性維護降低成本
- 市場限制因素
- 網格連接隊列瓶頸
- 透過大規模太陽能發電+儲能系統展開競爭
- 稀土元素磁鐵的供應穩定性
- 廢舊刀片的回收成本
- 供應鏈分析
- 監管環境和政府激勵措施
- 技術展望
- 波特五力模型
第5章 市場規模與成長預測
- 按部署位置
- 陸上
- 離岸
- 固定類型
- 浮體式
- 按額定容量
- 小規模(100kW 或以下)
- 中等規模(100千瓦至1兆瓦)
- 大型(1-5兆瓦)
- 超大型(超過5兆瓦)
- 按軸類型
- 水平軸
- 縱軸
- 按組件
- 葉輪
- 引擎室傳動系統
- 發電機
- 塔
- 電力電子與控制
- 按最終用途
- 實用規模
- 商業和工業用途
- 住宅及微電網
- 按地區
- 北美洲
- 美國
- 加拿大
- 墨西哥
- 歐洲
- 德國
- 英國
- 法國
- 西班牙
- 俄羅斯
- 芬蘭
- 瑞典
- 土耳其
- 荷蘭
- 其他歐洲國家
- 亞太地區
- 中國
- 印度
- 日本
- 韓國
- 澳洲
- 越南
- 其他亞太國家
- 南美洲
- 巴西
- 阿根廷
- 智利
- 其他南美國家
- 中東和非洲
- 沙烏地阿拉伯
- 南非
- 埃及
- 摩洛哥
- 其他中東和非洲國家
- 北美洲
第6章 競爭情勢
- 市場集中度
- 策略趨勢(併購、聯盟、購電協議)
- 市場佔有率分析(主要公司的市場排名和佔有率)
- 公司簡介
- Vestas Wind Systems A/S
- Siemens Gamesa Renewable Energy SA
- General Electric Company(GE Vernova)
- Nordex SE
- Suzlon Energy Ltd.
- Xinjiang Goldwind Science & Technology Co., Ltd.
- Envision Energy Ltd.
- Ming Yang Smart Energy Group Ltd.
- Dongfang Electric Corp.
- Enercon GmbH
- Hitachi Ltd.
- LM Wind Power A/S
- MHI Vestas Offshore Wind A/S
- Senvion SA
- Sinovel Wind Group Co., Ltd.
- Vergnet SA
- Eocycle Technologies Inc.
- Airgenesis LLC
- United Power Technology Co., Ltd.
- Siemens Energy AG
第7章 市場機會與未來展望
According to Mordor Intelligence, the wind turbine market size was valued at USD 169.33 billion in 2025 and estimated to grow from USD 186.95 billion in 2026 to reach USD 306.79 billion by 2031, at a CAGR of 10.41% during the forecast period (2026-2031).
This report is Segmented by Location of Deployment (Onshore and Offshore), Capacity Rating (Small, Medium, Large, and Very Large), Axis Type (Horizontal Axis and Vertical Axis), Component (Rotor Blades, Nacelle and Drivetrain, Generator, Tower, and Power-Electronics and Control), End-Use Application (Utility-Scale, Commercial and Industrial, and Residential and Micro-Grid), and Geography (Asia-Pacific, and More).
Global Wind Turbine Market Trends and Insights
Escalating National Renewable-Energy Targets Drive Unprecedented Policy Support
The European Union now mandates 42.5% renewable electricity by 2030, while Spain aims for 81% and Greece sets comparable goals. India added 3.4 GW of wind capacity in 2024 as part of its goal to reach 500 GW of non-fossil energy. The United Kingdom's Clean Power 2030 mission seeks 95% low-carbon generation, removing prior onshore wind curbs. These frameworks guarantee revenue via feed-in tariffs, certificates, and competitive auctions, thereby accelerating the wind turbine market. Long-term policy certainty also fosters domestic manufacturing and the localization of supply chains.
Rapid LCOE Decline Transforms Wind Energy Economics
Saudi Arabia's latest tender cleared at USD 15/MWh, underlining how far onshore costs have fallen. Offshore trajectories are similar; floating wind is projected to reach 40 EUR/MWh by 2050 as rotors exceeding 180 m become standard. The average turbine rating reached 5,500 kW in 2024, resulting in reduced balance-of-plant expenses. Serial foundation fabrication, modular substations, and green-bond financing further compress unit costs. These trends entrench wind's competitiveness against fossil and solar-plus-storage alternatives.
Grid Connection Bottlenecks Constrain Market Growth
U.S. interconnection queues swelled to 2,600 GW, and the UK faces 14-year wait times, which delay commissioning and inflate carrying costs. Germany curtailed 9% of North Sea output in 2024 due to congestion. Although reforms, such as FERC Order 2023, aim to streamline approvals, transmission upgrades still lag behind wind build schedules, capping near-term additions.
Other drivers and restraints analyzed in the detailed report include:
- Utility Appetite for Mega-Turbines Reshapes Market Dynamics
- Green Hydrogen Integration Creates New Revenue Streams
- Solar-Plus-Storage Competition Intensifies Market Dynamics
For complete list of drivers and restraints, kindly check the Table Of Contents.
Segment Analysis
Onshore facilities continued to account for 91.83% of 2025 revenue, supported by mature supply chains and more streamlined permitting processes. Offshore projects, however, are projected to record a 18.95% CAGR and steadily raise their share of the wind turbine market size through 2031. Asia Pacific's 10 GW (Japan) and 12 GW (South Korea) pipelines illustrate that floating concepts are rapidly scaling, unlocking high-wind deep-water sites and attracting insurers once skeptical of novel mooring systems.
Cost parity with onshore turbines is expected to be achieved by the mid-2030s, as modular hulls and serial foundation fabrication reduce capital expenditures. As grid congestion mounts onshore, coastal nations are utilizing offshore hubs to de-risk interconnection timelines, thereby further increasing their share of the offshore wind turbine market.
Large units, 1-5 MW, retained a 45.85% share in 2025; however, models exceeding 5 MW are forecast to expand at a 14.05% CAGR, driven by utility demand for fewer, higher-output machines. Siemens Gamesa's 21 MW concept and China's 18 MW rollout highlight the tilt toward mega-platforms. Bigger rotors harness stronger winds aloft, lower O&M truck rolls, and enhance project economics, reinforcing the growth trajectory of the very-large class.
Complete Report Scope:
- By Location of Deployment
- Onshore
- Offshore
- Fixed-bottom
- Floating
- By Capacity Rating
- Small (Below 100 kW)
- Medium (100 kW to 1 MW)
- Large (1 to 5 MW)
- Very Large (Above 5 MW)
- By Axis Type
- Horizontal Axis
- Vertical Axis
- By Component
- Rotor Blades
- Nacelle and Drivetrain
- Generator
- Tower
- Power-Electronics and Control
- By End-Use Application
- Utility-Scale
- Commercial and Industrial
- Residential and Micro-grid
- By Geography
- North America
- United States
- Canada
- Mexico
- Europe
- Germany
- United Kingdom
- France
- Spain
- Russia
- Finland
- Sweden
- Tukey
- Netherlands
- Rest of Europe
- Asia Pacific
- China
- India
- Japan
- South Korea
- Australia
- Vietnam
- Rest of Asia Pacific
- South America
- Brazil
- Argentina
- Chile
- Rest of South America
- Middle East and Africa
- Saudi Arabia
- South Africa
- Egypt
- Morocco
- Rest of Middle East and Africa
- North America
Geography Analysis
Asia Pacific accounted for 47.90% of the 2025 market value, energized by China's domestic buildout, India's 3.4 GW additions, and Japan's floating push. The region's 11.35% growth clip stems from local manufacturing depth and sustained policy incentives. Europe remains a technology pacesetter, with the EU's 42.5% renewable mandate and robust offshore infrastructure keeping project momentum high.
The Middle East and Africa region is projected to be the fastest-expanding territory, buoyed by Egypt's USD 10 billion 10 GW megaproject and Saudi tenders clearing at USD 15/MWh. North America is catching up on offshore potential as transmission rules evolve, while South America rides Brazil's and Chile's auction pipelines to deepen its regional role.
- Vestas Wind Systems A/S
- Siemens Gamesa Renewable Energy S.A.
- General Electric Company (GE Vernova)
- Nordex SE
- Suzlon Energy Ltd.
- Xinjiang Goldwind Science & Technology Co., Ltd.
- Envision Energy Ltd.
- Ming Yang Smart Energy Group Ltd.
- Dongfang Electric Corp.
- Enercon GmbH
- Hitachi Ltd.
- LM Wind Power A/S
- MHI Vestas Offshore Wind A/S
- Senvion SA
- Sinovel Wind Group Co., Ltd.
- Vergnet SA
- Eocycle Technologies Inc.
- Airgenesis LLC
- United Power Technology Co., Ltd.
- Siemens Energy AG
Additional Benefits:
- The market estimate (ME) sheet in Excel format
- 3 months of analyst support
TABLE OF CONTENTS
1 Introduction
- 1.1 Study Assumptions & Market Definition
- 1.2 Scope of the Study
2 Research Methodology
3 Executive Summary
4 Market Landscape
- 4.1 Market Overview
- 4.2 Market Drivers
- 4.2.1 Escalating national renewable-energy targets
- 4.2.2 Rapid fall in onshore & offshore LCOE
- 4.2.3 Utility appetite for >=15 MW turbines
- 4.2.4 Favourable green-hydrogen linkage policies
- 4.2.5 Floating-wind bankability milestones
- 4.2.6 AI-enabled predictive-maintenance savings
- 4.3 Market Restraints
- 4.3.1 Grid-connection queue bottlenecks
- 4.3.2 Competition from utility-scale solar-plus-storage
- 4.3.3 Rare-earth magnet supply security
- 4.3.4 End-of-life blade-recycling costs
- 4.4 Supply-Chain Analysis
- 4.5 Regulatory Landscape & Government Incentives
- 4.6 Technological Outlook
- 4.7 Porters Five Forces
- 4.7.1 Bargaining Power of Suppliers
- 4.7.2 Bargaining Power of Buyers
- 4.7.3 Threat of New Entrants
- 4.7.4 Threat of Substitutes
- 4.7.5 Competitive Rivalry
5 Market Size & Growth Forecasts
- 5.1 By Location of Deployment
- 5.1.1 Onshore
- 5.1.2 Offshore
- 5.1.2.1 Fixed-bottom
- 5.1.2.2 Floating
- 5.2 By Capacity Rating
- 5.2.1 Small (Below 100 kW)
- 5.2.2 Medium (100 kW to 1 MW)
- 5.2.3 Large (1 to 5 MW)
- 5.2.4 Very Large (Above 5 MW)
- 5.3 By Axis Type
- 5.3.1 Horizontal Axis
- 5.3.2 Vertical Axis
- 5.4 By Component
- 5.4.1 Rotor Blades
- 5.4.2 Nacelle and Drivetrain
- 5.4.3 Generator
- 5.4.4 Tower
- 5.4.5 Power-Electronics and Control
- 5.5 By End-Use Application
- 5.5.1 Utility-Scale
- 5.5.2 Commercial and Industrial
- 5.5.3 Residential and Micro-grid
- 5.6 By Geography
- 5.6.1 North America
- 5.6.1.1 United States
- 5.6.1.2 Canada
- 5.6.1.3 Mexico
- 5.6.2 Europe
- 5.6.2.1 Germany
- 5.6.2.2 United Kingdom
- 5.6.2.3 France
- 5.6.2.4 Spain
- 5.6.2.5 Russia
- 5.6.2.6 Finland
- 5.6.2.7 Sweden
- 5.6.2.8 Tukey
- 5.6.2.9 Netherlands
- 5.6.2.10 Rest of Europe
- 5.6.3 Asia Pacific
- 5.6.3.1 China
- 5.6.3.2 India
- 5.6.3.3 Japan
- 5.6.3.4 South Korea
- 5.6.3.5 Australia
- 5.6.3.6 Vietnam
- 5.6.3.7 Rest of Asia Pacific
- 5.6.4 South America
- 5.6.4.1 Brazil
- 5.6.4.2 Argentina
- 5.6.4.3 Chile
- 5.6.4.4 Rest of South America
- 5.6.5 Middle East and Africa
- 5.6.5.1 Saudi Arabia
- 5.6.5.2 South Africa
- 5.6.5.3 Egypt
- 5.6.5.4 Morocco
- 5.6.5.5 Rest of Middle East and Africa
- 5.6.1 North America
6 Competitive Landscape
- 6.1 Market Concentration
- 6.2 Strategic Moves (M&A, Partnerships, PPAs)
- 6.3 Market Share Analysis (Market Rank/Share for key companies)
- 6.4 Company Profiles (includes Global level Overview, Market level overview, Core Segments, Financials as available, Strategic Information, Products & Services, and Recent Developments)
- 6.4.1 Vestas Wind Systems A/S
- 6.4.2 Siemens Gamesa Renewable Energy S.A.
- 6.4.3 General Electric Company (GE Vernova)
- 6.4.4 Nordex SE
- 6.4.5 Suzlon Energy Ltd.
- 6.4.6 Xinjiang Goldwind Science & Technology Co., Ltd.
- 6.4.7 Envision Energy Ltd.
- 6.4.8 Ming Yang Smart Energy Group Ltd.
- 6.4.9 Dongfang Electric Corp.
- 6.4.10 Enercon GmbH
- 6.4.11 Hitachi Ltd.
- 6.4.12 LM Wind Power A/S
- 6.4.13 MHI Vestas Offshore Wind A/S
- 6.4.14 Senvion SA
- 6.4.15 Sinovel Wind Group Co., Ltd.
- 6.4.16 Vergnet SA
- 6.4.17 Eocycle Technologies Inc.
- 6.4.18 Airgenesis LLC
- 6.4.19 United Power Technology Co., Ltd.
- 6.4.20 Siemens Energy AG
7 Market Opportunities & Future Outlook
- 7.1 White-space & Unmet-Need Assessment

 風力發電機市場機會、成長要素、產業趨勢分析及2026-2035年預測
 風力發電機市場:按類型、組件、容量、安裝類型、應用和最終用戶分類-2026-2032年全球市場預測
 風力發電機:市場佔有率分析、產業趨勢與統計、成長預測(2026-2031)
 無翼風力渦輪機市場-全球產業規模、佔有率、趨勢、機會、預測:按應用、最終用戶、地區和競爭格局分類,2021-2031年陸域風力發電機葉輪市場-全球產業規模、佔有率、趨勢、機會、預測:依葉片材料、區域和競爭格局分類,2021-2031年風力發電機制動器市場-全球產業規模、佔有率、趨勢、機會、預測:按應用、類型、運作模式、最終用戶、地區和競爭格局分類,2021-2031年風力發電機市場:全球產業規模、市場佔有率、趨勢、機會和預測(按發電機類型、驅動系統、轉速和地區分類)、競爭格局(2021-2031 年)南美洲風力發電機:市場佔有率分析、行業趨勢和統計數據以及成長預測(2026-2031 年)
 風力發電機潤滑油市場預測至2034年-按產品類型、基礎油、渦輪機零件、換油週期、應用和地區分類的全球分析風力發電機鍛件市場預測至2034年:按類型、材質、零件、應用和地區分類的全球分析