

 |
市場調查報告書
商品編碼
2064414
南美洲風力發電機:市場佔有率分析、行業趨勢和統計數據以及成長預測(2026-2031 年)South America Wind Turbine - Market Share Analysis, Industry Trends & Statistics, Growth Forecasts (2026 - 2031) |
||||||
※ 本網頁內容可能與最新版本有所差異。詳細情況請與我們聯繫。
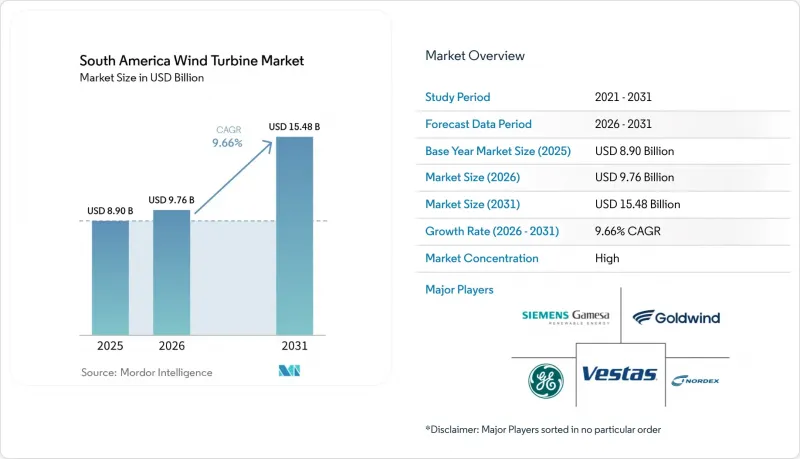
根據 Mordor Intelligence 預測,南美風力發電機市場規模將從 2025 年的 89 億美元和 2026 年的 97.6 億美元成長到 2031 年的 154.8 億美元,2026 年至 2031 年的年複合成長率(CAGR)為 9.6%。
本報告根據安裝地點(陸上、海上)、額定功率(小型、中型、大型、超大型)、軸型(臥式、立式)、零件(葉輪、機艙/傳動系統、發電機等)、最終用途(公用事業規模、商業/工業規模、其他)以及地區(巴西、智利、阿根廷、哥倫比亞和其他南美國家)進行分類。預測值以美元計價。
南美洲風力發電機市場趨勢與洞察
平準化能源成本的下降使得陸上風電成為該地區最便宜的可調電源。
陸上發電成本低廉仍是支撐該地區新增風力渦輪機需求的最顯著因素之一。巴西陸上風電的平準化度電成本(LCOE)在2024年降至0.025美元/度數時,該國風電場的容量係數達到56%,遠高於全球陸上平均水準。這項成本優勢至關重要,因為它使開發商即使在資金籌措成本居高不下或併網風險增加的情況下,也能保持專案的盈利。這項成本優勢也使陸上專案在採購和雙邊合約中更具競爭力,尤其是在巴西東北部和其他風力資源豐富的地區。對於南美洲風力發電機市場而言,這意味著新裝機量的基本案例仍然是陸上風電的經濟效益,而不僅僅是政策支援。
一系列可再生能源購電協議和競標項目擴大了合約確定性,使其超越了政府購電協議的範疇。
新的風電項目需求基礎正在超越傳統的政府主導的競標模式。企業買家、工業用戶和大規模基礎設施營運商在長期可再生能源採購中扮演著越來越重要的角色,這為開發商提供了多種創收途徑。亞馬遜已宣布計劃在2026年底前在智利推出AWS基礎設施區域,投資超過40億美元。可再生能源將成為該區域營運模式的重要組成部分。這對專案開發具有重大意義,因為即使政府採購放緩,更廣泛的買家群體也能支撐風電的擴張。在南美風力發電機市場,這種轉變正在增加合約的多樣性,並有利於那些能夠根據信譽良好的大規模買家的需求量身定做風電項目的開發商。
電網擁塞給巴西東北部整個風能帶帶來了結構性的收入風險。
巴西東北部電網擁塞仍然是大型風發電工程的主要營運限制因素。預計到2025年,風電和太陽能電站因棄電造成的損失將增加220%,達到3,290萬兆瓦時。這表明,該問題已迅速從區域運營挑戰演變為更廣泛的投資問題。即使不將損失的兆瓦時分配給各個項目,其市場影響也顯而易見,因為貸款機構、原始設備製造商和開發商現在不得不考慮即使在曾經被認為是最安全的風能走廊地區也減少運轉率。正因如此,南美風力發電機市場仍在成長,人們越來越關注位置條件、與當地需求的匹配以及電網強化的速度。
細分市場分析
到2025年,陸域風電將佔總裝置容量的90.6%,繼續在全部區域風力渦輪機需求中佔據穩固的核心地位。南美洲風力發電機市場的這一領域持續受益於巴西、阿根廷和智利已建立的陸上風電開發走廊。這些地區風能資源豐富,其供應模式也為貸款機構和電力公司所熟知。與海上專案相比,陸上專案更適合現有的製造和物流網路,即使在供應緊張的情況下,也有助於保持成本競爭力。這一優勢在該地區尤其重要,因為在地採購價格、資金籌措便利性和運輸能力對專案的資金籌措潛力的影響幾乎與渦輪機技術本身不相上下。
儘管離岸風力發電起步規模遠小規模陸上風電,但預計到2031年將以18.1%的複合年成長率成長,成為南美風力發電機市場中成長最快的部署類別。這一成長前景得益於未來平台規模的擴大、巴西政策框架的完善以及人們對未來可能利用離岸風電的沿海產業叢集日益成長的興趣。然而,在預測期內的大部分時間裡,離岸風電的收入規模仍將小於陸上風電,因為它仍然需要港口建設、健全的供應鏈和專案執行經驗。因此,其短期影響主要體現在戰略層面而非數量層面,因為離岸風電正在改變原始設備製造商、開發商和政府對未來製造、服務能力和沿海基礎設施的思考方式。
到2025年,1-5兆瓦級的大型風力發電機將佔45.7%的市場。這反映了過去十年建設的大多數區域性風發電工程都屬於這一級別。由於該級別風力發電機的設備、服務基礎設施和資金籌措保障已相當成熟,因此其市場佔有率將繼續保持重要地位。實際上,這為開發商在評估巴西東北部、巴塔哥尼亞和智利等風電走廊的新採購決策時提供了一個穩定的基準。這也意味著,即使開發商尋求更大功率的機組,大型風力發電機仍支撐著大部分短期訂單活動。
預計5兆瓦以上風電市場將實現最高成長率,複合年成長率達13.8%,這主要得益於單颱風機發電量的提升、單一項目風機數量的減少以及大規模待開發區項目經濟效益的提高。金風科技在巴西的首個海外工廠已於2024年開始生產5.3兆瓦至7.5兆瓦級風扇,顯示該地區的供應狀況正逐步適應高功率的機型。因此,儘管南美風力發電機產業正朝著功率輸出範圍多元化的方向發展,但這一轉變將是漸進的,因為開發商仍需權衡風扇尺寸與物流、安裝條件以及電網容量之間的關係。在預測期內,超大型風扇市場佔有率的成長預計主要體現在那些高輸出功率和低系統平衡成本能夠抵消大型零件施工複雜性的專案。
其他好處:
- Excel格式的市場預測(ME)表
- 3個月的分析師支持
目錄
第1章:引言
- 研究假設和市場定義
- 調查範圍
第2章:調查方法
第3章執行摘要
第4章 市場狀況
- 市場概覽
- 市場促進因素
- 陸域風電平準化度電成本下降
- 加速可再生能源購電協議和競標交易
- 國家脫碳目標(與國家自主貢獻一致)
- 巴西巴塔哥尼亞和東北部的綠色氫能出口中心
- 資料中心主導的電網升級(亞馬遜、微軟)
- 塞阿拉州和伯南布哥州為製造業提供州級激勵措施
- 市場限制因素
- 巴西東北部交通擁擠與發電限制
- 渦輪機零件的港口和物流瓶頸
- 新興南美國家的貨幣波動與高資金籌措成本
- 國內大型渦輪機零件生產能力不足,依賴進口。
- 供應鏈分析
- 監理情勢
- 技術展望
- 波特五力模型
第5章 市場規模與成長預測
- 按部署位置
- 陸上
- 離岸
- 固定類型
- 浮體式
- 按產能
- 小規模(小於100千瓦)
- 中型規模(100千瓦至1兆瓦)
- 大型(1-5兆瓦)
- 超大型(5兆瓦或以上)
- 按軸類型
- 水平軸
- 縱軸
- 按組件
- 葉輪
- 引擎室和傳動系統
- 發電機
- 塔
- 電力電子與控制
- 按最終用途
- 公用事業規模
- 商業和工業用途
- 住宅及微電網
- 按地區
- 巴西
- 智利
- 阿根廷
- 哥倫比亞
- 其他南美國家
第6章 競爭情勢
- 市場集中度
- 策略趨勢(併購、聯盟、購電協議)
- 市場佔有率分析(主要公司的市場排名和佔有率)
- 公司簡介
- Vestas Wind Systems A/S
- Siemens Gamesa Renewable Energy SA
- GE Vernova(GE Renewable Energy)
- Nordex SE
- Goldwind Science & Technology Co.
- Iberdrola SA
- Acciona Energia
- Enel Green Power Latin America
- ENGIE Brasil Energia
- Neoenergia(Iberdrola)
- Latin America Power(LAP)
- Colbun SA
- Omega Energia
- Voltalia SA
- Statkraft Latin America
- Mainstream Renewable Power
- Casa dos Ventos Energias Renovaveis
- Enercon GmbH
- Elecnor SA
- Grupo Envision
第7章 市場機會與未來展望
According to Mordor Intelligence, the south america wind turbine market size is projected to expand from USD 8.90 billion in 2025 and USD 9.76 billion in 2026 to USD 15.48 billion by 2031, registering a CAGR of 9.66% between 2026 to 2031.
This report is Segmented by Location of Deployment (Onshore, Offshore), Capacity Rating (Small, Medium, Large, Very Large), Axis Type (Horizontal, Vertical), Component (Rotor Blades, Nacelle & Drivetrain, Generator, and More), End-Use Application (Utility-Scale, Commercial & Industrial, and More), and Geography (Brazil, Chile, Argentina, Colombia, Rest of South America). Forecasts are in Value (USD).
South America Wind Turbine Market Trends and Insights
Declining LCOE Turns Onshore Wind Into the Region's Cheapest Dispatchable Resource
Lower onshore generation costs remain one of the clearest supports for new turbine demand in the region. Brazil's onshore wind LCOE fell to USD 0.025/kWh in 2024, and the country's wind fleet achieved capacity factors of 56%, which is well above the global onshore average . That cost position matters because it gives developers room to preserve project returns even when financing stays expensive or transmission access becomes less predictable. It also keeps onshore projects competitive in procurement rounds and bilateral contracts, especially in Brazil's Northeast and other high-wind corridors. For the South America wind turbine market, this means the base case for new installations is still being set by onshore economics rather than by policy support alone.
Renewable-PPA and Auction Pipeline Extends Contract Certainty Beyond Government Offtake
The demand base for new wind projects is becoming broader than the earlier model that depended mainly on government-led auctions. Corporate buyers, industrial users, and large digital infrastructure operators are taking a larger role in long-term renewable procurement, which gives developers more than one route to contract revenues. Amazon announced an investment of more than USD 4 billion to launch an AWS infrastructure region in Chile by the end of 2026, with renewable energy forming part of the operating model for that site. This matters for project development because a deeper buyer pool can support wind additions even when sovereign procurement slows. In the South America wind turbine market, that change is improving contract diversity and favoring developers that can match wind generation profiles with the needs of large, creditworthy offtakers.
Grid Congestion Creates Structural Revenue Risk Across NE Brazil's Wind Belt
Grid congestion in Northeast Brazil remains the main operating constraint for utility-scale wind projects. Curtailment losses for wind and solar plants rose 220% in 2025 and reached 32.9 million MWh, which shows how quickly the issue has moved from a local operating challenge to a broader investment concern. The market effect is clear even without assigning every lost megawatt-hour to a single project, because lenders, OEMs, and developers now have to account for weaker utilization in areas that were once seen as the safest wind corridors. This is why the South America wind turbine market is still growing, but with stronger attention on location quality, local demand pairing, and the pace of transmission reinforcement.
Other drivers and restraints analyzed in the detailed report include:
- Green-Hydrogen Export Hubs Co-locate Wind Infrastructure at Port-Adjacent Sites
- Data-Centre-Led Transmission Upgrades Generate Incremental Wind Demand
- Currency Volatility and High Capital Costs Act as a Structural Barrier to Foreign Investment
For complete list of drivers and restraints, kindly check the Table Of Contents.
Segment Analysis
Onshore represented 90.6% of the installed base in 2025, which kept it firmly at the center of turbine demand across the region. This part of the South America wind turbine market continues to benefit from established land-based development corridors in Brazil, Argentina, and Chile, where wind resources are strong and the delivery model is already familiar to lenders and utilities. Onshore projects also fit existing manufacturing and logistics networks better than offshore projects do, which helps preserve cost competitiveness when supply conditions tighten. That advantage is especially important in a region where local content, financing access, and transport execution can still influence project bankability almost as much as turbine technology.
Offshore starts from a much smaller base, but it is projected to grow at an 18.1% CAGR through 2031, which makes it the fastest-moving deployment category in the South America wind turbine market. The growth case rests on future platform scaling, a formalizing policy framework in Brazil, and increasing interest in coastal industrial clusters that could use offshore power over time. Even so, offshore will remain a smaller revenue pool than onshore through most of the forecast period because it still needs port readiness, supply-chain depth, and project execution experience. The main near-term effect is therefore strategic rather than volumetric, since offshore is changing how OEMs, developers, and governments think about future manufacturing, service capabilities, and coastal infrastructure.
Large turbines in the 1-5 MW range accounted for 45.7% of the market in 2025, which reflects how most regional wind projects were built over the past decade. That installed base keeps the segment important because fleet familiarity, service capabilities, and financing comfort are already in place for this rating class. In practice, this gives developers a stable reference point when they evaluate new procurement decisions in Brazil's Northeast, Patagonia, and Chile's wind corridors. It also means the large-turbine class still anchors most near-term order activity even as developers look for larger machines.
The above 5 MW segment is projected to record the fastest growth at 13.8% CAGR, driven by a search for higher yield per unit, fewer turbines per project, and better economics in large greenfield developments. Goldwind's first overseas factory in Brazil began producing turbines in the 5.3 MW to 7.5 MW range in 2024, which showed that the regional supply picture is starting to adapt to higher-capacity machines. The South America wind turbine industry is therefore moving toward a wider mix of ratings, but the shift will be gradual because developers still have to balance turbine scale against logistics, site conditions, and available grid capacity. Over the forecast period, the very large category should gain share mainly in projects where stronger output and lower balance-of-system intensity can offset the execution complexity that comes with bigger components.
List of Companies Covered in this Report:
- Vestas Wind Systems A/S
- Siemens Gamesa Renewable Energy SA
- GE Vernova (GE Renewable Energy)
- Nordex SE
- Goldwind Science & Technology Co.
- Iberdrola SA
- Acciona Energia
- Enel Green Power Latin America
- ENGIE Brasil Energia
- Neoenergia (Iberdrola)
- Latin America Power (LAP)
- Colbun SA
- Omega Energia
- Voltalia SA
- Statkraft Latin America
- Mainstream Renewable Power
- Casa dos Ventos Energias Renovaveis
- Enercon GmbH
- Elecnor SA
- Grupo Envision
Additional Benefits:
- The market estimate (ME) sheet in Excel format
- 3 months of analyst support
TABLE OF CONTENTS
1 Introduction
- 1.1 Study Assumptions & Market Definition
- 1.2 Scope of the Study
2 Research Methodology
3 Executive Summary
4 Market Landscape
- 4.1 Market Overview
- 4.2 Market Drivers
- 4.2.1 Declining LCOE for On-shore Wind
- 4.2.2 Accelerating Renewable-PPA & Auction Pipeline
- 4.2.3 National Decarbonisation Targets (NDC-aligned)
- 4.2.4 Green-Hydrogen Export Hubs in Patagonia & NE Brazil
- 4.2.5 Data-centre-led Transmission Upgrades (Amazon, MSFT)
- 4.2.6 State-level Manufacturing Incentives in Ceara & Pernambuco
- 4.3 Market Restraints
- 4.3.1 Grid Congestion & Curtailment in NE Brazil
- 4.3.2 Turbine-component Port & Logistics Bottlenecks
- 4.3.3 Currency Volatility & High Financing Costs Across Emerging South American Economies
- 4.3.4 Limited Local Manufacturing Capacity for Large Turbine Components and Dependence on Imports
- 4.4 Supply-Chain Analysis
- 4.5 Regulatory Landscape
- 4.6 Technological Outlook
- 4.7 Porter's Five Forces
- 4.7.1 Bargaining Power of Suppliers
- 4.7.2 Bargaining Power of Buyers
- 4.7.3 Threat of New Entrants
- 4.7.4 Threat of Substitutes
- 4.7.5 Competitive Rivalry
5 Market Size & Growth Forecasts
- 5.1 By Location of Deployment
- 5.1.1 Onshore
- 5.1.2 Offshore
- 5.1.2.1 Fixed-bottom
- 5.1.2.2 Floating
- 5.2 By Capacity Rating
- 5.2.1 Small (Below 100 kW)
- 5.2.2 Medium (100 kW to 1 MW)
- 5.2.3 Large (1 to 5 MW)
- 5.2.4 Very Large (Above 5 MW)
- 5.3 By Axis Type
- 5.3.1 Horizontal Axis
- 5.3.2 Vertical Axis
- 5.4 By Component
- 5.4.1 Rotor Blades
- 5.4.2 Nacelle and Drivetrain
- 5.4.3 Generator
- 5.4.4 Tower
- 5.4.5 Power-Electronics and Control
- 5.5 By End-Use Application
- 5.5.1 Utility-Scale
- 5.5.2 Commercial and Industrial
- 5.5.3 Residential and Micro-grid
- 5.6 By Geography
- 5.6.1 Brazil
- 5.6.2 Chile
- 5.6.3 Argentina
- 5.6.4 Colombia
- 5.6.5 Rest of South America
6 Competitive Landscape
- 6.1 Market Concentration
- 6.2 Strategic Moves (M&A, Partnerships, PPAs)
- 6.3 Market Share Analysis (Market Rank/Share for key companies)
- 6.4 Company Profiles (includes Global level Overview, Market level overview, Core Segments, Financials as available, Strategic Information, Products & Services, and Recent Developments)
- 6.4.1 Vestas Wind Systems A/S
- 6.4.2 Siemens Gamesa Renewable Energy SA
- 6.4.3 GE Vernova (GE Renewable Energy)
- 6.4.4 Nordex SE
- 6.4.5 Goldwind Science & Technology Co.
- 6.4.6 Iberdrola SA
- 6.4.7 Acciona Energia
- 6.4.8 Enel Green Power Latin America
- 6.4.9 ENGIE Brasil Energia
- 6.4.10 Neoenergia (Iberdrola)
- 6.4.11 Latin America Power (LAP)
- 6.4.12 Colbun SA
- 6.4.13 Omega Energia
- 6.4.14 Voltalia SA
- 6.4.15 Statkraft Latin America
- 6.4.16 Mainstream Renewable Power
- 6.4.17 Casa dos Ventos Energias Renovaveis
- 6.4.18 Enercon GmbH
- 6.4.19 Elecnor SA
- 6.4.20 Grupo Envision
7 Market Opportunities & Future Outlook
- 7.1 White-space & Unmet-Need Assessment
 風力發電機:市場佔有率分析、產業趨勢與統計、成長預測(2026-2031)
 無翼風力渦輪機市場-全球產業規模、佔有率、趨勢、機會、預測:按應用、最終用戶、地區和競爭格局分類,2021-2031年陸域風力發電機葉輪市場-全球產業規模、佔有率、趨勢、機會、預測:依葉片材料、區域和競爭格局分類,2021-2031年風力發電機制動器市場-全球產業規模、佔有率、趨勢、機會、預測:按應用、類型、運作模式、最終用戶、地區和競爭格局分類,2021-2031年風力發電機市場:全球產業規模、市場佔有率、趨勢、機會和預測(按發電機類型、驅動系統、轉速和地區分類)、競爭格局(2021-2031 年)
 風力發電機潤滑油市場預測至2034年-按產品類型、基礎油、渦輪機零件、換油週期、應用和地區分類的全球分析風力發電機鍛件市場預測至2034年:按類型、材質、零件、應用和地區分類的全球分析
 風力發電機狀態監測市場分析與預測(至2035年):類型、產品類型、服務、技術、組件、應用、部署狀態、最終用戶、解決方案全球風力發電機市場預測至2034年:按組件、類型、容量、安裝類型、應用、最終用戶和地區分類
 風力發電機市場:按類型、組件、功率、安裝、應用和最終用戶分類-2026-2032年全球市場預測