


 |
市場調查報告書
商品編碼
2113824
商業智慧(BI):市場佔有率分析、產業趨勢與統計、成長預測(2026-2031 年)Business Intelligence (BI) - Market Share Analysis, Industry Trends & Statistics, Growth Forecasts (2026 - 2031) |
||||||

※ 本網頁內容可能與最新版本有所差異。詳細情況請與我們聯繫。
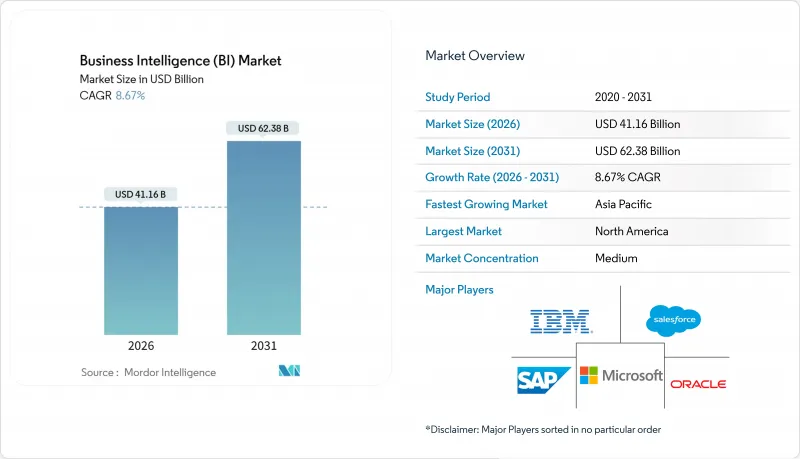
根據 Mordor Intelligence 預測,商業智慧(BI) 市場規模預計將在 2026 年達到 411.6 億美元,到 2031 年將擴大到 623.8 億美元,複合年成長率為 8.67%。
本報告按元件(軟體和平台、服務)、部署模式(本地部署、雲端部署)、經營模式(訂閱/SaaS 許可、永久許可等)、最終用戶產業(銀行、金融服務和保險、IT 和電信等)以及地區進行細分。市場預測以美元計價。
全球商業智慧(BI) 市場趨勢與洞察
雲端優先分析實施
企業持續將分析工作負載遷移到託管雲端生態系統,因為付費使用制)使他們能夠根據實際使用量付費。諸如 Amazon Redshift Serverless 之類的無伺服器資料倉儲可自動擴展以處理數千個並發查詢,使團隊能夠在幾週內完成以前在本地建置需要數年才能完成的試點儀表板。 Google BigQuery 的串流注入功能以及與 Gemini AI 的整合,允許業務用戶使用自然語言提出問題,平台會將其轉換為 SQL,從而將參與者擴展到專業分析師之外。將 Microsoft Power BI 與 Fabric 結合使用,可使視覺化內容隨著新資料的到達而更新,無需進行夜間批次處理。金融服務公司採用混合營運模式,將受監管的記錄保留在本地,同時將探索性模式遷移到雲端。美國監管指南中也提到了這種部署方式。
半結構化物聯網資料的爆炸性成長
工業感測器、車輛遠端資訊處理和智慧城市網路每天都會產生大量的 JSON、Avro 和 Parquet 文件,而傳統的關聯式資料庫無法有效率地處理這些資料。列式 Lakehouse 引擎採用「讀取時模式」方法,在查詢事務資料的同時查詢原始設備訊息,從而實現預測性維護,在製造現場試驗中,該方法可將意外停機時間減少 20-30%。經過同行評審的基準測試表明,在 TPC-H 工作負載下,GPU 加速的 SQL 引擎比 CPU 系統快 8-60 倍,並將最終用戶的延遲降低到不到一秒。 Snowflake 的 VARIANT 資料類型和 Databricks 的 Delta Lake 是統一儲存的典型範例,它們在單一環境中託管結構化訂單資料和原始遙測資料。隨著 5G 覆蓋範圍的擴大,邊緣閘道器正在將聚合的感測器簡介傳輸到雲端物件存儲,從而在保持頻寬成本可控的同時,實現近乎即時的分析。
缺乏具備數據素養的人員
根據Accenture調查,只有21%的員工具備實用的數據技能,87%的公司在招募分析師方面面臨困境。世界經濟論壇已將數據分析列為2030年最需要的五大技能之一,但學術課程培養的畢業生數量不足以滿足市場需求。不斷上漲的薪資也使得平台投資預算轉向人事費用,從而延緩了新技術的普及。低程式碼工具固然有用,但在整合相互衝突的資訊來源或解決抽樣偏差方面,它們無法取代人類的判斷。企業正透過內部培訓計畫和認證津貼來應對這個問題,但技能獲取所需的時間仍然很長,這延長了商業智慧(BI)市場的普及曲線。
細分市場分析
業務收益以 9.23% 的複合年成長率成長,超過了整體商業智慧(BI) 市場的成長率。這主要得益於企業聘請領域專家來設計語意模型、最佳化查詢邏輯並培養公民分析師。軟體和平台預計在 2025 年仍將佔總收入的 68.73%,因為許可訂閱仍然是其基礎,尤其對於那些採用標準化單一視覺化層的組織而言更是如此。系統整合商正透過承諾服務等級目標來脫穎而出,例如將儀表板延遲最小化到一秒以內,並保證 99.9% 的更新可靠性,以及採用基於結果的合約而非按小時計費的模式。包含許可證、雲端基礎設施和持續最佳化的託管服務包採用按需付費模式,降低了中型買家的資本負擔,並符合 IT 行業向銷售費用模式轉變的更廣泛趨勢。
平台供應商透過整合人工智慧輔助工具來減少對外部諮詢的需求,並緩解競爭壓力,這些輔助工具能夠自動產生視覺化圖表和超大規模資料中心業者公式。隨著Oracle自治資料庫和SAP分析雲端整合儲存、轉換和展示層以鞏固企業資料資產,超大規模資料中心的整合正在加速。為此,服務供應商專注於跨平台管治,幫助跨國公司整合透過併購取得的多個BI堆疊。儘管平台趨於簡化,但隨著商業智慧(BI)市場的擴張,一個充滿活力的顧問生態系統依然得以維持,湧現出專注於特定產業用例的專業精品公司,例如藥物安全監測中的訊號檢測和零售需求預測。
預計到2025年,雲端運算業務將佔總營收的65.87%,並將以9.54%的複合年成長率成長至2031年。雲端運算採用率佔據市場主導地位,因為可變運算和無伺服器資料倉儲消除了閒置容量的成本,而自動擴展功能可以應對分析需求的不可預測激增。持續的資料擷取管道為監控電商限時搶購活動提供了近乎即時的儀錶板,而這在以前使用傳統本地部署設備是難以實現的。在印度和印尼等國家,對本地資料處理的需求日益成長,這促使超大規模資料中心業者營運商推出國內區域,以滿足主權要求並支援商業智慧(BI)市場的進一步成長。
由於監管限制,無法將病患記錄和信用資料異地的醫院和銀行只能繼續使用本地叢集,從而形成混合架構:敏感工作負載保留在本地,而客戶體驗實驗則在雲端進行。雖然多重雲端策略能夠分散亞馬遜雲端服務 (AWS)、微軟 Azure 和谷歌雲端平台 (GCP) 的風險,但會產生出站通訊費用,有時甚至超過運算成本,因此人們對提供免費出站通訊的物件儲存(例如 Cloudflare R2)越來越感興趣。供應商目前正在整合成本最佳化儀表板,以查詢對成本進行建模,幫助財務團隊預測帳單金額並避免意外的高額費用。
區域分析
預計到2025年,北美將佔全球收入的39.85%,這主要得益於其集中的超大規模資料中心業者資料中心,這些資料中心能夠將儀表板往返延遲控制在10毫秒以下。成熟的創業投資生態系統正在為提供專業人工智慧輔助工具的新創公司提供資金,這使得商業智慧(BI)市場的應用範圍不再局限於訓練有素的分析師。然而,儘管技術資源豐富,但只有21%的員工具備分析能力,這限制了平台的使用率。對於資料密集型工作負載,多重雲端出站通訊成本可能超過運算成本,這迫使企業重新設計架構,將處理和儲存部署在同一位置。
中國的目標是到2025年數位經濟對GDP的貢獻達到60%,並增加對國內商業智慧平台的投資。預計到2031年,亞太地區的複合年成長率將達到10.12%。印度的「數位印度」計畫正在津貼寬頻普及和雲端運算應用,從而催生了對本地化分析解決方案的新需求。東協預測,到2030年,其數位經濟規模將達到1兆美元,其中電子商務和金融科技將成為分析支出的主要驅動力。然而,中國、印度和東南亞地區隱私框架的差異導致了區域資料居住要求的出現,增加了供應商的合規成本。
在歐洲,隨著企業採用融入「隱私設計」的分析技術以遵守《一般資料保護規則》(GDPR),市場正穩步成長。根據GDPR,違規企業在2023年被處以16億歐元的罰款。在南美洲,隨著巴西和阿根廷企業實現營運數位化,市場需求不斷成長,但外匯波動正在減緩大型專案的進展。在中東和非洲地區,阿拉伯聯合大公國和沙烏地阿拉伯的智慧城市計畫正在奠定初步基礎,但基礎設施差異和技能短缺限制了短期規模化發展,因此與當地系統整合商建立合作關係至關重要。
其他好處:
- Excel格式的市場預測(ME)表
- 3個月的分析師支持
目錄
第1章:引言
- 研究假設和市場定義
- 調查範圍
第2章:調查方法
第3章執行摘要
第4章 市場狀況
- 市場概覽
- 市場促進因素
- 實施雲端優先分析
- 半結構化物聯網資料的爆炸性成長
- 嵌入式 BI 在 SaaS 業務應用中的主流化
- 廣告領域以隱私為先的資料潔淨室夥伴關係
- 利用 GPU 加速查詢引擎可以降低整體擁有成本。
- “分析即代碼”和“GitOps”實踐的興起
- 市場限制因素
- 缺乏具備數據素養的人員
- 傳統核心系統的初始實施成本
- 多重雲端BI 架構中不斷上漲的出口流量成本
- 加強新興國家數位貿易規則中的數據主權監管
- 產業供應鏈分析
- 監理情勢
- 技術展望
- 宏觀經濟因素對市場的影響
- 波特五力分析
第5章 市場規模與成長預測
- 按組件
- 軟體平台
- 服務
- 不同的發展
- 現場
- 雲
- 按最終用戶行業分類
- BFSI
- 資訊科技/通訊
- 零售與電子商務
- 衛生保健
- 製造業
- 政府/公共部門
- 按經營模式
- 訂閱/SaaS 許可
- 永久許可
- 免費增值/計量型
- 主機服務/商業智慧即服務
- 按地區
- 北美洲
- 美國
- 加拿大
- 墨西哥
- 南美洲
- 巴西
- 阿根廷
- 其他南美國家
- 歐洲
- 英國
- 德國
- 法國
- 義大利
- 西班牙
- 俄羅斯
- 其他歐洲國家
- 亞太地區
- 中國
- 日本
- 印度
- 韓國
- 澳洲和紐西蘭
- 東南亞
- 其他亞太國家
- 中東和非洲
- 中東
- 沙烏地阿拉伯
- 阿拉伯聯合大公國
- 土耳其
- 其他中東國家
- 非洲
- 南非
- 奈及利亞
- 肯亞
- 其他非洲國家
- 中東
- 北美洲
第6章 競爭情勢
- 市場集中度
- 策略趨勢
- 市佔率分析
- 公司簡介
- Microsoft Corporation
- SAP SE
- Oracle Corporation
- International Business Machines Corporation
- SAS Institute Inc.
- Salesforce Inc.
- Amazon Web Services Inc.
- Google LLC
- QlikTech International AB
- MicroStrategy Incorporated
- Domo Inc.
- TIBCO Software Inc.
- Infor Inc.
- Zoho Corporation Pvt. Ltd.
- Teradata Corporation
- Alteryx Inc.
- Sisense Inc.
- ThoughtSpot Inc.
- Yellowfin International Pty Ltd.
- GoodData Corporation
第7章 市場機會與未來展望
According to Mordor Intelligence, the business intelligence (BI) market size reached USD 41.16 billion in 2026 and is projected to climb to USD 62.38 billion by 2031, registering an 8.67% CAGR.
This report is Segmented by Component (Software and Platform, and Services), Deployment (On-Premise, and Cloud), Business Model (Subscription / SaaS License, Perpetual License, and More), End-User Industry (BFSI, IT and Telecommunication, and More), and Geography. The Market Forecasts are Provided in Terms of Value (USD).
Global Business Intelligence (BI) Market Trends and Insights
Cloud-first analytics adoption
Enterprises continue to migrate analytic workloads into managed cloud ecosystems because pay-per-second pricing matches spending to actual consumption. Serverless warehouses such as Amazon Redshift Serverless auto-scale to meet thousands of concurrent queries, letting teams finish pilot dashboards in weeks rather than the multi-year timelines once associated with on-premise builds. Google BigQuery's streaming inserts and Gemini AI integration allow business users to issue natural-language questions that the platform translates into SQL, widening participation beyond specialized analysts. Microsoft Power BI paired with Fabric can refresh visuals whenever new data lands, eliminating nightly batch windows. Financial-services firms maintain hybrid patterns, keeping regulated records on-premise while exploratory models move to the cloud, a deployment style referenced in U.S. supervisory guidance.
Explosion of Semi-Structured IoT Data
Industrial sensors, vehicle telematics, and smart-city networks push daily payloads of JSON, Avro, and Parquet files that traditional relational databases cannot absorb efficiently. Columnar lakehouse engines use schema-on-read to query raw device messages alongside transactional data, enabling predictive maintenance that cuts unplanned downtime by 20-30% in manufacturing trials. Peer-reviewed benchmarks show GPU-accelerated SQL engines delivering 8-60X speed-ups versus CPU systems on TPC-H workloads, reducing end-user wait times to sub-second levels. Snowflake's VARIANT data type and Databricks Delta Lake illustrate unified storage that hosts structured orders and raw telemetry in a single environment. As 5G coverage expands, edge gateways forward aggregated sensor snapshots to cloud object stores, keeping bandwidth costs manageable while still enabling near-real-time analytics.
Shortage of Data-Literate Workforce
Accenture's 2025 survey shows only 21% of employees possess functional data skills, leaving 87% of enterprises struggling to fill analyst roles. The World Economic Forum ranks data analysis among the top five future skills through 2030, yet academic programs are not producing graduates fast enough to meet demand. Rising salaries divert budgets away from platform investments into compensation, sometimes delaying new deployments. Low-code tools help but cannot replace human judgment when reconciling conflicting sources or addressing sampling bias. Companies respond with internal academies and certification stipends, yet ramp-up timelines remain lengthy, extending the adoption curve in the Business Intelligence (BI) market.
Other drivers and restraints analyzed in the detailed report include:
- Mainstream Embedded BI in SaaS Apps
- Data Clean-Room Partnerships
- Up-Front Integration Cost for Legacy Systems
For complete list of drivers and restraints, kindly check the Table Of Contents.
Segment Analysis
Services revenue expanded at a 9.23% CAGR, outpacing the Business Intelligence (BI) market because companies enlist domain experts to design semantic models, optimize query logic, and train citizen analysts. Software and platforms retained 68.73% 2025 revenue as license subscriptions remain foundational, particularly for organizations standardizing on a single visualization layer. Systems integrators differentiate by guaranteeing service-level objectives such as sub-second dashboard latency or 99.9% refresh reliability, monetizing outcome-based contracts rather than billable hours. Managed-service bundles that wrap licenses, cloud infrastructure, and ongoing optimization into usage-based payments reduce capital strain for mid-market buyers, aligning with broader IT shifts toward operating-expense models.
Platform vendors counter competitive pressure by embedding AI copilots that auto-generate visuals and DAX formulas, lowering external consulting needs. Hyperscaler convergence accelerates, as Oracle Autonomous Database and SAP Analytics Cloud combine storage, transformation, and presentation layers to lock in enterprise data estates. Services providers respond by specializing in cross-platform governance, helping multinational clients reconcile multiple BI stacks acquired through mergers. As the Business Intelligence (BI) market size rises, specialist boutiques emerge around vertical use cases such as pharmacovigilance signal detection and retail demand sensing, sustaining a vibrant advisor ecosystem despite platform simplification trends.
The cloud segment accounted for 65.87% of 2025 revenue and is advancing at a 9.54% CAGR through 2031. The cloud implementations segment dominates the market because variable compute and serverless warehousing eliminate idle capacity costs while auto-scaling meets unpredictable analytical surges. Continuous ingestion pipelines feed near-real-time dashboards for e-commerce flash-sale monitoring, a capability historically out of reach for on-premise appliances. Nations such as India and Indonesia require local data processing, prompting hyperscalers to launch in-country regions that meet sovereignty mandates and support further growth of the Business Intelligence (BI) market.
On-premises clusters persist in hospitals and banks that cannot move patient records or credit data off-site due to regulatory constraints, resulting in hybrid architectures where sensitive workloads remain on-premises while customer experience experimentation occurs in the cloud. Multi-cloud strategies spread risk across Amazon Web Services, Microsoft Azure, and Google Cloud Platform but incur egress charges that sometimes eclipse compute costs, prompting interest in zero-egress object stores such as Cloudflare R2. Vendors now integrate cost-optimizer dashboards that model query-level spend, helping finance teams predict invoices and avoid sticker shock.
Complete Report Scope:
- By Component
- Software and Platform
- Services
- By Deployment
- On-Premise
- Cloud
- By End-User Industry
- BFSI
- IT and Telecommunication
- Retail and e-Commerce
- Healthcare
- Manufacturing
- Government and Public Sector
- By Business Model
- Subscription / SaaS License
- Perpetual License
- Freemium / Usage-Based
- Managed Service / BI-as-a-Service
- By Geography
- North America
- United States
- Canada
- Mexico
- South America
- Brazil
- Argentina
- Rest of South America
- Europe
- United Kingdom
- Germany
- France
- Italy
- Spain
- Russia
- Rest of Europe
- Asia-Pacific
- China
- Japan
- India
- South Korea
- Australia and New Zealand
- Southeast Asia
- Rest of Asia-Pacific
- Middle East and Africa
- Middle East
- Saudi Arabia
- United Arab Emirates
- Turkey
- Rest of Middle East
- Africa
- South Africa
- Nigeria
- Kenya
- Rest of Africa
- Middle East
- North America
Geography Analysis
North America captured 39.85% of 2025 revenue thanks to concentrated hyperscaler data centers that keep dashboard round-trip latency below 10 milliseconds. Mature venture-capital ecosystems fund start-ups offering specialized AI copilots that broaden Business Intelligence (BI) market adoption beyond trained analysts. Only 21% of workers hold analytical competency, limiting platform utilization despite abundant technology. Multi-cloud egress charges occasionally surpass compute spend for data-intensive workloads, forcing architectural redesign to co-locate processing and storage.
Asia-Pacific is forecast to log a 10.12% CAGR to 2031 as China targets a 60% digital-economy contribution to GDP by 2025, spurring domestic BI platform investment. India's Digital India program expands broadband and subsidizes cloud adoption, creating greenfield demand for localized analytics solutions. The Association of Southeast Asian Nations projects its digital economy will reach USD 1 trillion by 2030, with e-commerce and fintech sectors spearheading analytics spend. However, divergent privacy frameworks across China, India, and Southeast Asia require region-specific data residencies, inflating vendor compliance costs.
Europe grows steadily as enterprises embed privacy-by-design analytics to satisfy the General Data Protection Regulation, which levied EUR 1.6 billion in fines during 2023. South America witnesses upticks in Brazil and Argentina as firms digitize operations, but currency volatility slows mega-projects. The Middle East and Africa plant early seeds via smart-city programs in the United Arab Emirates and Saudi Arabia, yet infrastructure gaps and skills shortages constrain near-term scale, making partnerships with regional integrators essential.
- Microsoft Corporation
- SAP SE
- Oracle Corporation
- International Business Machines Corporation
- SAS Institute Inc.
- Salesforce Inc.
- Amazon Web Services Inc.
- Google LLC
- QlikTech International AB
- MicroStrategy Incorporated
- Domo Inc.
- TIBCO Software Inc.
- Infor Inc.
- Zoho Corporation Pvt. Ltd.
- Teradata Corporation
- Alteryx Inc.
- Sisense Inc.
- ThoughtSpot Inc.
- Yellowfin International Pty Ltd.
- GoodData Corporation
Additional Benefits:
- The market estimate (ME) sheet in Excel format
- 3 months of analyst support
TABLE OF CONTENTS
1 INTRODUCTION
- 1.1 Study Assumptions and Market Definition
- 1.2 Scope of the Study
2 RESEARCH METHODOLOGY
3 EXECUTIVE SUMMARY
4 MARKET LANDSCAPE
- 4.1 Market Overview
- 4.2 Market Drivers
- 4.2.1 Cloud-First Analytics Adoption
- 4.2.2 Explosion of Semi-Structured IoT Data
- 4.2.3 Mainstream Embedded BI in SaaS Business Apps
- 4.2.4 Data Clean-Room Partnerships in Privacy-First Advertising
- 4.2.5 GPU-Accelerated Query Engines Lowering TCO
- 4.2.6 Rise of Analytics-as-Code and GitOps Practices
- 4.3 Market Restraints
- 4.3.1 Shortage of Data-Literate Workforce
- 4.3.2 Up-Front Integration Cost for Legacy Core Systems
- 4.3.3 Escalating Egress Fees in Multi-Cloud BI Architectures
- 4.3.4 Data-Sovereignty Clampdowns in Emerging Digital-Trade Rules
- 4.4 Industry Supply-Chain Analysis
- 4.5 Regulatory Landscape
- 4.6 Technological Outlook
- 4.7 Impact of Macroeconomic Factors on the Market
- 4.8 Porter's Five Forces Analysis
- 4.8.1 Bargaining Power of Suppliers
- 4.8.2 Bargaining Power of Buyers and Consumers
- 4.8.3 Threat of New Entrants
- 4.8.4 Threat of Substitute Products
- 4.8.5 Intensity of Competitive Rivalry
5 MARKET SIZE AND GROWTH FORECASTS (VALUE)
- 5.1 By Component
- 5.1.1 Software and Platform
- 5.1.2 Services
- 5.2 By Deployment
- 5.2.1 On-Premise
- 5.2.2 Cloud
- 5.3 By End-User Industry
- 5.3.1 BFSI
- 5.3.2 IT and Telecommunication
- 5.3.3 Retail and e-Commerce
- 5.3.4 Healthcare
- 5.3.5 Manufacturing
- 5.3.6 Government and Public Sector
- 5.4 By Business Model
- 5.4.1 Subscription / SaaS License
- 5.4.2 Perpetual License
- 5.4.3 Freemium / Usage-Based
- 5.4.4 Managed Service / BI-as-a-Service
- 5.5 By Geography
- 5.5.1 North America
- 5.5.1.1 United States
- 5.5.1.2 Canada
- 5.5.1.3 Mexico
- 5.5.2 South America
- 5.5.2.1 Brazil
- 5.5.2.2 Argentina
- 5.5.2.3 Rest of South America
- 5.5.3 Europe
- 5.5.3.1 United Kingdom
- 5.5.3.2 Germany
- 5.5.3.3 France
- 5.5.3.4 Italy
- 5.5.3.5 Spain
- 5.5.3.6 Russia
- 5.5.3.7 Rest of Europe
- 5.5.4 Asia-Pacific
- 5.5.4.1 China
- 5.5.4.2 Japan
- 5.5.4.3 India
- 5.5.4.4 South Korea
- 5.5.4.5 Australia and New Zealand
- 5.5.4.6 Southeast Asia
- 5.5.4.7 Rest of Asia-Pacific
- 5.5.5 Middle East and Africa
- 5.5.5.1 Middle East
- 5.5.5.1.1 Saudi Arabia
- 5.5.5.1.2 United Arab Emirates
- 5.5.5.1.3 Turkey
- 5.5.5.1.4 Rest of Middle East
- 5.5.5.2 Africa
- 5.5.5.2.1 South Africa
- 5.5.5.2.2 Nigeria
- 5.5.5.2.3 Kenya
- 5.5.5.2.4 Rest of Africa
- 5.5.5.1 Middle East
- 5.5.1 North America
6 COMPETITIVE LANDSCAPE
- 6.1 Market Concentration
- 6.2 Strategic Moves
- 6.3 Market Share Analysis
- 6.4 Company Profiles (includes Global-Level Overview, Market-Level Overview, Core Segments, Financials as Available, Strategic Information, Market Rank/Share for Key Companies, Products and Services, and Recent Developments)
- 6.4.1 Microsoft Corporation
- 6.4.2 SAP SE
- 6.4.3 Oracle Corporation
- 6.4.4 International Business Machines Corporation
- 6.4.5 SAS Institute Inc.
- 6.4.6 Salesforce Inc.
- 6.4.7 Amazon Web Services Inc.
- 6.4.8 Google LLC
- 6.4.9 QlikTech International AB
- 6.4.10 MicroStrategy Incorporated
- 6.4.11 Domo Inc.
- 6.4.12 TIBCO Software Inc.
- 6.4.13 Infor Inc.
- 6.4.14 Zoho Corporation Pvt. Ltd.
- 6.4.15 Teradata Corporation
- 6.4.16 Alteryx Inc.
- 6.4.17 Sisense Inc.
- 6.4.18 ThoughtSpot Inc.
- 6.4.19 Yellowfin International Pty Ltd.
- 6.4.20 GoodData Corporation
7 MARKET OPPORTUNITIES AND FUTURE OUTLOOK
- 7.1 White-Space and Unmet-Need Assessment

 英國商業智慧:市場佔有率分析、產業趨勢與統計、成長預測(2026-2031)競爭資訊服務:市場佔有率分析、產業趨勢與統計、成長預測(2026-2031 年)行動商業情報:市場佔有率分析、產業趨勢與統計、成長預測(2026-2031)醫療保健商業智慧:市場佔有率分析、行業趨勢和統計數據、成長預測(2026-2031 年)
 商業情報市場-2026-2032年全球市場預測
 全球行動商業情報(BI)市場
 2026-2030年全球醫療保健產業商業智慧市場
 2026年全球行動商業智慧(BI)市場報告2026年全球商業智慧(BI)市場報告
 行動商業智慧(BI) 市場報告:按解決方案、部署模式、企業規模、應用、最終用戶產業和地區分類,2026-2034 年