


 |
市場調查報告書
商品編碼
2113659
美國電力EPC:市場佔有率分析、行業趨勢和統計數據、成長預測(2026-2031年)United States Power EPC - Market Share Analysis, Industry Trends & Statistics, Growth Forecasts (2026 - 2031) |
||||||

※ 本網頁內容可能與最新版本有所差異。詳細情況請與我們聯繫。
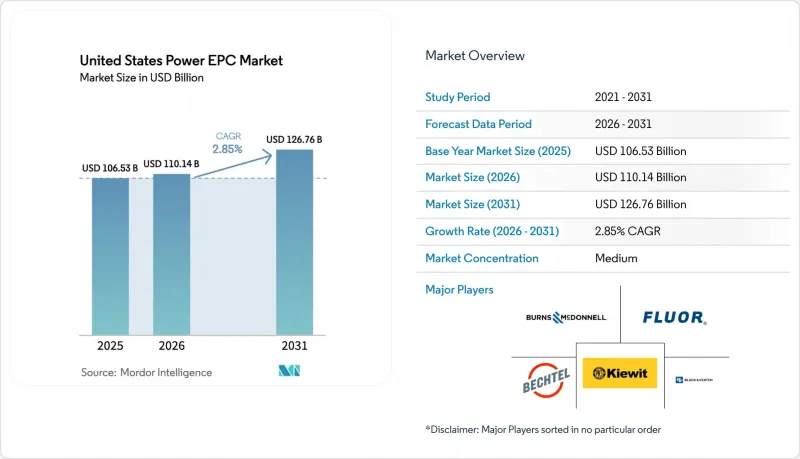
根據 Mordor Intelligence 預測,美國電力 EPC 市場規模將從 2025 年的 1065.3 億美元和 2026 年的 1101.4 億美元成長到 2031 年的 1267.6 億美元,2026 年至 2031 年的年複合成長率(CAGR)為 2.85%。
本報告按發電EPC(技術類型(火力發電、核能、可再生能源)、容量範圍(100兆瓦以下、100-499兆瓦、500兆瓦以上)和終端用戶(受監管的公共產業、獨立發電企業、工業私營發電企業、公共部門和國有企業))以及輸配電EPC進行細分。市場規模和預測以美元計價。
美國電力EPC市場的趨勢與洞察
與《通膨控制法案》相關的清潔能源資本支出(CAPEX)激增,正在大幅改變專案融資的格局。
2024年至2025年間,美國宣布了價值890億美元的清潔能源項目,採購週期已縮短至12-15個月,迫使在美國電力EPC市場運營的EPC公司在債務融資完成前就訂購逆變器和變壓器。與商業營運里程碑掛鉤的違約金擔保意味著進度風險累計直接加重了承包商的資產負債表負擔。國內採購獎勵鼓勵Flür和Kiwitt等供應商採購美國製造的組件,這縮小了供應商的選擇範圍,並使簽訂長期採購協議的公司更具優勢。模組化施工允許現場施工和工廠生產並行進行,因此正日益受到關注,被視為緩解最後時刻交付延誤的一種方式。這些趨勢進一步推動了美國電力EPC市場向承包工程合約的轉變,交鑰匙工程合約既能保證價格,又能獎勵擁有成功施工記錄的公司。
多吉瓦資料中心和綠色氫能的需求不斷成長,推動了EPC(工程、採購和施工)產業的發展。
超大規模業者經常簽署購電協議 (PPA),預計到 2025 年總裝置容量將超過 15 吉瓦。為了避免被列入電力公司的等候名單,他們通常會在鄰近地塊上建造 200-500 兆瓦的太陽能發電和儲能系統。 EPC 總承包商提供包含 20 年供電保障的打包式設計-建造-營運 (DBO) 服務,利潤率高達 12-15%,是典型公用事業規模專案的兩倍。綠色氫能計畫也遵循此模式,預計到 2025 年電解槽產能將達到 2.5 吉瓦。承包工程合約現在將電力島設計與壓縮、儲能和管道連接打包在一起。像 Bechtel、Zachley 和 McDermott 這樣在石化和可再生能源領域都擁有專業知識的公司,在快速成長的美國電力 EPC 市場中保持著競爭優勢。
EPC人員和熟練管理人員的短缺正在給利潤率帶來壓力。
2020年至2025年間,電力建設工人數量減少了12%,而電工、水管工和操作員的薪資卻以每年8%至10%的速度成長。承包商正在加速向成本補償合約轉型,以將工資風險轉移給客戶,但利潤率仍然被壓縮了150至200個基點。模組化已成為美國電力EPC市場的核心競爭優勢,預製設施(例如Barnes & McDonnell公司位於堪薩斯城的20萬平方英尺的工廠)可將現場勞動強度降低25%至30%,並將現場施工週期縮短至12至15個月。
細分市場分析
到2025年,可再生能源將佔發電EPC市場總值的80.8%,預計到2031年,這一佔有率將以5.8%的複合年成長率成長,從而成為美國發電EPC市場中佔比最大的部分。 《通貨膨脹控制法案》(IRA)的獎勵已將太陽能和風能的平準化電力成本(LCOE)降至25-35美元/兆瓦時,對聯合循環燃氣發電的獲利能力構成了壓力。電池儲能將是成長最快的細分市場,獨立式電池儲能系統(BESS)的裝置容量將在2025年達到8吉瓦,這將催生對精通NFPA 855合規性的承包商的需求。隨著符合《瓊斯法案》的船舶投入使用,離岸風電預計在2027年後繼續擴張,但短期利潤仍將小規模。地熱能和小型模組化反應器 (SMR) 等小眾領域將增加經濟多樣性,但在 2030 年之前仍將保持小規模。
到2025年,火力發電支出將佔總支出的15%,但隨著煤炭向天然氣的過渡基本完成,預計其複合年成長率僅為1.2%。同時,核能發電將佔4.2%的佔有率,但其成長主要取決於小型模組化反應器(SMR)的示範和運行許可證的延期。擁有模組化核能發電廠建設和高溫燃氣渦輪機維修經驗的承包商有望獲得附加價值,但他們在美國發電EPC市場整體成長中所佔佔有率仍然很小。
其他好處:
- Excel格式的市場預測(ME)表
- 3個月的分析師支持
目錄
第1章:引言
- 研究假設和市場定義
- 調查範圍
第2章:調查方法
第3章執行摘要
第4章 市場狀況
- 市場概覽
- 設備產能預測
- 初級能源消耗概述
- 市場促進因素
- 由於《通膨控制法》,清潔能源領域的資本投資激增。
- 來自多吉瓦資料中心和綠色氫能的需求不斷成長
- 需要更換已運作超過 40 年的燃煤發電廠。
- 公共產業的脫碳義務超過了再生能源配額制目標
- 與小型模組化反應器相容的工廠周邊設備標準化
- 綠色鋼鐵OEM廠商承包工程承包模式的興起
- 市場限制因素
- EPC人員及施工監工短缺
- 混合動力汽車設備供應鏈中的瓶頸
- ERCOT基於佇列的輸出抑制和電網連接延遲
- 大型企劃預算超支後,擔保債券收緊
- 供應鏈分析
- 監理情勢
- 技術展望
- 波特五力模型
- PESTLE分析
第5章 市場規模與成長預測
- 發電EPC
- 透過技術
- 火力發電
- 核能
- 可再生能源
- 按發電能力範圍
- 小於 100 兆瓦(分散式能源、微電網)
- 100~499 MW
- 500兆瓦或以上
- 最終用戶
- 受監管的公共產業
- 獨立發電機
- 工業私人發電
- 公共部門和國營企業
- 透過技術
- 輸配電 (T&D) EPC
第6章 競爭情勢
- 市場集中度
- 策略趨勢(併購、聯盟、購電協議)
- 市場佔有率分析(主要公司的市場排名和佔有率)
- 公司簡介
- Fluor Corporation
- Bechtel Corporation
- Kiewit Corporation
- Black & Veatch Holdings
- Burns & McDonnell
- Jacobs Engineering Group
- AECOM
- Zachry Group
- McDermott International
- Mortenson Construction
- Gemma Power Systems
- JGC Corporation
- Siemens Energy Inc.
- John Wood Group PLC
- Mitsubishi Power Americas
- Worley
- SNC-Lavalin(AtkinsRealis)
- HDR Inc.
- Skanska USA
- IHI Power Services
第7章 市場機會與未來展望
According to Mordor Intelligence, the United States power EPC market size is projected to expand from USD 106.53 billion in 2025 and USD 110.14 billion in 2026 to USD 126.76 billion by 2031, registering a CAGR of 2.85% between 2026 to 2031.
This report is Segmented by Power Generation EPC [Technology (Thermal, Nuclear, and Renewables), Capacity Band (Up To 100 MW, 100 To 499 MW, and Above 500 MW), and End-User (Regulated Utilities, Independent Power Producers, Industrial Captive Power, and Public Sector and SOE)], and Power Transmission and Distribution (T&D) EPC. The Market Sizes and Forecasts are Provided in Terms of Value (USD).
United States Power EPC Market Trends and Insights
Inflation Reduction Act-Linked Clean-Energy CAPEX Boom Reshapes Project Finance
A cumulative USD 89 billion in clean-energy announcements during 2024-2025 compressed procurement cycles to 12-15 months, requiring EPC firms active in the US power EPC market to order inverters and transformers before debt close. Liquidated-damages bonds linked to commercial-operation milestones now place schedule risk squarely on contractor balance sheets. Domestic-content bonuses encourage suppliers such as Fluor and Kiewit to lock in U.S.-made modules, narrowing vendor pools and favoring firms with long-term purchase agreements. Modular construction that parallelizes site work with factory fabrication is gaining prominence because it mitigates late-stage delivery slippage. These dynamics reinforce a shift toward lump-sum turnkey structures that guarantee price but reward execution certainty across the US power EPC market.
Multi-GW Data-Center and Green-Hydrogen Load Additions Drive Behind-the-Meter EPC
Hyperscale operators signed more than 15 GW of PPAs in 2025, frequently co-locating 200-500 MW solar-plus-storage systems on adjacent parcels to bypass utility queues. EPC contractors are packaging design-build-operate offerings with 20-year availability guarantees, generating 12-15% margins, double typical utility-scale levels. Green-hydrogen projects mirror this model; electrolyzer additions reached 2.5 GW in 2025, and turnkey scopes now bundle power-island design with compression, storage, and pipeline tie-ins. Firms with combined petrochemical and renewable portfolios, such as Bechtel, Zachry, and McDermott, hold an execution advantage in the rapidly expanding US power EPC market.
Scarcity of EPC Labor and Craft Supervision Compresses Margins
The power-construction workforce shrank 12% between 2020 and 2025, triggering 8-10% annual wage inflation for electricians, pipefitters, and operators. Contractors increasingly pivot to cost-reimbursable structures to pass wage risk to owners, yet margin compression still hits 150-200 basis points. Prefabrication facilities, exemplified by Burns & McDonnell's 200,000 ft2 Kansas City plant, lower field-labor intensity by 25-30% and cut onsite schedules to 12-15 months, making modularization central to competitiveness in the US power EPC market.
Other drivers and restraints analyzed in the detailed report include:
- Replacement Wave for Coal Fleet Over 40 Years Old Accelerates Renewable Conversions
- Utility Decarbonization Mandates Beyond RPS Targets Create Captive Demand
- Supply-Chain Bottlenecks for HV Equipment Extend Project Schedules
For complete list of drivers and restraints, kindly check the Table Of Contents.
Segment Analysis
Renewables captured 80.8% of Power Generation EPC value in 2025, and this share is forecast to widen on a 5.8% CAGR through 2031, underpinning the largest slice of the US power generation EPC market size for generation. IRA incentives lower solar and wind LCOE to USD 25-35/MWh, squeezing combined-cycle gas economics. Battery storage turned into the fastest-growing sub-segment as standalone BESS reached 8 GW in 2025, creating a need for contractors versed in NFPA 855 compliance. Offshore wind will expand after 2027 once Jones Act-compliant vessels enter service, although near-term revenue remains modest. Geothermal and SMR niches add diversity but stay sub-scale before 2030.
Thermal generation accounted for 15% of 2025 spend and will inch forward at only 1.2% CAGR because coal-to-gas switching has largely played out, while nuclear sits at 4.2% share and relies mainly on SMR demonstrations and license extensions. Contractors that master modular nuclear construction and high-temperature gas-turbine retrofits stand to capture incremental value but will contribute a smaller fraction to overall US power generation EPC market share growth.
Complete Report Scope:
- Power Generation EPC
- By Technology
- Thermal
- Nuclear
- Renewables
- By Capacity Band
- Up to 100 MW (DER, micro-grid)
- 100 to 499 MW
- Above 500 MW
- By End-User
- Regulated Utilities
- Independent Power Producers
- Industrial Captive Power
- Public Sector and SOE
- By Technology
- Power Transmission and Distribution (T&D) EPC
List of Companies Covered in this Report:
- Fluor Corporation
- Bechtel Corporation
- Kiewit Corporation
- Black & Veatch Holdings
- Burns & McDonnell
- Jacobs Engineering Group
- AECOM
- Zachry Group
- McDermott International
- Mortenson Construction
- Gemma Power Systems
- JGC Corporation
- Siemens Energy Inc.
- John Wood Group PLC
- Mitsubishi Power Americas
- Worley
- SNC-Lavalin (AtkinsRealis)
- HDR Inc.
- Skanska USA
- IHI Power Services
Additional Benefits:
- The market estimate (ME) sheet in Excel format
- 3 months of analyst support
TABLE OF CONTENTS
1 Introduction
- 1.1 Study Assumptions & Market Definition
- 1.2 Scope of the Study
2 Research Methodology
3 Executive Summary
4 Market Landscape
- 4.1 Market Overview
- 4.2 Installed Capacity Outlook
- 4.3 Primary-Energy Consumption Snapshot
- 4.4 Market Drivers
- 4.4.1 Inflation Reduction Act-linked clean-energy CAPEX boom
- 4.4.2 Multi-GW data-center and green-hydrogen load additions
- 4.4.3 Replacement wave for >40-yr coal fleet
- 4.4.4 Utility decarbonization mandates beyond RPS targets
- 4.4.5 SMR-ready balance-of-plant standardization
- 4.4.6 Green-steel OEM turnkey contracting emergence
- 4.5 Market Restraints
- 4.5.1 Scarcity of EPC labor & craft supervision
- 4.5.2 Supply-chain bottlenecks for HV equipment
- 4.5.3 ERCOT queue curtailments & interconnection delays
- 4.5.4 Surety-bond tightening post-megaproject overruns
- 4.6 Supply-Chain Analysis
- 4.7 Regulatory Landscape
- 4.8 Technological Outlook
- 4.9 Porter's Five Forces
- 4.9.1 Bargaining Power of Buyers
- 4.9.2 Bargaining Power of Suppliers
- 4.9.3 Threat of New Entrants
- 4.9.4 Threat of Substitutes
- 4.9.5 Competitive Rivalry
- 4.10 PESTLE Analysis
5 Market Size & Growth Forecasts
- 5.1 Power Generation EPC
- 5.1.1 By Technology
- 5.1.1.1 Thermal
- 5.1.1.2 Nuclear
- 5.1.1.3 Renewables
- 5.1.2 By Capacity Band
- 5.1.2.1 Up to 100 MW (DER, micro-grid)
- 5.1.2.2 100 to 499 MW
- 5.1.2.3 Above 500 MW
- 5.1.3 By End-User
- 5.1.3.1 Regulated Utilities
- 5.1.3.2 Independent Power Producers
- 5.1.3.3 Industrial Captive Power
- 5.1.3.4 Public Sector and SOE
- 5.1.1 By Technology
- 5.2 Power Transmission and Distribution (T&D) EPC
6 Competitive Landscape
- 6.1 Market Concentration
- 6.2 Strategic Moves (M&A, Partnerships, PPAs)
- 6.3 Market Share Analysis (Market Rank/Share for key companies)
- 6.4 Company Profiles (includes Global level Overview, Market level overview, Core Segments, Financials as available, Strategic Information, Products & Services, and Recent Developments)
- 6.4.1 Fluor Corporation
- 6.4.2 Bechtel Corporation
- 6.4.3 Kiewit Corporation
- 6.4.4 Black & Veatch Holdings
- 6.4.5 Burns & McDonnell
- 6.4.6 Jacobs Engineering Group
- 6.4.7 AECOM
- 6.4.8 Zachry Group
- 6.4.9 McDermott International
- 6.4.10 Mortenson Construction
- 6.4.11 Gemma Power Systems
- 6.4.12 JGC Corporation
- 6.4.13 Siemens Energy Inc.
- 6.4.14 John Wood Group PLC
- 6.4.15 Mitsubishi Power Americas
- 6.4.16 Worley
- 6.4.17 SNC-Lavalin (AtkinsRealis)
- 6.4.18 HDR Inc.
- 6.4.19 Skanska USA
- 6.4.20 IHI Power Services
7 Market Opportunities & Future Outlook
- 7.1 White-space & Unmet-Need Assessment

 石油及天然氣EPC市場規模、佔有率、成長、全球產業分析、區域趨勢及2026-2034年預測
 泰國電力EPC:市場佔有率分析、產業趨勢與統計及成長預測(2026-2031年)菲律賓發電EPC:市場佔有率分析、產業趨勢與統計及成長預測(2026-2031年)越南電力EPC:市場佔有率分析、產業趨勢與統計及成長預測(2026-2031年)
 電力EPC市場規模、佔有率和成長分析:按電源、服務類型、專案類型、應用、最終用戶、合約類型和地區分類-2026-2033年產業預測英國電力EPC:市場佔有率分析、產業趨勢與統計、成長預測(2026-2031年)
 電力EPC市場-全球產業規模、佔有率、趨勢、機會、預測:按類型、組件、地區和競爭對手分類,2021-2031年
 工程師/ EPC-E的參與
 電力EPC市場(涵蓋發電廠和輸配電基礎設施):按發電方式、服務、設備和區域分類
 2026年全球電力EPC市場報告