

 |
市場調查報告書
商品編碼
2061553
英國電力EPC:市場佔有率分析、產業趨勢與統計、成長預測(2026-2031年)United Kingdom Power EPC - Market Share Analysis, Industry Trends & Statistics, Growth Forecasts (2026 - 2031) |
||||||
※ 本網頁內容可能與最新版本有所差異。詳細情況請與我們聯繫。
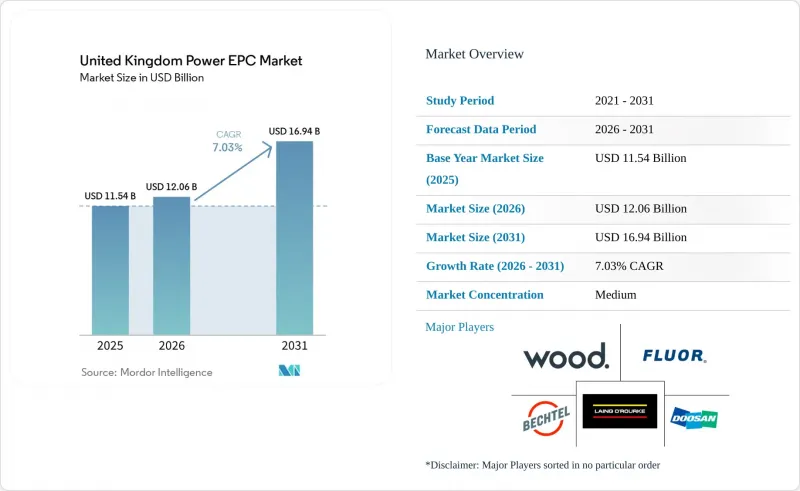
據 Mordor Intelligence 稱,英國電力 EPC 市場預計在 2026 年價值 120.6 億美元,預計到 2031 年將達到 169.4 億美元,在預測期(2026-2031 年)內以 7.03% 的複合年成長率成長。
本報告按電力EPC(工程、採購、施工)領域進行細分:技術類型(火力發電、核能、可再生能源)、容量範圍(100MW以下、100-499MW、500MW以上)和最終用戶(受監管的公共產業公司、獨立發電公司、工業私營發電企業、公共部門和國有企業),以及最終用戶(受監管的公用事業公司、獨立發電公司、工業私營發電企業、公共部門和國有企業),以及新輸配電EPC。市場規模和預測均以美元計價。
英國電力EPC市場的趨勢與洞察
英國離岸風電大型企劃管道
在蘇格蘭風能計畫(ScotWind)下,海底權益已獲批,涵蓋17個項目,總合裝置容量約30吉瓦;同時,英國皇家地產公司(Crown Estate)第五輪核准將為凱爾特海新增4.5吉瓦的浮體式發電裝置容量。這些新增裝置容量遠超過目前已投入運作的14吉瓦,壓縮了生產週期,並推動了對渦輪機基礎和輸電電纜的需求。例如,沃旭能源(Orsted)的2.9吉瓦Hornsea 3專案需要200多台渦輪機和超過100公里的海底電纜,這充分體現了規模化發展的趨勢。浮動式風力發電原型在動態電纜和錨碇方面面臨許多挑戰,因此,擁有深海油氣天然氣田經驗的承包商更具優勢。清潔能源2030行動計畫下的電網改革已將備用時間縮短一半至不到2.5年,加速了EPC合約的簽訂。預計所有這些因素將使可再生能源EPC的複合年成長率達到12.8%。
在塞茲韋爾C核電廠最終投資決定(FID)做出後,新建設的核能建設恢復進行。
2025年7月,一項價值381億美元的塞茲韋爾C核電廠投資項目獲得批准。這是自2016年以來首個大型核能發電廠的最終投資決定(FID)。受監管資產基礎(RAB)模式透過將建設風險轉移給消費者來降低資本成本,並擴大了EPC(工程、採購和施工)工作的範圍,包括土木工程、核子反應爐廠房製造和汽輪機房整合。斗山巴布科克公司和安薩爾多核能公司是領先的競標者。政府設定的24吉瓦核能發電目標意味著將新增6至8座核子反應爐或小型模組化反應器(SMR),這將使EPC工作持續數十年。長達10至12年的建設週期將使累計持續到2030年代,為能夠妥善應對核能監管局監管的承包商帶來顯著收益。
通貨膨脹導致EPC成本超支。
2024年建築材料價格較去年同期上漲5.6%,技術純熟勞工的人事費用上漲6.2%。 2022年至2023年間簽訂的固定價格離岸風力發電契約,由於鋼材價格和航運運費已超過其指數掛鉤條款,利潤率正面臨壓力。欣克利角C核電廠的預算已從最終投資決定(FID)時的330億美元飆升至2025年的445億美元。承包商正轉向成本削減模式,這雖然降低了執行風險,但也削弱了他們的競爭力。
細分市場分析
預計到2025年,可再生能源將佔電力EPC市場規模的76.3%,主要驅動力是離岸風力發電,預計2031年將以12.8%的複合年成長率成長。蘇格蘭風電計畫(ScotWind)和凱爾特海計畫(Celtic Sea)的特許經營需要超過400億英鎊(508億美元)的EPC投資。第六次差價合約(CfD)競標以創紀錄的最低成交價分配了9.6吉瓦的裝置容量,增強了成本競爭力。自2016年以來一直停滯不前的核能EPC收入有望隨著塞茲韋爾C核電廠最終投資決定(FID)的做出而復甦,該項目本身就新增了3.2吉瓦的裝置容量。隨著燃煤發電廠逐步淘汰,火力發電EPC計畫規模不斷縮小,天然氣計畫在容量市場面臨貶值,而由200億英鎊CCUS計畫資助的捕碳封存(CCUS)維修計畫則維持著一個狹窄的利基市場。
至2025年,裝置容量超過500兆瓦的專案將佔EPC總裝置容量的63.6%,其中以Hornsea 3、Hornsea 4和Doggerbank專案群主導。吉瓦級離岸風力發電電場利用渦輪機採購和最佳化海上物流的規模經濟優勢,但其8-10年的開發週期增加了監管風險。 100-499兆瓦裝機容量頻寬的成長較為緩慢,因為土地資源限制了陸上風電和太陽能發電場址的建設。
預計裝置容量低於100兆瓦的設施將以9.1%的複合年成長率(CAGR)實現最高成長,這主要得益於企業部署用戶側太陽能發電和儲能系統以及港口微電網。蒂斯賽德自由港的「淨零叢集」展示了一種模組化能源園區模式,在一個裝置容量低於100兆瓦的場地內整合了氫能、碳捕獲和熱電聯產技術。英國天然氣和電力市場管理局(Ofgem)的區域靈活性市場獎勵分散式資源,從而改善了由1000萬英鎊社區能源基金支持的區域能源計劃的項目經濟效益。
其他好處:
- Excel格式的市場預測(ME)表
- 3個月的分析師支持
目錄
第1章:引言
- 研究假設和市場定義
- 調查範圍
第2章:調查方法
第3章執行摘要
第4章 市場狀況
- 市場概覽
- 設備產能預測
- 初級能源消耗概述
- 市場促進因素
- 英國離岸風電大型企劃管道
- 在塞茲韋爾C核電廠最終投資決定(FID)做出後,新建設的核能建設恢復進行。
- 更換老舊火力發電設備的義務
- 快速資金籌措以加強電網(RIIO-T3)
- 與公司淨零排放承諾掛鉤的購電協議
- 英國港口正在採用模組化「能源園區」的概念。
- 市場限制因素
- 通貨膨脹導致EPC成本超支。
- 高壓設備進口供應鏈瓶頸
- 民眾反對陸上輸電走廊
- 供應鏈分析
- 監理情勢
- 技術展望
- 波特五力模型
- PESTLE分析
第5章 市場規模與成長預測
- 電力EPC
- 透過技術
- 火力發電
- 核能
- 可再生能源
- 按發電能力範圍
- 小於 100 兆瓦(分散式能源 (DER)、微電網)
- 100~499 MW
- 超過500兆瓦
- 最終用戶
- 監理效用
- 獨立發電機
- 工業私人發電
- 公共部門和國營企業
- 透過技術
- 輸配電 (T&D) EPC
第6章 競爭情勢
- 市場集中度
- 策略趨勢(併購、聯盟、購電協議)
- 市場佔有率分析(主要公司的市場排名和佔有率)
- 公司簡介
- Fluor Ltd
- Wood plc
- Bechtel Corp
- Doosan Babcock Ltd
- Ramboll UK Ltd
- Laing O'Rourke
- Orsted A/S
- Balfour Beatty
- General Electric Co.
- Siemens Energy AG
- ABB Ltd
- Hitachi Energy Ltd
- Prysmian Group
- Ansaldo Nuclear Ltd
- Mott MacDonald Ltd
- Kier Infrastructure
- Bouygues Energies & Services
- Vinci Energies UK
- Skanska UK
- Engie Solutions UK
第7章 市場機會與未來展望
According to Mordor Intelligence, the united kingdom power ePC market size is estimated at USD 12.06 billion in 2026, and is expected to reach USD 16.94 billion by 2031, at a CAGR of 7.03% during the forecast period (2026-2031).
This report is Segmented by Power Generation EPC [Technology (Thermal, Nuclear, and Renewables), Capacity Band (Up To 100 MW, 100 To 499 MW, and Above 500 MW), and End-User (Regulated Utilities, Independent Power Producers, Industrial Captive Power, and Public Sector and SOE)], and Power Transmission and Distribution (T&D) EPC. The Market Sizes and Forecasts are Provided in Terms of Value (USD).
United Kingdom Power EPC Market Trends and Insights
UK Offshore-Wind Megaproject Pipeline
Seabed rights awarded under ScotWind cover 17 projects totaling about 30 gigawatts, while Crown Estate Round 5 adds up to 4.5 gigawatts of floating capacity in the Celtic Sea. These allocations dwarf the 14 gigawatts already operating, compressing fabrication schedules and boosting demand for turbine foundations and export cables. Projects such as Orsted's 2.9-gigawatt Hornsea 3 require more than 200 turbines and over 100 kilometers of subsea cable, illustrating the scale shift. Floating-wind prototypes introduce dynamic-cable and mooring challenges that favor contractors with deepwater oil-and-gas experience. Grid reforms under the Clean Power 2030 Action Plan halve queue times to under 2.5 years, accelerating EPC contract awards. Together, these forces underpin the 12.8% CAGR forecast for renewables EPC.
Nuclear New-Build Revival Post-Sizewell C FID
July 2025 marked the USD 38.1 billion commitment to Sizewell C, the first large-scale nuclear FID since 2016. The Regulated Asset Base model transfers construction risk to consumers, cutting the cost of capital and unlocking EPC scopes covering civil works, reactor-island fabrication, and turbine-hall integration. Doosan Babcock and Ansaldo Nuclear are shortlisted for major packages. The government's 24-gigawatt nuclear target implies six to eight additional reactors or an SMR fleet, sustaining multidecade EPC workloads. Extended construction cycles of 10-12 years mean revenue recognition will carry well into the 2030s, rewarding contractors that navigate Office for Nuclear Regulation oversight.
Inflation-Driven EPC Cost Overruns
Construction input prices rose 5.6% year-over-year in 2024, while skilled labor costs climbed 6.2%. Fixed-price offshore-wind contracts signed in 2022-2023 now face margin compression as steel and marine-vessel rates exceed indexed clauses. Hinkley Point C's budget climbed from USD 33 billion at FID to USD 44.5 billion by 2025. Contractors are shifting toward cost-reimbursable models, easing execution risk but eroding bid competitiveness.
Other drivers and restraints analyzed in the detailed report include:
- Fast-Track Grid-Reinforcement Funding (RIIO-T3)
- PPAs Tied to Corporate Net-Zero Pledges
- Supply-Chain Bottlenecks in High-Voltage Equipment Imports
For complete list of drivers and restraints, kindly check the Table Of Contents.
Segment Analysis
Renewables captured 76.3% of 2025 generation EPC value and are projected to grow at a 12.8% CAGR through 2031, driven chiefly by offshore wind. ScotWind and Celtic Sea concessions require EPC outlays above GBP 40 billion (USD 50.8 billion). The sixth Contracts for Difference (CfD) round awarded 9.6 gigawatts at record-low strike prices, reinforcing cost competitiveness. Nuclear EPC revenue, dormant since 2016, resurged with the Sizewell C FID, which alone adds 3.2 gigawatts of capacity. Thermal EPC shrinks as coal retires and gas projects face capacity-market de-rating, though carbon-capture retrofits preserve a narrow niche funded by the GBP 20 billion CCUS program.
Projects exceeding 500 megawatts held 63.6% of the 2025 EPC value, dominated by Hornsea 3, Hornsea 4, and the Dogger Bank complex. Gigawatt-scale offshore arrays leverage turbine-procurement scale and optimized marine logistics yet endure 8-10-year development cycles that heighten regulatory risk. The 100-to-499-megawatt band grows moderately as land constraints cap onshore wind and solar acreage.
Installations up to 100 megawatts will post the fastest 9.1% CAGR as corporates deploy behind-the-meter solar-plus-storage and port-based microgrids. Teesside Freeport's Net Zero cluster demonstrates a modular energy-park model integrating hydrogen, carbon capture, and combined-heat-and-power within a sub-100-megawatt footprint. Ofgem's local flexibility markets compensate distributed resources, improving project economics for community-energy schemes backed by the GBP 10 million Community Energy Fund.
List of Companies Covered in this Report:
- Fluor Ltd
- Wood plc
- Bechtel Corp
- Doosan Babcock Ltd
- Ramboll UK Ltd
- Laing O'Rourke
- Orsted A/S
- Balfour Beatty
- General Electric Co.
- Siemens Energy AG
- ABB Ltd
- Hitachi Energy Ltd
- Prysmian Group
- Ansaldo Nuclear Ltd
- Mott MacDonald Ltd
- Kier Infrastructure
- Bouygues Energies & Services
- Vinci Energies UK
- Skanska UK
- Engie Solutions UK
Additional Benefits:
- The market estimate (ME) sheet in Excel format
- 3 months of analyst support
TABLE OF CONTENTS
1 Introduction
- 1.1 Study Assumptions & Market Definition
- 1.2 Scope of the Study
2 Research Methodology
3 Executive Summary
4 Market Landscape
- 4.1 Market Overview
- 4.2 Installed Capacity Outlook
- 4.3 Primary-Energy Consumption Snapshot
- 4.4 Market Drivers
- 4.4.1 UK offshore-wind megaproject pipeline
- 4.4.2 Nuclear new-build revival post-Sizewell C FID
- 4.4.3 Ageing thermal fleet repowering mandates
- 4.4.4 Fast-track grid-reinforcement funding (RIIO-T3)
- 4.4.5 PPAs tied to corporate net-zero pledges
- 4.4.6 Modular "energy-park" concepts adopted by UK ports
- 4.5 Market Restraints
- 4.5.1 Inflation-driven EPC cost overruns
- 4.5.2 Supply-chain bottlenecks in HV equipment imports
- 4.5.3 Public opposition to on-shore transmission corridors
- 4.6 Supply-Chain Analysis
- 4.7 Regulatory Landscape
- 4.8 Technological Outlook
- 4.9 Porter's Five Forces
- 4.9.1 Threat of New Entrants
- 4.9.2 Bargaining Power of Suppliers
- 4.9.3 Bargaining Power of Buyers
- 4.9.4 Threat of Substitutes
- 4.9.5 Competitive Rivalry
- 4.10 PESTLE Analysis
5 Market Size & Growth Forecasts
- 5.1 Power Generation EPC
- 5.1.1 By Technology
- 5.1.1.1 Thermal
- 5.1.1.2 Nuclear
- 5.1.1.3 Renewables
- 5.1.2 By Capacity Band
- 5.1.2.1 Up to 100 MW (DER, micro-grid)
- 5.1.2.2 100 to 499 MW
- 5.1.2.3 Above 500 MW
- 5.1.3 By End-User
- 5.1.3.1 Regulated Utilities
- 5.1.3.2 Independent Power Producers
- 5.1.3.3 Industrial Captive Power
- 5.1.3.4 Public Sector and SOE
- 5.1.1 By Technology
- 5.2 Power Transmission and Distribution (T&D) EPC
6 Competitive Landscape
- 6.1 Market Concentration
- 6.2 Strategic Moves (M&A, Partnerships, PPAs)
- 6.3 Market Share Analysis (Market Rank/Share for key companies)
- 6.4 Company Profiles (includes Global level Overview, Market level overview, Core Segments, Financials as available, Strategic Information, Products & Services, and Recent Developments)
- 6.4.1 Fluor Ltd
- 6.4.2 Wood plc
- 6.4.3 Bechtel Corp
- 6.4.4 Doosan Babcock Ltd
- 6.4.5 Ramboll UK Ltd
- 6.4.6 Laing O'Rourke
- 6.4.7 Orsted A/S
- 6.4.8 Balfour Beatty
- 6.4.9 General Electric Co.
- 6.4.10 Siemens Energy AG
- 6.4.11 ABB Ltd
- 6.4.12 Hitachi Energy Ltd
- 6.4.13 Prysmian Group
- 6.4.14 Ansaldo Nuclear Ltd
- 6.4.15 Mott MacDonald Ltd
- 6.4.16 Kier Infrastructure
- 6.4.17 Bouygues Energies & Services
- 6.4.18 Vinci Energies UK
- 6.4.19 Skanska UK
- 6.4.20 Engie Solutions UK
7 Market Opportunities & Future Outlook
- 7.1 White-Space & Unmet-Need Assessment
 電力EPC市場-全球產業規模、佔有率、趨勢、機會、預測:按類型、組件、地區和競爭對手分類,2021-2031年
 工程師/ EPC-E的參與
 石油和天然氣EPC市場規模、佔有率、成長和全球產業分析:按類型、應用和地區分類,並對2026-2034年進行預測
 電力EPC市場(涵蓋發電廠和輸配電基礎設施):按發電方式、服務、設備和區域分類
 2026年全球電力EPC市場報告
 日本油氣EPC市場規模、佔有率、趨勢和預測:按行業、服務類型、位置和地區分類,2026-2034年石油天然氣EPC市場報告:按產業、服務類型、地區和區域分類(2026-2034年)石油天然氣EPC市場-全球產業規模、佔有率、趨勢、機會、預測:按服務類型、地點、最終用戶、地區和競爭格局分類,2021-2031年日本電力EPC市場規模、佔有率、趨勢及按類型和地區分類的預測(2026-2034年)
 石油天然氣EPC市場規模、佔有率和成長分析(按合約、最終用戶、應用和地區分類)—產業預測(2026-2033年)