


 |
市場調查報告書
商品編碼
2113191
越南電力EPC:市場佔有率分析、產業趨勢與統計及成長預測(2026-2031年)Vietnam Power EPC - Market Share Analysis, Industry Trends & Statistics, Growth Forecasts (2026 - 2031) |
||||||

※ 本網頁內容可能與最新版本有所差異。詳細情況請與我們聯繫。
據 Mordor Intelligence 稱,越南電力 EPC 市場規模在 2026 年估計為 77.9 億美元,預計在預測期(2026-2031 年)內將以 13.83% 的複合年成長率成長,到 2031 年達到 148.9 億美元。
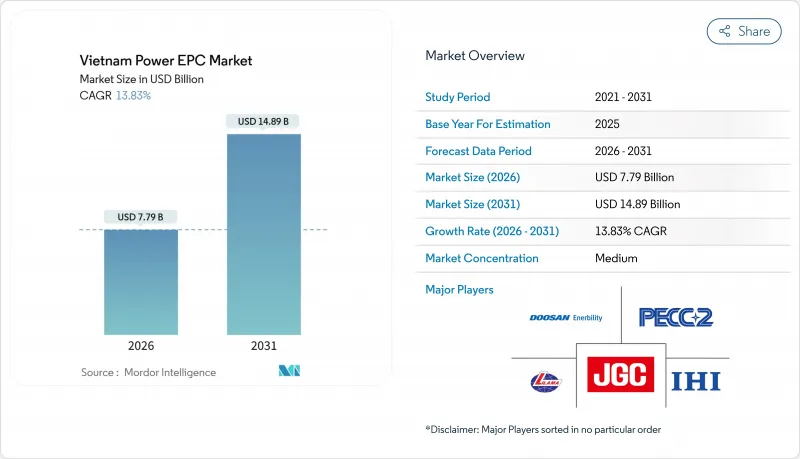
本報告將電力工程總承包(EPC)分為兩類:發電EPC(按技術類型分類,包括火力發電、核能和可再生能源;按容量範圍分類,包括100兆瓦以下、100-499兆瓦和500兆瓦以上;按終端用戶市場規模和預測均以美元計價。
越南電力EPC市場的趨勢與洞察
工業和住宅用電需求快速成長
越南的電力消耗量從2024年的257太瓦時(TWh)增加到2025年的280太瓦時(TWh)。工業用戶佔新增需求的58%,主要受北部省份新建製造廠和資料中心運作的推動。住宅需求增加了6.2%,原因是河內和胡志明市的空調普及率超過70%,以及電動摩托車夜間充電尖峰時段負載達到1.2吉瓦(GW)。持續成長的需求迫使電力公司和獨立發電商(IPP)加快擴大基本負載發電能力,而電網限制則促使工業園區轉向自發電,從而將越南的電力EPC市場分類為公用事業規模和後表計量兩個部分。在北寧和海防的出口加工區,2025年發生了47起意外停電事故,促使跨國公司在其租賃協議中加入確保現場備用發電能力的條款。政府計劃在 2027 年為所有農村家庭提供電力,這將涉及將配電網路升級 3.5 吉瓦,並創造低壓設施的補充性 EPC 需求。
修訂後的《電力發展規劃(PDP)8》:擴大發電和輸配電設施資本投資計劃
2024年核准的第八個電力發展計畫(PDP 8)最終版將2030年裝置容量目標提高至150吉瓦,比草案增加30吉瓦,並撥款180億美元用於建設一條500千伏輸電線路,將離岸風力發電從中南部沿海地區輸送至紅河Delta。該政策也旨在2030年逐步淘汰8.6吉瓦的亞臨界燃煤發電廠,並設定15吉瓦的液化天然氣(LNG)裝置容量目標,以確保對更清潔火力發電資產的EPC需求達到兩位數成長。離岸風電裝置容量從6吉瓦增加到10吉瓦,反映了電網成本社會化後淺水區均衡發電成本的預期下降。一項新的「電網優先」規則規定,在電力公司(EVN)確認變電站可用性之前,發電工程發電工程。亞洲開發銀行(亞銀)於 2025 年簽署的 25 億美元優惠融資方案將使 500 千伏項目的加權平均資本成本降低至 7.2%,使承包商能夠更積極地競標。
電網擁塞和減產風險正在推高該專案的內部收益率。
2025年上半年,南部各省太陽能和風能發電的平均棄電率達18%,導致500千伏輸電線路超負荷運作,造成1240吉瓦時的發電量損失。由於Tuan Nam-Phuoc Long輸電線路的維修工作延誤,營運商被迫在87天內限制2.1吉瓦的太陽能發電量,導致發電公司損失3,100萬美元的收入。開發商目前預計棄電率將達到12-15%,這將使平準化度電成本(LCOE)每兆瓦時增加6-8美元,並導致股本(IRR)低於區域基準水準。擁有剩餘容量的變電站周邊土地的交易價格比擁塞區的土地高出40-60%,這使得開發平臺被分割成小規模專案。 EVN計畫投資62億美元的南方電網計畫要到2028-2029年才能緩解堵塞,預計這將抑制其在此期間的年度EPC訂單價值。
細分市場分析
到2025年,可再生能源將佔越南發電EPC市場佔有率的68.5%,預計到2031年將以15.3%的複合年成長率成長,這主要得益於離岸風力發電從探勘階段進入實施階段,其中以總投資136億美元的3.5吉瓦拉甘區塊和2.1吉瓦海龍區塊為首吉瓦海龍區塊為首。火力發電(主要為液化天然氣複合循環燃氣渦輪機)佔剩餘的31.5%,但仍是越基本負載供應的基石,農曲核電廠3號和4號機組的9HA.02型燃氣渦輪機效率高達64%。
離岸風電設計複雜,包括25-40公尺深的單樁基礎和80-120公里長的220千伏海底輸電線路,導致其EPC成本高達每千瓦3200-3800美元,遠高於公用事業規模太陽能發電的每千瓦650-750美元。隨著金融機構退出煤炭項目,火力發電EPC的佔有率正在下降。 2024年至2025年間,全球17家銀行採取了無煤政策,迫使600兆瓦廣竹一號電廠維修計畫在設計階段中期從煤炭轉向液化天然氣。儘管如此,為確保電網穩定,越南第八版電力發展計畫(PDP 8)將2030年可再生能源採用率限制在47%,這意味著到2031年,火力發電EPC仍將至少佔越南發電EPC市場價值的四分之一。
其他好處:
- Excel格式的市場預測(ME)表
- 3個月的分析師支持
目錄
第1章:引言
- 研究假設和市場定義
- 調查範圍
第2章:調查方法
第3章執行摘要
第4章 市場狀況
- 市場概覽
- 市場促進因素
- 工業和住宅用電需求快速成長
- 修訂版PDP 8:大型發電設施與電網資本支出規劃
- 液化發電工程的激增導致天然氣相關EPC訂單積壓量增加。
- DPPA框架支持商業和工業可再生能源的擴張。
- 強制增加儲能設備(超過 10%/2 小時)擴大了 BESS 的 EPC(工程、採購和施工)工作範圍。
- 針對風能和太陽能發電設備及EPC服務的在地採購獎勵。
- 市場限制因素
- 電網擁塞和減產風險正在推高該專案的內部收益率。
- 上網電價補貼政策(FIT)的追溯性修訂正在削弱投資人信心。
- 高壓和海上建設項目缺乏熟練的EPC人員
- 對EVN在長期購電協議中的信用風險的擔憂
- 供應鏈分析
- 監理情勢
- 技術展望
- 波特五力模型
- PESTLE分析
第5章 市場規模與成長預測
- 發電EPC
- 透過技術
- 火力發電
- 核能
- 可再生能源
- 按發電能力範圍
- 小於 100 兆瓦(分散式能源、微電網)
- 100~499 MW
- 超過500兆瓦
- 最終用戶
- 受監管的公共產業
- 獨立發電機
- 工業私人發電
- 公共部門和國營企業
- 透過技術
- 輸配電 (T&D) EPC
第6章 競爭情勢
- 市場集中度
- 策略趨勢(併購、聯盟、購電協議)
- 市場佔有率分析(主要公司的市場排名和佔有率)
- 公司簡介
- JGC Vietnam Co. Ltd.
- IHI Infrastructure Systems Co. Ltd.
- Lilama Corporation
- Doosan Enerbility Co. Ltd.
- Toshiba Corporation
- AES Corporation
- CTCI Corporation
- PALMA Group Vietnam
- Power Engineering Consulting JSC 2(PECC2)
- Vietnam Electricity Construction JSC(VNECO)
- Siemens Energy AG
- GE Vernova
- PetroVietnam Power Corporation(PV Power)
- PetroVietnam Gas JSC(PV Gas)
- Samsung C&T Corp.
- Vestas Wind Systems A/S
- PC1 Group JSC
- Mitsubishi Power Ltd.
- Orsted A/S
- Copenhagen Infrastructure Partners
第7章 市場機會與未來展望
According to Mordor Intelligence, the Vietnam power EPC market size is estimated at USD 7.79 billion in 2026, and is expected to reach USD 14.89 billion by 2031, at a CAGR of 13.83% during the forecast period (2026-2031).
This report is Segmented by Power Generation EPC [Technology (Thermal, Nuclear, and Renewables), Capacity Band (Up To 100 MW, 100 To 499 MW, and Above 500 MW), and End-User (Regulated Utilities, Independent Power Producers, Industrial Captive Power, and Public Sector and SOE)], and Power Transmission and Distribution (T&D) EPC. The Market Sizes and Forecasts are Provided in Terms of Value (USD).
Vietnam Power EPC Market Trends and Insights
Rapid Industrial & Residential Load Growth
Vietnam's electricity consumption climbed to 280 TWh in 2025, up from 257 TWh in 2024, with industrial users supplying 58% of incremental demand as new fabrication plants and data centers came online in northern provinces. Residential demand expanded 6.2% on air-conditioning penetration topping 70% in Hanoi and Ho Chi Minh City, and on 1.2 GW of evening-peak charging load from electric two-wheelers. Sustained load growth forces utilities and IPPs to fast-track baseload additions, yet transmission constraints push industrial parks toward captive generation, fragmenting the Vietnam power EPC market into utility-scale and behind-the-meter segments. Export-processing zones in Bac Ninh and Hai Phong logged 47 unplanned outages in 2025, prompting multinationals to stipulate on-site backup capacity in lease contracts. The government plans to electrify all rural households by 2027, adding 3.5 GW of distribution upgrades, creating auxiliary EPC demand for low-voltage equipment.
Revised PDP 8 Upsizing Generation & Grid CAPEX Pipeline
The final Power Development Plan 8, approved in 2024, lifts the 2030 installed-capacity target to 150 GW, 30 GW more than the draft, and earmarks USD 18 billion for 500 kV corridors that will move offshore wind from the south-central coast to the Red River Delta. The policy retires 8.6 GW of subcritical coal by 2030 and sets a 15 GW LNG target, sustaining a double-digit EPC trajectory for cleaner thermal assets. Offshore wind allocation climbs from 6 GW to 10 GW, reflecting lower levelized costs in shallow-water sites once grid costs are socialized. A new "grid-first" rule means generation projects cannot reach financial close until EVN confirms substation availability, front-loading T&D EPC awards, and lengthening generation timelines. An Asian Development Bank USD 2.5 billion concessional loan package, signed in 2025, lowers weighted-average capital costs for 500 kV projects to 7.2%, allowing contractors to bid more aggressively.
Grid Congestion & Curtailment Risk Inflating Project IRRs
Solar and wind curtailment averaged 18% in southern provinces during H1 2025, equal to 1,240 GWh of lost output as 500 kV lines operated above rated capacity. Delays to the Thuan Nam-Phuoc Long upgrade forced operators to trim 2.1 GW of solar on 87 days, wiping USD 31 million from generator revenues. Developers now model 12-15% curtailment when pricing PPAs, pushing LCOE up USD 6-8 per MWh and squeezing equity IRRs below regional benchmarks. Land near spare-capacity substations trades 40-60% higher than parcels in congested zones, fragmenting the pipeline into smaller deals. EVN's USD 6.2 billion southern transmission plan will not relieve congestion until 2028-2029, suppressing annual EPC awards in the interim.
Other drivers and restraints analyzed in the detailed report include:
- Surge in LNG-to-Power Projects Unlocking Gas EPC Backlog
- DPPA Framework Catalyzing C&I Renewable Build-Outs
- Retroactive FIT Revisions Eroding Investor Confidence
For complete list of drivers and restraints, kindly check the Table Of Contents.
Segment Analysis
Renewables commanded 68.5% of Vietnam's power generation EPC market share in 2025 and are set to expand at a 15.3% CAGR through 2031 as offshore wind shifts from study to execution, led by the 3.5 GW La Gan and 2.1 GW Hai Long blocks valued at USD 13.6 billion. Thermal capacity, primarily LNG-fired CCGT, occupied the remaining 31.5% but still anchors baseload with 9HA.02 turbines delivering 64% efficiency at Nhon Trach 3 & 4.
Offshore wind's engineering complexity, monopile foundations in 25-40 meter depths, and 220 kV subsea links of 80-120 kilometers, keep EPC costs at USD 3,200-3,800 per kW, far above utility-scale solar at USD 650-750 per kW. Thermal EPC share slips as financiers exit coal; 17 global banks adopted coal-exclusion policies during 2024-2025, forcing the 600 MW Quang Trach I upgrade to convert from coal to LNG mid-design. Still, PDP 8 caps renewable penetration at 47% by 2030 for grid stability, ensuring thermal EPC holds at least one-quarter of Vietnam's power generation EPC market value through 2031.
Complete Report Scope:
- Power Generation EPC
- By Technology
- Thermal
- Nuclear
- Renewables
- By Capacity Band
- Up to 100 MW (DER, micro-grid)
- 100 to 499 MW
- Above 500 MW
- By End-User
- Regulated Utilities
- Independent Power Producers
- Industrial Captive Power
- Public Sector and SOE
- By Technology
- Power Transmission and Distribution (T&D) EPC
List of Companies Covered in this Report:
- JGC Vietnam Co. Ltd.
- IHI Infrastructure Systems Co. Ltd.
- Lilama Corporation
- Doosan Enerbility Co. Ltd.
- Toshiba Corporation
- AES Corporation
- CTCI Corporation
- PALMA Group Vietnam
- Power Engineering Consulting JSC 2 (PECC2)
- Vietnam Electricity Construction JSC (VNECO)
- Siemens Energy AG
- GE Vernova
- PetroVietnam Power Corporation (PV Power)
- PetroVietnam Gas JSC (PV Gas)
- Samsung C&T Corp.
- Vestas Wind Systems A/S
- PC1 Group JSC
- Mitsubishi Power Ltd.
- Orsted A/S
- Copenhagen Infrastructure Partners
Additional Benefits:
- The market estimate (ME) sheet in Excel format
- 3 months of analyst support
TABLE OF CONTENTS
1 Introduction
- 1.1 Study Assumptions & Market Definition
- 1.2 Scope of the Study
2 Research Methodology
3 Executive Summary
4 Market Landscape
- 4.1 Market Overview
- 4.2 Market Drivers
- 4.2.1 Rapid industrial & residential load growth
- 4.2.2 Revised PDP 8 upsizing generation & grid CAPEX pipeline
- 4.2.3 Surge in LNG-to-power projects unlocking gas EPC backlog
- 4.2.4 DPPA framework catalysing C&I renewable build-outs
- 4.2.5 Mandatory storage add-ons (above 10 % / 2 -h) boosting BESS EPC scope
- 4.2.6 Local content incentives for wind/solar equipment & EPC services
- 4.3 Market Restraints
- 4.3.1 Grid congestion & curtailment risk inflating project IRRs
- 4.3.2 Retroactive FIT revisions eroding investor confidence
- 4.3.3 Skilled EPC labour shortages for high-voltage & offshore works
- 4.3.4 EVN credit-risk overhang on long-term PPAs
- 4.4 Supply-Chain Analysis
- 4.5 Regulatory Landscape
- 4.6 Technological Outlook
- 4.7 Porter's Five Forces
- 4.7.1 Threat of New Entrants
- 4.7.2 Bargaining Power of Suppliers
- 4.7.3 Bargaining Power of Buyers
- 4.7.4 Threat of Substitutes
- 4.7.5 Competitive Rivalry
- 4.8 PESTLE Analysis
5 Market Size & Growth Forecasts
- 5.1 Power Generation EPC
- 5.1.1 By Technology
- 5.1.1.1 Thermal
- 5.1.1.2 Nuclear
- 5.1.1.3 Renewables
- 5.1.2 By Capacity Band
- 5.1.2.1 Up to 100 MW (DER, micro-grid)
- 5.1.2.2 100 to 499 MW
- 5.1.2.3 Above 500 MW
- 5.1.3 By End-User
- 5.1.3.1 Regulated Utilities
- 5.1.3.2 Independent Power Producers
- 5.1.3.3 Industrial Captive Power
- 5.1.3.4 Public Sector and SOE
- 5.1.1 By Technology
- 5.2 Power Transmission and Distribution (T&D) EPC
6 Competitive Landscape
- 6.1 Market Concentration
- 6.2 Strategic Moves (M&A, Partnerships, PPAs)
- 6.3 Market Share Analysis (Market Rank/Share for key companies)
- 6.4 Company Profiles (includes Global level Overview, Market level overview, Core Segments, Financials as available, Strategic Information, Products & Services, and Recent Developments)
- 6.4.1 JGC Vietnam Co. Ltd.
- 6.4.2 IHI Infrastructure Systems Co. Ltd.
- 6.4.3 Lilama Corporation
- 6.4.4 Doosan Enerbility Co. Ltd.
- 6.4.5 Toshiba Corporation
- 6.4.6 AES Corporation
- 6.4.7 CTCI Corporation
- 6.4.8 PALMA Group Vietnam
- 6.4.9 Power Engineering Consulting JSC 2 (PECC2)
- 6.4.10 Vietnam Electricity Construction JSC (VNECO)
- 6.4.11 Siemens Energy AG
- 6.4.12 GE Vernova
- 6.4.13 PetroVietnam Power Corporation (PV Power)
- 6.4.14 PetroVietnam Gas JSC (PV Gas)
- 6.4.15 Samsung C&T Corp.
- 6.4.16 Vestas Wind Systems A/S
- 6.4.17 PC1 Group JSC
- 6.4.18 Mitsubishi Power Ltd.
- 6.4.19 Orsted A/S
- 6.4.20 Copenhagen Infrastructure Partners
7 Market Opportunities & Future Outlook
- 7.1 White-space & Unmet-Need Assessment

 石油及天然氣EPC市場規模、佔有率、成長、全球產業分析、區域趨勢及2026-2034年預測
 美國電力EPC:市場佔有率分析、行業趨勢和統計數據、成長預測(2026-2031年)泰國電力EPC:市場佔有率分析、產業趨勢與統計及成長預測(2026-2031年)菲律賓發電EPC:市場佔有率分析、產業趨勢與統計及成長預測(2026-2031年)
 電力EPC市場規模、佔有率和成長分析:按電源、服務類型、專案類型、應用、最終用戶、合約類型和地區分類-2026-2033年產業預測英國電力EPC:市場佔有率分析、產業趨勢與統計、成長預測(2026-2031年)
 電力EPC市場-全球產業規模、佔有率、趨勢、機會、預測:按類型、組件、地區和競爭對手分類,2021-2031年
 工程師/ EPC-E的參與
 電力EPC市場(涵蓋發電廠和輸配電基礎設施):按發電方式、服務、設備和區域分類
 2026年全球電力EPC市場報告