


 |
市場調查報告書
商品編碼
2100730
印度化肥市場:市場佔有率分析、產業趨勢與統計、成長預測(2026-2031)India Fertilizers - Market Share Analysis, Industry Trends & Statistics, Growth Forecasts (2026 - 2031) |
||||||

※ 本網頁內容可能與最新版本有所差異。詳細情況請與我們聯繫。
根據 Mordor Intelligence 預測,印度化肥市場規模將從 2025 年的 238 億美元和 2026 年的 253 億美元成長到 2031 年的 343.4 億美元,其中 2026 年至 2031 年的最高複合年成長率預計為 6.08%。
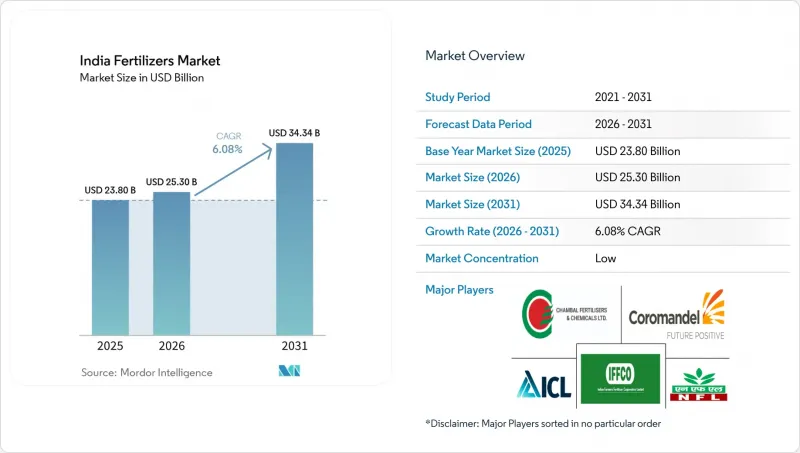
本報告按類型(複合肥、單質肥)、形態(常規型、專用型)、施用方法(施肥和灌溉等)以及作物類型(田間作物等)進行分類。市場預測以貨幣值和銷售兩種形式呈現。
印度化肥市場趨勢與洞察
簡化以營養素為基礎的補貼流程
印度於2024年對其營養素定價(NBS)框架進行了徹底改革,將補貼計算標準從以產品為中心轉向以營養素為中心,糾正了長期以來尿素價格高於複合肥的價格扭曲現象。在2024年的雨季,價格均衡化促進了農民減少一氧化氮肥料的使用,複合肥料的購買量激增23%。更嚴格的品質標準規定了NPK複合肥中某些微量元素的最低含量,迫使生產商進入高階市場,並鼓勵擁有改良配方的外國公司進入該市場。然而,推廣應用仍不均衡。馬哈拉斯特拉邦和古吉拉突邦的成長率已達兩位數,但在印度恆河平原依賴尿素的地區,轉型速度較為緩慢。中期來看,這項政策有望推動印度化肥市場向高附加價值產品轉型,透過提高產量改善農民的盈利,並透過限制氮肥的過度使用來減輕農民的經濟負擔。
擴大滴灌及施肥灌溉系統
2024年,在「總理農業灌溉計畫」(Pradhan Mantri Krishi Sinchayee Yojana)的推動下,微灌技術的應用範圍擴大,為特種水溶性肥料需求的成長奠定了基礎。政府提出的2030年目標承諾,將農業生產結構從大面積施肥轉向小劑量、高頻率的灌溉施肥。在園藝業的推動下,卡納塔克邦和古吉拉突邦正在加速推廣微灌技術。田間試驗表明,微灌可減少30-40%的養分用量,並提高20-25%的產量,這進一步增強了灌溉施肥的商業價值。海法內蓋夫(Haifa Negev)和ICL集團等國際供應商已順應這一趨勢,在印度本地建立工廠,生產並包裝專為印度市場客製化的水溶性NPK複合肥。從長遠來看,精準施肥和灌溉的優勢有助於提高肥料價格,穩定農業投入成本,並改善土壤健康,所有這些因素共同推動了印度肥料市場對特殊肥料的需求。
補貼償還延遲給營運資金帶來壓力。
製造商被迫依賴年利率高達12%至15%的短期貸款來填補融資缺口,這擠壓了利潤空間,在某些情況下甚至迫使企業減產。流動性危機蔓延至整個分銷鏈,導致信貸期限延長,並在施肥高峰期出現原料短缺。政府的直接福利轉移計劃僅部分緩解了這一瓶頸,因為報銷核准流程仍然需要多個環節。中小企業受到的衝擊尤其嚴重,增加了企業退出市場和被收購的可能性,進一步加速了印度化肥市場的重組趨勢。
細分市場分析
在印度化肥市場,預計到2025年,單一肥料將佔總銷售額的80.9%,其中尿素的出貨量約佔該細分市場總出貨量的65%。尿素憑藉著完善的補貼政策、廣泛的分銷網路以及農民的便利購買管道,鞏固了其主導地位。微量元素單一肥料,例如硫酸鋅,由於對微量元素缺乏的廣泛調查,實現了顯著的複合年成長率。儘管複合肥料的市場佔有率較小,但在天然肥料標準(NBS)的推動下,價格趨於一致,縮小了成本差距,同時品質標準也強制要求添加微量元素,預計到2031年,複合肥料的複合年成長率將高於市場平均水平,達到6.9%。
複合肥料具有物流簡化和養分均衡供應的優勢,使農民能夠根據土壤診斷結果進行施肥,而無需使用多種肥料。生產商正利用一體化生產設施來調整產品等級,以避免原物料價格波動所帶來的風險。隨著均衡營養管理(BNM)的推廣,對10-26-26、12-32-16和20-20-0等配方肥料的需求不斷成長。隨著政策調整和試點計畫成果的推進,印度複合肥料市場預計將穩定成長,從而促進農業發展。
儘管傳統顆粒肥料在2025年仍佔印度肥料市場銷售額的96.9%,但特種肥料才是推動印度肥料市場成長的主要動力,預計到2031年,其複合年成長率將達到6.5%。在資本密集的園藝和溫室栽培領域,水溶性肥料是特殊肥料的主要應用領域。儘管成本較高,但覆蓋型和緩釋型尿素因其能提高25-30%的肥效,正吸引大規模生產者的注意。在農業發達的邦,特種肥料的普及率已達15-20%,但在農業推廣體系低度開發的邦,比例仍低於5%。
由於噴灑是水稻和小麥種植的主要方法,傳統顆粒肥料預計將保持較大的市場佔有率。然而,由於環境法規日益嚴格以及補貼政策的調整,對高成長型特殊肥料的需求將在預測期內逐步轉變。各公司正將特種肥料產品與農業技術服務結合,以提高客戶忠誠度並提升印度肥料市場的利潤率。
其他好處:
- Excel格式的市場預測(ME)表
- 3個月的分析師支持
目錄
第1章:引言
- 研究假設和市場定義
- 調查範圍
- 調查方法
第2章:執行摘要和主要發現
第3章:本報告的內容
第4章:主要產業趨勢
- 主要農作物種植面積
- 田間作物
- 園藝作物
- 平均施肥量
- 微量營養素
- 田間作物
- 園藝作物
- 主要營養素
- 田間作物
- 園藝作物
- 次要大量營養元素
- 田間作物
- 園藝作物
- 微量營養素
- 配備灌溉設施的農田
- 法律規範
- 市場促進因素
- 基於營養價值的價格補助合理化
- 擴大滴灌及施肥灌溉系統
- 政府推廣均衡營養(BNM)
- 擴大奈米脲和奈米二氨基苯甲酸的供應
- 透過分析數位化土壤健康卡,可以實現微量施肥。
- 企業甘蔗永續性計劃
- 市場限制因素
- 補貼償還延遲給營運資金帶來壓力。
- 進口氨和磷酸鹽價格波動
- 根據修訂後的CPCB標準計算的環境合規成本
- 小規模農戶對尿素以外的特殊肥料缺乏信任
- 價值鍊和通路分析
第5章 市場規模與成長預測
- 按類型
- 複合肥
- 單一肥料
- 微量營養素
- 硼
- 銅
- 鐵
- 錳
- 鉬
- 鋅
- 其他
- 氮基
- 尿素
- 其他
- 磷酸鹽基
- DAP
- MAP
- SSP
- 其他
- 鉀基
- MoP
- 次要大量營養元素
- 鈣
- 鎂
- 硫
- 微量營養素
- 按形式
- 傳統的
- 特種
- CRF
- 液體肥料
- SRF
- 水溶性肥料
- 透過應用方法
- 施肥和灌溉
- 葉面噴布
- 土壤施用
- 按作物類型
- 田間作物
- 園藝作物
- 草坪和觀賞植物
第6章 競爭情勢
- 關鍵策略趨勢
- 市佔率分析
- 企業狀況
- 公司簡介
- Chambal Fertilisers and Chemicals Limited(KK Birla Group)
- Coromandel International Limited(Murugappa Group)
- Gujarat Narmada Valley Fertilizers and Chemicals Limited(Govt. of Gujarat)
- Haifa Negev Technologies Ltd.
- ICL Group Ltd
- Indian Farmers Fertiliser Cooperative Limited(IFFCO)
- National Fertilizers Limited(Government of India)
- Rashtriya Chemicals and Fertilizers Limited(Government of India)
- Sociedad Quimica y Minera de Chile SA
- Yara International ASA
- Paradeep Phosphates Limited(Zuari-Maroc Phosphates Pvt. Ltd. & OCP)
- Nagarjuna Fertilizers and Chemicals Limited(Nagarjuna Group)
- Fertilizers and Chemicals Travancore Limited(FACT)
- Deepak Fertilisers and Petrochemicals Corporation Limited
- Krishak Bharati Cooperative Limited(KRIBHCO)
第7章 化肥產業執行長面臨的關鍵策略挑戰
According to Mordor Intelligence, the India fertilizers market size is projected to expand from USD 23.80 billion in 2025 and USD 25.30 billion in 2026 to USD 34.34 billion by 2031, registering a fastest-growing 6.08% CAGR between 2026 and 2031.
This report is Segmented by Type (Complex and Straight), by Form (Conventional and Specialty), by Application Mode (Fertigation, and More) and by Crop Type (Field Crops, and More). The Market Forecasts are Provided in Terms of Value (USD) and Volume (Metric Tons).
India Fertilizers Market Trends and Insights
Subsidy rationalization toward nutrient-based pricing
The 2024 overhaul of India's NBS framework moved the subsidy calculation from product-centric to nutrient-centric, correcting long-standing price distortions that once favored urea over balanced blends. During the 2024 kharif season, farmers responded with a 23% jump in complex fertilizer purchases as price parity encouraged switch-over from straight nitrogen. Enhanced quality norms now require specific micronutrient thresholds in NPK grades, nudging manufacturers into premium segments and attracting foreign entrants with fortified formulations. Adoption patterns remain uneven; Maharashtra and Gujarat already show double-digit gains, while urea-heavy belts across the Indo-Gangetic plains transition more slowly. Over the medium term, the policy is anticipated to steer the India fertilizers market toward value-added products, lift farm profitability through higher yields, and ease fiscal pressure by curbing excessive nitrogen use.
Rising adoption of drip irrigation and fertigation systems
Micro-irrigation coverage expanded in 2024 under the Pradhan Mantri Krishi Sinchayee Yojana, setting the stage for specialty, water-soluble fertilizer demand. The government's 2030 target promises a structural change from broadcast application to low-volume, high-frequency fertigation. Karnataka and Gujarat accelerate horticulture-led installations. Field trials show 30-40% nutrient savings and 20-25% yield gains, fortifying the business case for fertigation. International suppliers such as Haifa Negev and ICL Group reacted by building local plants that package water-soluble NPK grades tailored for the India fertilizers market. Over the long term, fertigation's precision-application advantage supports premium pricing, stabilizes farm input costs, and enriches soil health, collectively lifting demand for specialty inputs within the India fertilizers market.
Delayed subsidy reimbursements straining working capital
Manufacturers resorted to short-term loans at 12-15% interest to bridge cash gaps, squeezing margins and, in some cases, forcing production cuts. Liquidity stress rippled down the dealer chain, elongating credit terms and triggering input shortages during peak application periods. The government's Direct Benefit Transfer initiative only partly alleviated bottlenecks because reimbursement validation still requires multilevel clearances. Smaller companies bear disproportionate pain, raising the likelihood of exits or takeovers and aggravating the consolidation trend inside the India fertilizers market.
Other drivers and restraints analyzed in the detailed report include:
- Government push for balanced nutrient management
- Growing availability of nano-urea and nano-DAP
- Volatility in imported ammonia and phosphoric acid prices
For complete list of drivers and restraints, kindly check the Table Of Contents.
Segment Analysis
Straight fertilizers controlled 80.9% of 2025 revenue in the India fertilizers market, with urea alone contributing roughly 65% of segment shipments. Urea's entrenched subsidy status, broad dealer footprint, and familiarity among farmers cement its lead. Micronutrient straights, such as zinc sulfate, posted impressive CAGRs due to widespread deficiency mapping. Complex fertilizers, though smaller in share, outpace the market with a 6.9% CAGR through 2031, underpinned by NBS parity that narrows the cost gap and by quality mandates requiring micronutrient enrichment.
Complex grades benefit from simplified logistics and balanced nutrient delivery, allowing farmers to match soil prescriptions without juggling multiple products. Manufacturers leverage integrated facilities to swing between grades and hedge price volatility in raw materials. With BNM driving balanced nutrition, demand for 10-26-26, 12-32-16, and 20-20-0 variants rises. The India fertilizers market for complex formulas is forecast to grow steadily as policy shifts and demonstration results demonstrate agronomic gains.
Conventional granules commanded 96.9% of 2025 sales, yet specialty categories represent the momentum pocket of the India fertilizers market, with a 6.5% CAGR through 2031. Water-soluble fertilizers lead specialty uptake in capital-intensive horticulture and protected cultivation. Controlled-release and slow-release urea, while costlier, promise 25-30% efficiency improvements that attract large growers. Specialty penetration reaches 15-20% in progressive states, compared to sub-5% levels in weaker extension states.
Conventional granules will maintain a significant share of the market given rice and wheat's reliance on broadcast practices. Still, environmental tightening and subsidy realignments will progressively tilt value toward specialty lines with higher growth in the forecast period. Companies bundle agronomy services with specialty products, reinforcing customer loyalty and buttressing margins inside the India fertilizers market.
Complete Report Scope:
- Type
- Complex
- Straight
- Micronutrients
- Boron
- Copper
- Iron
- Manganese
- Molybdenum
- Zinc
- Others
- Nitrogenous
- Urea
- Others
- Phosphatic
- DAP
- MAP
- SSP
- Others
- Potassic
- MoP
- Secondary Macronutrients
- Calcium
- Magnesium
- Sulfur
- Micronutrients
- Form
- Conventional
- Speciality
- CRF
- Liquid Fertilizer
- SRF
- Water Soluble
- Application Mode
- Fertigation
- Foliar
- Soil
- Crop Type
- Field Crops
- Horticultural Crops
- Turf and Ornamental
List of Companies Covered in this Report:
- Chambal Fertilisers and Chemicals Limited (KK Birla Group)
- Coromandel International Limited (Murugappa Group)
- Gujarat Narmada Valley Fertilizers and Chemicals Limited (Govt. of Gujarat)
- Haifa Negev Technologies Ltd.
- ICL Group Ltd
- Indian Farmers Fertiliser Cooperative Limited (IFFCO)
- National Fertilizers Limited (Government of India)
- Rashtriya Chemicals and Fertilizers Limited (Government of India)
- Sociedad Quimica y Minera de Chile SA
- Yara International ASA
- Paradeep Phosphates Limited (Zuari-Maroc Phosphates Pvt. Ltd. & OCP)
- Nagarjuna Fertilizers and Chemicals Limited (Nagarjuna Group)
- Fertilizers and Chemicals Travancore Limited (FACT)
- Deepak Fertilisers and Petrochemicals Corporation Limited
- Krishak Bharati Cooperative Limited (KRIBHCO)
Additional Benefits:
- The market estimate (ME) sheet in Excel format
- 3 months of analyst support
TABLE OF CONTENTS
1 INTRODUCTION
- 1.1 Study Assumptions and Market Definition
- 1.2 Scope of the Study
- 1.3 Research Methodology
2 EXECUTIVE SUMMARY AND KEY FINDINGS
3 REPORT OFFERS
4 KEY INDUSTRY TRENDS
- 4.1 Acreage of Major Crop Types
- 4.1.1 Field Crops
- 4.1.2 Horticultural Crops
- 4.2 Average Nutrient Application Rates
- 4.2.1 Micronutrients
- 4.2.1.1 Field Crops
- 4.2.1.2 Horticultural Crops
- 4.2.2 Primary Nutrients
- 4.2.2.1 Field Crops
- 4.2.2.2 Horticultural Crops
- 4.2.3 Secondary Macronutrients
- 4.2.3.1 Field Crops
- 4.2.3.2 Horticultural Crops
- 4.2.1 Micronutrients
- 4.3 Agricultural Land Equipped For Irrigation
- 4.4 Regulatory Framework
- 4.5 Market Drivers
- 4.5.1 Subsidy rationalization toward nutrient-based pricing
- 4.5.2 Rising adoption of drip irrigation and fertigation systems
- 4.5.3 Government push for balanced nutrient management (BNM)
- 4.5.4 Growing availability of nano-urea and nano-DAP
- 4.5.5 Digitized soil-health card analytics enabling micro-dosing
- 4.5.6 Corporate sugarcane sustainability programs
- 4.6 Market Restraints
- 4.6.1 Delayed subsidy reimbursements straining working capital
- 4.6.2 Volatility in imported ammonia and phosphoric acid prices
- 4.6.3 Environmental compliance costs under revised CPCB norms
- 4.6.4 Smallholder mistrust of specialty fertilizers beyond urea
- 4.7 Value Chain and Distribution Channel Analysis
5 MARKET SIZE AND GROWTH FORECAST (VALUE AND VOLUME)
- 5.1 Type
- 5.1.1 Complex
- 5.1.2 Straight
- 5.1.2.1 Micronutrients
- 5.1.2.1.1 Boron
- 5.1.2.1.2 Copper
- 5.1.2.1.3 Iron
- 5.1.2.1.4 Manganese
- 5.1.2.1.5 Molybdenum
- 5.1.2.1.6 Zinc
- 5.1.2.1.7 Others
- 5.1.2.2 Nitrogenous
- 5.1.2.2.1 Urea
- 5.1.2.2.2 Others
- 5.1.2.3 Phosphatic
- 5.1.2.3.1 DAP
- 5.1.2.3.2 MAP
- 5.1.2.3.3 SSP
- 5.1.2.3.4 Others
- 5.1.2.4 Potassic
- 5.1.2.4.1 MoP
- 5.1.2.5 Secondary Macronutrients
- 5.1.2.5.1 Calcium
- 5.1.2.5.2 Magnesium
- 5.1.2.5.3 Sulfur
- 5.1.2.1 Micronutrients
- 5.2 Form
- 5.2.1 Conventional
- 5.2.2 Speciality
- 5.2.2.1 CRF
- 5.2.2.2 Liquid Fertilizer
- 5.2.2.3 SRF
- 5.2.2.4 Water Soluble
- 5.3 Application Mode
- 5.3.1 Fertigation
- 5.3.2 Foliar
- 5.3.3 Soil
- 5.4 Crop Type
- 5.4.1 Field Crops
- 5.4.2 Horticultural Crops
- 5.4.3 Turf and Ornamental
6 COMPETITIVE LANDSCAPE
- 6.1 Key Strategic Moves
- 6.2 Market Share Analysis
- 6.3 Company Landscape
- 6.4 Company Profiles (Includes Global Level Overview, Market Level Overview, Core Business Segments, Financials, Headcount, Key Information, Market Rank, Market Share, Products and Services, and Analysis of Recent Developments)
- 6.4.1 Chambal Fertilisers and Chemicals Limited (KK Birla Group)
- 6.4.2 Coromandel International Limited (Murugappa Group)
- 6.4.3 Gujarat Narmada Valley Fertilizers and Chemicals Limited (Govt. of Gujarat)
- 6.4.4 Haifa Negev Technologies Ltd.
- 6.4.5 ICL Group Ltd
- 6.4.6 Indian Farmers Fertiliser Cooperative Limited (IFFCO)
- 6.4.7 National Fertilizers Limited (Government of India)
- 6.4.8 Rashtriya Chemicals and Fertilizers Limited (Government of India)
- 6.4.9 Sociedad Quimica y Minera de Chile SA
- 6.4.10 Yara International ASA
- 6.4.11 Paradeep Phosphates Limited (Zuari-Maroc Phosphates Pvt. Ltd. & OCP)
- 6.4.12 Nagarjuna Fertilizers and Chemicals Limited (Nagarjuna Group)
- 6.4.13 Fertilizers and Chemicals Travancore Limited (FACT)
- 6.4.14 Deepak Fertilisers and Petrochemicals Corporation Limited
- 6.4.15 Krishak Bharati Cooperative Limited (KRIBHCO)
7 KEY STRATEGIC QUESTIONS FOR FERTILIZER CEOS

 2026-2030年全球磷肥市場
 全球昆蟲衍生肥料市場規模、佔有率、趨勢和成長分析報告(2026-2034)
 全球控釋肥料市場:按類型、施用方法、功能、產品等級、作物類型、配方和地區分類-預測至2031年
 2026年全球微粉化肥料市場報告
 緩釋肥料市場:2026-2032年全球市場預測(以包膜類型、作物類型、釋放週期、養分類型、施用方法、最終用途和銷售管道)
 幾丁質肥料市場規模、佔有率和成長分析:按產品類型、形態、應用方法、作物類型、分銷管道和地區分類-2026-2033年產業預測
 印度緩釋肥料:市場佔有率分析、行業趨勢和統計數據以及成長預測(2026-2031 年)亞太地區緩釋肥料:市場佔有率分析、產業趨勢與統計及成長預測(2026-2031)飼料肥料:市場佔有率分析、行業趨勢和統計數據、成長預測(2026-2031年)中國化肥市場:市佔率分析、產業趨勢與統計、成長預測(2026-2031年)