


 |
市場調查報告書
商品編碼
2100587
鉛酸蓄電池(LAB):市場佔有率分析、行業趨勢和統計數據以及成長預測(2026-2031 年)Lead-Acid Battery - Market Share Analysis, Industry Trends & Statistics, Growth Forecasts (2026 - 2031) |
||||||

※ 本網頁內容可能與最新版本有所差異。詳細情況請與我們聯繫。
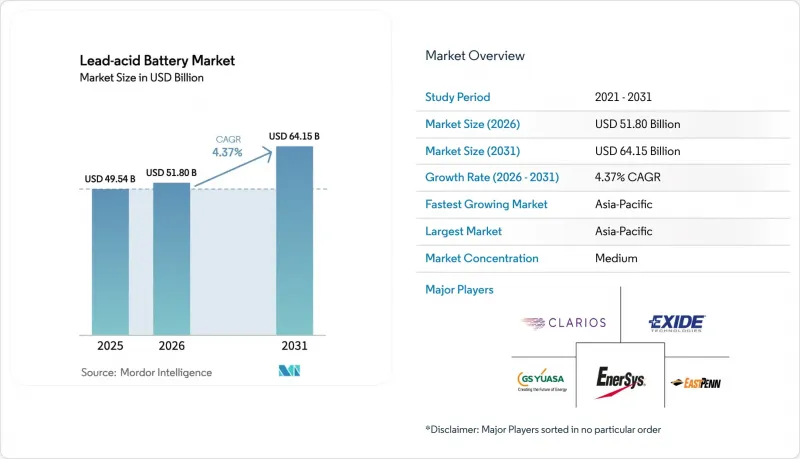
根據 Mordor Intelligence 預測,鉛酸電池 (LAB) 市場規模將從 2025 年的 495.4 億美元和 2026 年的 518 億美元成長到 2031 年的 641.5 億美元,2026 年至 2031 年的年複合成長率(CAGR)為 4.37%。
本報告按結構(液壓/VRLA)、應用(SLI/固定/動力/拖曳/可攜式/其他)和地區(北美、歐洲、亞太、南美、中東和非洲)進行細分。市場規模和預測以美元計價。
全球鉛酸蓄電池(LAB)市場趨勢與洞察
對內燃機汽車的替代需求依然強勁。
預計未來十年或更長時間內,內燃機汽車和混合動力汽車仍將佔據全球汽車保有量的絕大部分,從而確保鉛酸蓄電池(LAB)的穩定更換週期。到2025年,超過5000萬輛配備AGM(吸附式玻璃纖維隔板)電池的汽車將需要售後更換,隨著啟停功能的普及,預計這一數字還將繼續成長。考慮到熱帶地區電池平均壽命為4年,溫帶地區為5年,中國和印度的2.8億輛汽車保有量構成了巨大的市場需求。歐洲採用DIN標準尺寸簡化了經銷商的庫存管理,但同時也提高了更換成本,從而為控制供應鏈的現有企業創造了更高的利潤空間。儘管電動車正在崛起,但這些基本因素確保了鉛酸蓄電池(LAB)市場在汽車售後市場中保持穩固的地位。
新興亞洲和非洲電信網路密度不斷增加
由於電網不可靠,通訊業者不得不依賴鉛酸蓄電池來確保基地台的運作。在印度,40萬座通訊塔每天停電超過8小時,為了彌補柴油發電機無法使用期間的電力缺口,業者正在部署容量為300-900安時的電池組。在撒哈拉以南非洲,88%的基地台連接在離網或不可靠的電網上,由於擔心被盜和熱失控風險,鋰離子電池的普及受到限制,因此目前主要使用密封式閥控式鉛酸蓄電池(VRLA)。在東南亞國協,每年新建基地台多達1.5萬座,由於投資成本低且易於回收,鉛酸蓄電池被指定用於都市區地區。這種持續的需求支撐著鉛酸蓄電池出貨量的穩定成長,即使鋰離子電池在城市部署中佔據主導地位。
汽車用鋰離子電池的成本曲線低於 70 美元/kWh。
預計到2024年,鋰離子電池組的價格將降至每千瓦時115美元,到2026年將降至每千瓦時80美元,從而消除起動裝置和動力總成在總擁有成本(TCO)方面的差距。高盛預測,當價格降至每千瓦時80美元時,電動車的成本將與內燃機持平,達到此閾值將加速電動車的普及,並縮小鉛酸電池(SLI)的售後市場。寧德時代(CATL)和比亞迪等中國供應商已透過垂直整合和規模經濟將電芯成本降至每千瓦時75美元以下,進一步給鉛酸電池製造商帶來壓力。麥肯錫預測,到2030年,隨著業者優先考慮快速充電和高能量密度,鋰離子電池將佔動力總成市場佔有率的60%至70%。即將到來的成本逆轉將消除鉛酸電池 (LAB) 傳統上具有的優勢——低初始成本——製造商將被迫在使用壽命、回收基礎設施和監管合規性方面展開競爭。
細分市場分析
預計到2025年,VRLA電池將佔鉛酸電池總銷量的94.57%,到2031年,該細分市場將以5.51%的複合年成長率持續成長。優質AGM電池因其使用壽命延長20-30%,且能夠在部分充電狀態下承受充放電循環,對於微型混合動力汽車和通訊基地台至關重要。石墨烯增強型AGM電池設計進一步提升了耐用性,實驗室測試顯示其循環壽命可延長約25%。因此,VRLA產品的鉛酸電池市場規模預計將以高於整體市場平均的速度成長。
到2025年,開放式電池將佔據剩餘的5.43%市場。它們仍然在一些細分市場中使用,例如固定式和電力應用領域,這些領域對價格和低維護人事費用要求極高。目前,碳和石墨烯添加劑能夠使電池在50%放電深度下達到500-700次充放電循環,其性能與早期閥控式鉛酸蓄電池(VRLA)相當,而成本僅為後者的60-70%。這種技術上的進步確保了液態電池的化學成分仍然實用,尤其是在撒哈拉以南非洲和南亞農村地區的通訊設備中。
區域分析
預計到2025年,亞太地區將佔全球銷售額的52.59%,並維持4.83%的年均成長率至2031年。中國擁有龐大的汽車保有量、啟停功能普及率高,以及有利於國內垂直整合製造商的政策主導回收義務。印度售後市場由於更換週期短和高階化學成分電池佔有率不斷成長,具有巨大的成長潛力。在東協市場,每年安裝數千座新的電池塔,其中大部分用於安裝閥控式鉛酸蓄電池(VRLA),這是由於資金限制和成熟的回收管道所致。
在北美,隨著電動車的普及,液態SLI電池的出貨量下降,導致市場擴張緩慢。然而,由於啟停功能在新車銷售的滲透率已達50%,售後市場依然強勁。隨著美國環保署(EPA)收緊都市區冶煉廠的鉛暴露標準,遵守回收法規的成本也上升。歐洲也面臨類似的監管壓力,2023/1542號電池法規要求2030年鉛回收率達到70%,並要求在2027年引入數位電池護照。德國、法國和英國電動車的快速普及加速了SLI電池出貨量的下降,但高階AGM電池的普及推高了平均售價。
南美洲、中東和非洲仍然是極具發展潛力的地區。在巴西,5000萬輛汽車的保有量以及電動車(EV)較低的普及率推動了對傳統鉛酸電池(LAB)和高階鉛酸電池的需求,儘管經濟波動可能導致更換週期延長。在撒哈拉以南非洲,由於鋰離子電池部署有被盜風險和成本壁壘,88%的基地台使用鉛酸電池。在波灣合作理事會成員國南非,隨著資料中心的擴張,VRLA UPS系統的部署也持續推進,這是其數位經濟策略的一部分。在全部區域,完善的回收和再利用網路鞏固了鉛酸電池市場的主導地位。
其他好處:
- Excel格式的市場預測(ME)表
- 3個月的分析師支持
目錄
第1章:引言
- 研究假設和市場定義
- 調查範圍
第2章:調查方法
第3章執行摘要
第4章 市場狀況
- 市場概覽
- 市場促進因素
- 更換ICE列車替代方案的需求依然強勁。
- 亞洲和非洲新興國家的電信網路密度不斷增加
- 資料中心UPS擴容(二線城市)
- 微型混合動力SLI電池售後市場的收入確定
- 「智慧混合」添加劑可延長泛光流式電池的使用壽命。
- 中低收入國家能源儲存系統的蓬勃發展是由對低成本能源儲存系統的需求所驅動的。
- 市場限制因素
- 鋰離子電池成本曲線的交點低於 70 美元/kWh(用於汽車)。
- 歐盟對廢鉛的監管規定正變得越來越嚴格。
- 都市區回收叢集的保險風險溢價
- 採用增強型石墨烯的AGM電池正從傳統VRLA電池手中奪取市場佔有率。
- 供應鏈分析
- 監理情勢
- 技術展望
- 波特五力模型
第5章 市場規模與成長預測
- 按結構
- 液體類型
- VRLA
- 透過使用
- SLI
- 固定的
- 動力、牽引和駕駛(堆高機、高爾夫球車)
- 可攜式及其他
- 按地區
- 北美洲
- 美國
- 加拿大
- 墨西哥
- 歐洲
- 德國
- 英國
- 法國
- 西班牙
- 義大利
- 北歐國家
- 俄羅斯
- 其他歐洲國家
- 亞太地區
- 中國
- 印度
- 日本
- 韓國
- 東南亞國協
- 澳洲和紐西蘭
- 其他亞太國家
- 南美洲
- 巴西
- 阿根廷
- 智利
- 其他南美國家
- 中東和非洲
- 沙烏地阿拉伯
- 阿拉伯聯合大公國
- 南非
- 埃及
- 其他中東和非洲國家
- 北美洲
第6章 競爭情勢
- 市場集中度
- 策略趨勢(併購、聯盟、購電協議)
- 市場佔有率分析(主要公司的市場排名和佔有率)
- 公司簡介
- Clarios
- Exide Technologies
- EnerSys
- GS Yuasa Corp.
- East Penn Manufacturing
- Panasonic
- Amara Raja Batteries
- C&D Technologies
- Leoch International
- Chaowei Power
- Narada Power
- NorthStar Battery
- Crown Battery
- Trojan Battery
- Camel Group
- FIAMM Energy Technology
- Hitachi Chemical
- HOPPECKE
- Shuangdeng(Sacred Sun)
- Sunlight Group
第7章 市場機會與未來展望
According to Mordor Intelligence, the lead-Acid battery market size is projected to expand from USD 49.54 billion in 2025 and USD 51.80 billion in 2026 to USD 64.15 billion by 2031, registering a CAGR of 4.37% between 2026 to 2031.
This report is Segmented by Construction Method (Flooded and VRLA), Application (Starting-Lighting-Ignition, Stationary, Motive/Traction, and Portable and Others), and Geography (North America, Europe, Asia-Pacific, South America, and Middle East and Africa). The Market Sizes and Forecasts are Provided in Terms of Value (USD).
Global Lead-Acid Battery Market Trends and Insights
ICE-Vehicle Parc Replacement Demand Remains Resilient
Internal-combustion and hybrid vehicles are predicted to dominate the global fleet well into the next decade, securing a steady replacement cycle for lead-acid batteries. More than 50 million vehicles equipped with absorbent-glass-mat (AGM) batteries required aftermarket replacements in 2025, and this figure will rise as start-stop penetration deepens. China's 280 million-unit vehicle parc and India's 280 million registered vehicles represent substantial reservoirs where battery life averages four years in tropical climates and five years in temperate zones. Consolidation toward DIN-standard sizing in Europe simplifies distributor inventory yet raises replacement costs, creating margin upside for incumbents that control supply chains. These fundamentals keep the lead acid battery market anchored in the automotive aftermarket despite the rise of electric vehicles.
Telecom Network Densification in Emerging Asia & Africa
Unreliable grids drive telecom operators to rely on lead-acid batteries for base-station uptime. India's 400,000 towers face daily outages exceeding eight hours and therefore deploy battery banks rated 300-900 ampere-hours to bridge diesel-generator switchover periods. Sub-Saharan Africa, where 88% of sites are off-grid or bad-grid, opts for sealed VRLA units because theft concerns and thermal-runaway risks restrict lithium-ion adoption. ASEAN nations are adding up to 15,000 towers annually, specifying lead-acid for rural deployments that require low capital investment and straightforward recycling. This persistent demand supports steady shipment growth even as lithium-ion captures urban installations.
Lithium-Ion Cost Curve Crossing Below USD 70 kWh for Automotive
Lithium-ion battery pack prices declined to USD 115 kWh in 2024 and are projected to fall to USD 80 kWh by 2026, closing the total-cost-of-ownership gap in starter and motive-power use cases. Goldman Sachs pegs full drivetrain parity with internal-combustion engines at USD 80 kWh, a threshold that accelerates electric-vehicle adoption and shrinks the captive SLI aftermarket. Chinese suppliers such as CATL and BYD already achieve cell-level costs below USD 75 kWh through vertical integration and scale efficiencies, putting additional pressure on lead-acid producers. McKinsey forecasts lithium-ion will secure 60-70% of the motive-power segment by 2030 as operators prioritize fast charging and higher energy density. The impending cost crossover removes lead-acid's historic advantage, low upfront price, forcing manufacturers to compete on service life, collection infrastructure, and regulatory compliance instead.
Other drivers and restraints analyzed in the detailed report include:
- Data-Center UPS Build-Outs (Tier-2 Cities)
- Aftermarket Revenue Lock-In for Micro-Hybrid SLI Batteries
- Stricter EU End-of-Life Lead Limits
For complete list of drivers and restraints, kindly check the Table Of Contents.
Segment Analysis
VRLA batteries commanded 94.57% of 2025 revenue, and the segment is forecast to compound at 5.51% to 2031. Premium AGM variants deliver 20-30% longer service life and tolerate partial-state-of-charge cycling, making them essential for micro-hybrid vehicles and telecom sites. Graphene-enhanced AGM designs further raise durability, extending cycle life by about 25% in lab tests. The lead acid battery market size for VRLA products is therefore positioned to outpace the overall average.
Flooded batteries held the remaining 5.43% share in 2025. They persist in price-sensitive stationary and motive-power niches where maintenance labor is inexpensive. Carbon and graphene additives now allow 500-700 cycles at 50% depth-of-discharge, matching early VRLA performance at 60-70% of the cost. This technical catch-up keeps flooded chemistry viable, particularly in rural telecom installations across Sub-Saharan Africa and South Asia.
Complete Report Scope:
- By Construction Method
- Flooded
- VRLA
- By Application
- Starting-Lighting-Ignition (SLI)
- Stationary
- Motive/Traction (Forklifts, Golf-carts)
- Portable and Others
- By Geography
- North America
- United States
- Canada
- Mexico
- Europe
- Germany
- United Kingdom
- France
- Spain
- Italy
- NORDIC Countries
- Russia
- Rest of Europe
- Asia Pacific
- China
- India
- Japan
- South Korea
- ASEAN Countries
- Australia and New Zealand
- Rest of Asia Pacific
- South America
- Brazil
- Argentina
- Chile
- Rest of South America
- Middle East and Africa
- Saudi Arabia
- United Arab Emirates
- South Africa
- Egypt
- Rest of Middle East and Africa
- North America
Geography Analysis
Asia-Pacific generated 52.59% of global revenue in 2025 and will grow at 4.83% a year to 2031. China combines a vast vehicle parc, strong start-stop uptake, and policy-driven recycling mandates that favor domestic vertically integrated producers. India's aftermarket offers significant upside, driven by short replacement cycles and a rising share of premium chemistries. ASEAN markets add thousands of new telecom towers each year, most of which specify VRLA batteries due to capital constraints and established recycling routes.
North America exhibits moderate expansion because electric vehicles reduce flooded SLI volume, yet aftermarket resilience persists thanks to 50% start-stop penetration in new-car sales. Recycling compliance costs are climbing as the U.S. Environmental Protection Agency tightens lead exposure limits for urban smelters. Europe faces similar regulatory pressures under the Battery Regulation 2023/1542, which stipulates 70% lead recovery by 2030 and digital battery passports by 2027. Faster EV adoption in Germany, France, and the United Kingdom accelerates SLI volume erosion, but premium AGM replacements boost average selling prices.
South America and the Middle East & Africa remain opportunity regions. Brazil's 50 million-vehicle parc and low EV penetration favor conventional and premium lead-acid formats, although economic volatility occasionally lengthens replacement cycles. Sub-Saharan Africa relies on lead-acid for 88% of base-station sites, citing theft risk and cost barriers to lithium-ion. Gulf Cooperation Council states and South Africa continue to install VRLA UPS systems for data-center expansions linked to digital-economy strategies. Across these regions, established collection and recycling networks reinforce the incumbency of the Lead-Acid Battery Market.
- Clarios
- Exide Technologies
- EnerSys
- GS Yuasa Corp.
- East Penn Manufacturing
- Panasonic
- Amara Raja Batteries
- C&D Technologies
- Leoch International
- Chaowei Power
- Narada Power
- NorthStar Battery
- Crown Battery
- Trojan Battery
- Camel Group
- FIAMM Energy Technology
- Hitachi Chemical
- HOPPECKE
- Shuangdeng (Sacred Sun)
- Sunlight Group
Additional Benefits:
- The market estimate (ME) sheet in Excel format
- 3 months of analyst support
TABLE OF CONTENTS
1 Introduction
- 1.1 Study Assumptions & Market Definition
- 1.2 Scope of the Study
2 Research Methodology
3 Executive Summary
4 Market Landscape
- 4.1 Market Overview
- 4.2 Market Drivers
- 4.2.1 ICE-vehicle parc replacement demand remains resilient
- 4.2.2 Telecom network densification in emerging Asia & Africa
- 4.2.3 Data-center UPS build-outs (Tier-2 cities)
- 4.2.4 After-market revenue lock-in for micro-hybrid SLI batteries
- 4.2.5 "Smart-mixing" additives boosting flooded-cell life
- 4.2.6 Low-speed EV boom in LMICs needing low-cost storage
- 4.3 Market Restraints
- 4.3.1 Li-ion cost curve crossing at <$70 kWh for automotive
- 4.3.2 Stricter EU end-of-life Pb limits
- 4.3.3 Insurance risk premiums for urban recycling clusters
- 4.3.4 Graphene-enhanced AGM cannibalising conventional VRLA
- 4.4 Supply-Chain Analysis
- 4.5 Regulatory Landscape
- 4.6 Technological Outlook
- 4.7 Porter's Five Forces
- 4.7.1 Bargaining Power of Suppliers
- 4.7.2 Bargaining Power of Buyers
- 4.7.3 Threat of New Entrants
- 4.7.4 Threat of Substitutes
- 4.7.5 Intensity of Competitive Rivalry
5 Market Size & Growth Forecasts
- 5.1 By Construction Method
- 5.1.1 Flooded
- 5.1.2 VRLA
- 5.2 By Application
- 5.2.1 Starting-Lighting-Ignition (SLI)
- 5.2.2 Stationary
- 5.2.3 Motive/Traction (Forklifts, Golf-carts)
- 5.2.4 Portable and Others
- 5.3 By Geography
- 5.3.1 North America
- 5.3.1.1 United States
- 5.3.1.2 Canada
- 5.3.1.3 Mexico
- 5.3.2 Europe
- 5.3.2.1 Germany
- 5.3.2.2 United Kingdom
- 5.3.2.3 France
- 5.3.2.4 Spain
- 5.3.2.5 Italy
- 5.3.2.6 NORDIC Countries
- 5.3.2.7 Russia
- 5.3.2.8 Rest of Europe
- 5.3.3 Asia Pacific
- 5.3.3.1 China
- 5.3.3.2 India
- 5.3.3.3 Japan
- 5.3.3.4 South Korea
- 5.3.3.5 ASEAN Countries
- 5.3.3.6 Australia and New Zealand
- 5.3.3.7 Rest of Asia Pacific
- 5.3.4 South America
- 5.3.4.1 Brazil
- 5.3.4.2 Argentina
- 5.3.4.3 Chile
- 5.3.4.4 Rest of South America
- 5.3.5 Middle East and Africa
- 5.3.5.1 Saudi Arabia
- 5.3.5.2 United Arab Emirates
- 5.3.5.3 South Africa
- 5.3.5.4 Egypt
- 5.3.5.5 Rest of Middle East and Africa
- 5.3.1 North America
6 Competitive Landscape
- 6.1 Market Concentration
- 6.2 Strategic Moves (M&A, Partnerships, PPAs)
- 6.3 Market Share Analysis (Market Rank/Share for key companies)
- 6.4 Company Profiles (includes Global level Overview, Market level overview, Core Segments, Financials as available, Strategic Information, Products & Services, and Recent Developments)
- 6.4.1 Clarios
- 6.4.2 Exide Technologies
- 6.4.3 EnerSys
- 6.4.4 GS Yuasa Corp.
- 6.4.5 East Penn Manufacturing
- 6.4.6 Panasonic
- 6.4.7 Amara Raja Batteries
- 6.4.8 C&D Technologies
- 6.4.9 Leoch International
- 6.4.10 Chaowei Power
- 6.4.11 Narada Power
- 6.4.12 NorthStar Battery
- 6.4.13 Crown Battery
- 6.4.14 Trojan Battery
- 6.4.15 Camel Group
- 6.4.16 FIAMM Energy Technology
- 6.4.17 Hitachi Chemical
- 6.4.18 HOPPECKE
- 6.4.19 Shuangdeng (Sacred Sun)
- 6.4.20 Sunlight Group
7 Market Opportunities & Future Outlook
- 7.1 White-space & Unmet-need Assessment

 閥控式鉛酸蓄電池(VRLA)市場報告:趨勢、預測與競爭分析(至2035年)
 固定式電池市場-2026-2032年全球市場預測閥控式鉛酸蓄電池(VRLA)市場:依電壓、類型、應用、國家及地區分類-全球產業分析、市場規模、市場佔有率及2026年至2033年預測
 電解電解液電池市場:商業機會、成長要素、產業趨勢分析及2026-2035年預測。鉛酸蓄電池市場:按類型、電壓範圍、電池結構、功能、應用和銷售管道分類-2026-2032年全球市場預測
 固定式鉛酸蓄電池:市場佔有率分析、產業趨勢與統計及成長預測(2026-2031 年)
 2026-2030年全球工業用鉛酸蓄電池市場
 2026-2032年歐洲乘用車鉛酸蓄電池售後市場北美鉛酸蓄電池市場:市場佔有率分析、行業趨勢和統計數據以及成長預測(2026-2031 年)VRLA電池:市佔率分析、產業趨勢與統計、成長預測(2026-2031年)